
Release Notes - Studio
Release notes covering all releases of the Foursquare Studio platform, including:
- Foursquare Studio
- Foursquare Data Catalog
- Foursquare Map SDK (See Change log for details)
- Foursquare Studio Data SDK (See Change log for details)
Version 1.92
Released July 31st, 2024
Kinetica Data Connector
Studio now includes a Kinetica data connector, enabling you to query data directly from your Kinetica cluster and visualize it in Studio. Kinetica's set of advanced geospatial features make it an excellent companion to the visualization capabilities of Foursquare Studio.

Map and Data SDK Updates
The Map and Data SDKs have been updated to ensure mutual compatability. In addition, both packages are now available as:
foursquare.map-sdk(Python) and@foursquare/map-sdk(JavaScript)foursquare.data-sdk(Python) with CLI commands viafsq-data-sdk
To upgrade, please rename your imports accordingly.
Version 1.88
Released June 7th, 2024
Map SDK Version 3.0
Our newest version of the Map SDK has landed with a variety of improvements to the developer experience -- especially Python users.
New additions:
- Top level exports - The complete API is now exposed at the "root level". Import via
import foursquare.map_sdk as map_sdk, then access classes and functions viamap_sdk.*(for examplemap_sdk.create_map()ormap_sdk.PointLayer()) - Keyword Arguments - All Python functions and class initializers now accept their arguments as keyword arguments (kwargs) as well.
- Layer classes - All 19 layer types now have specialized Python classes that cover all functionality for each layer type, with optimized type hints and docstrings
.to_json()and.from_json()methods are provided to quickly retrieve layers' JSON configuration and use in combination with the layer JSON configuration editors in FSQ Studio, as well as other Map SDK functions, e.g.map.add_layer_from_config(my_trip_layer.to_json())..clone()method allows you to create a deep copy of a layer instance, making it easy to produce multiple layers with minor variations.
Version 1.85
Released April 24th, 2024
JSON Config Editor for Layer Timeline Animation
The configuration editor has been extended to timeline filters and trip layer. Programmatically control your animations in our JSON code editor, or copy the configuration and paste it in other maps.
JSON config editor for layer timeline animation
Map SDK 2.0
The new version of Map SDK brings closer integration of various Foursquare products and capabilities, setting up a path for our users to be able to utilize cloud-based geospatial functionality and have more control and security over access and management of individual and organization resources. For more info see Map SDK changelog.
Version 1.84
Released April 11th, 2024
Redesigned Navigation Bar
The Studio navigation bar has been aligned with other Foursquare products. There is also new menu giving quick access to other Foursquare products.
Redesigned navigation bar
Tooltips for Disabled Buttons
The dataset action menu, now provides hover tooltips on disabled menu items, explaining why those actions are not available for that dataset.
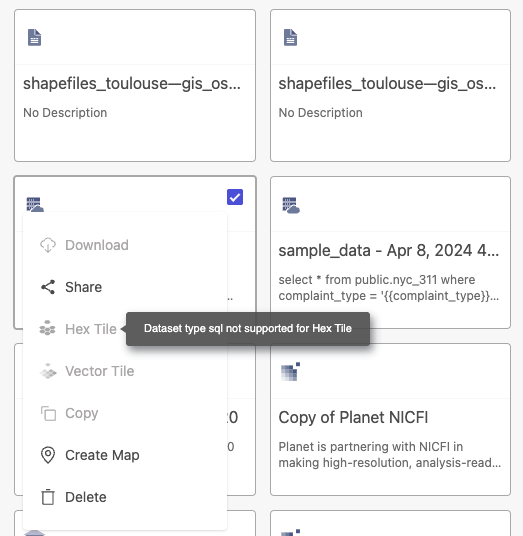
Disabled reason for dataset action buttons
Version 1.82
Released March 14th, 2024
Support for Visibility Checkboxes in Chart Legends
With visibility checkboxes you can render checkboxes in the legend to toggle the visibility of individual data series. This can be applied for following chart types in Studio: line chart, bar chart, and horizontal bar chart.
Chart legends with visibility checkboxes
Version 1.80
Released February 14th, 2024
Databricks Connector
Studio now offers a Databricks data connector that lets you query data directly from your Databricks cluster and visualize it in Studio.

Bar Chart: New Labeling and Grid Configurations
Additional options have been added to customize bar chart label values. You can choose to show label values only, or both group names and their values. You also have more control over when label values are hidden if the bar width or height becomes too small.
Version 1.79
Released February 1st, 2024
Directly Upload/Download PMTiles Files
You can now upload external vector tile datasets in the PMTiles file format directly to the Studio cloud, creating a new dataset. You can also download vector tiles generated by Studio as PMTiles files that you can use in other tools. Upload/download of PMTiles is available both in the workspace and via the Data SDK.
JSON Editor in the Export Image Modal
In Studio's Export Image modal users can edit the JSON and apply it to the exported image which will update to match the new state defined in the JSON.
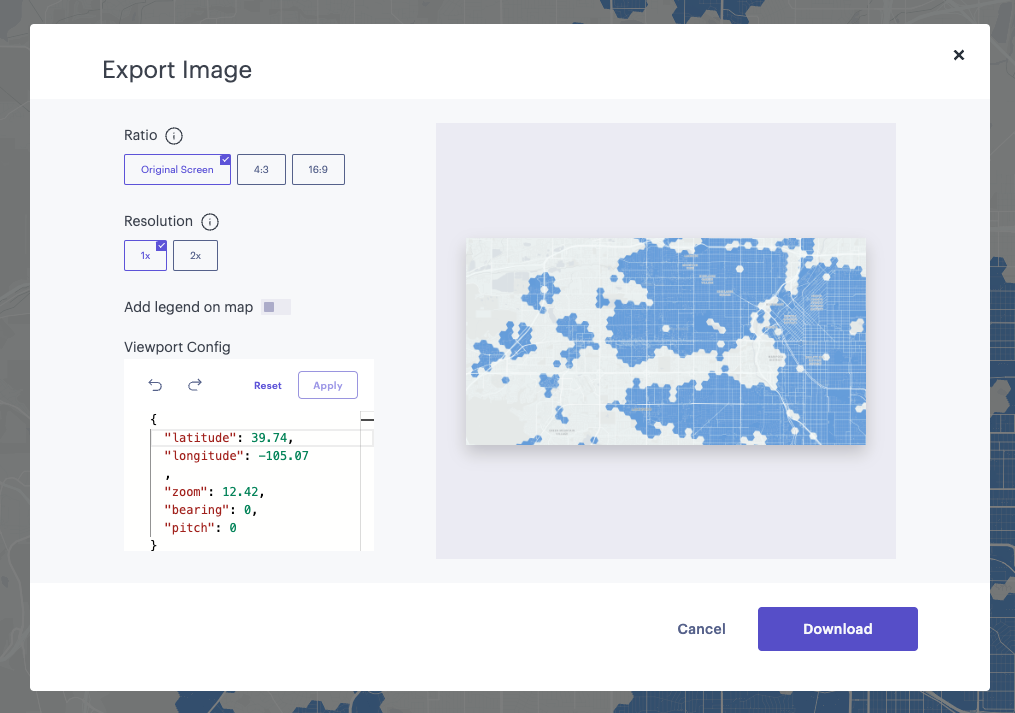
JSON Editor in the Export Image modal.
Shared Maps Info in User Profile Info
Enterprise users can now see number of maps user shared with organization. There is a new Shared Maps field iin the user profile info.
Version 1.78
Released January 18th, 2024
FlatGeoBuf Support
FlatGeobuf is a new binary geospatial data format that allows users to work more efficiently with vector data. It can be used as a replacement for GeoJSON, providing smaller file sizes and faster loads.
Tile Size Options in Vector Tile Creation Panel
When vector tiling big datasets, the top-level tiles that are shown when looking at large parts of the map will become big and some data needs to be dropped. Users can now control the size of generated tiles to make their own tradeoffs between loading speed and detail.
Tile size options can affect how many features are kept in a tile on higher zoom level.
Replace Dataset: Delete Original Option
When using replace dataset Studio will remove original dataset from map by default, but dataset will still remain in user dashboard. It is sometimes desirable to drop the original dataset from dashboard also. Now, Studio offers an option to "Delete existing dataset" which will, if selected, delete the existing dataset that is being replaced. Note that this way of replacing will also delete the original dataset from the dashboard as well and the deleted dataset will be unavailable in other assets if used (i.e. other maps and queries).
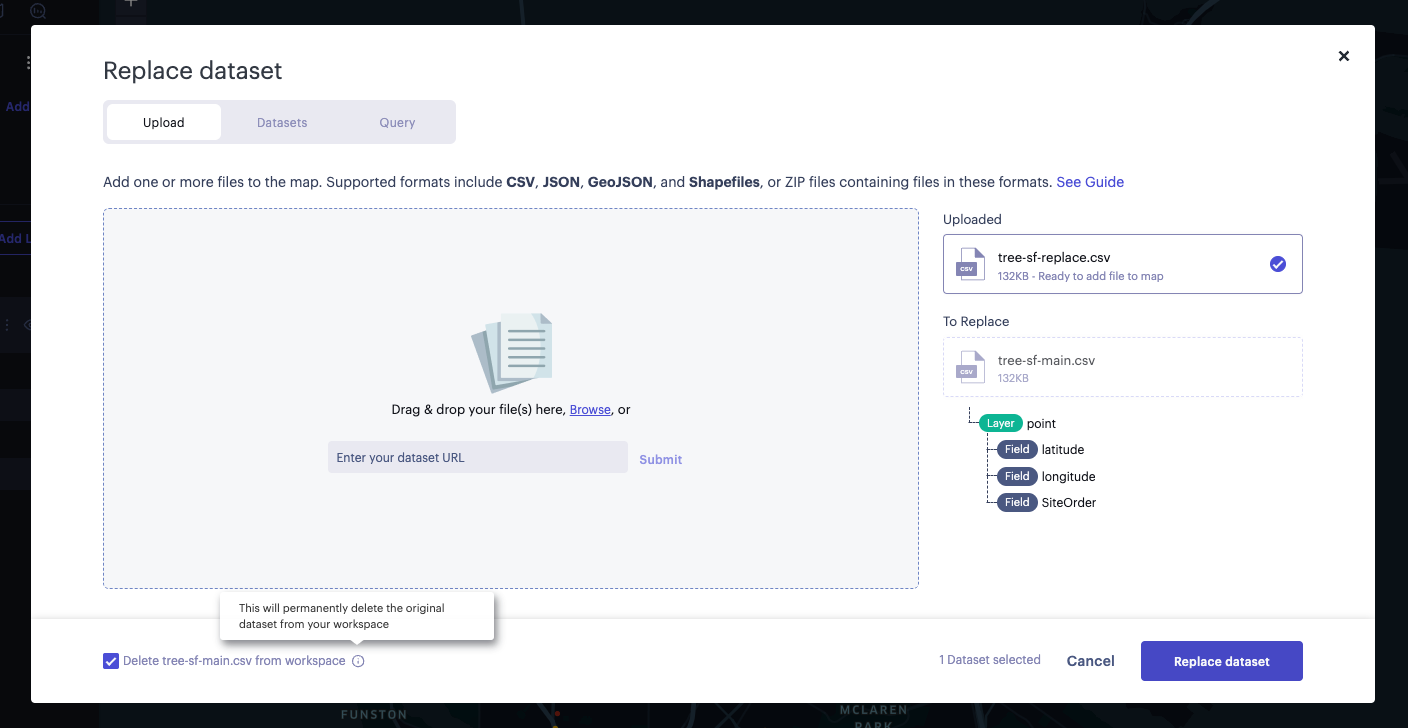
Delete original dataset from workspace option in replace dataset dialog.
Version 1.76
Released December 13th, 2023
Vector Tile Generation
Studio can now generate Vector Tiles directly from datasets in various formats, such as GeoJSON and CSV. This process converts enormous tabular datasets into snappy, quick-loading tiles that closely mirror the original data.
Read our visualization guide and check out our new blog post, offering a complete look into this new feature with several examples.
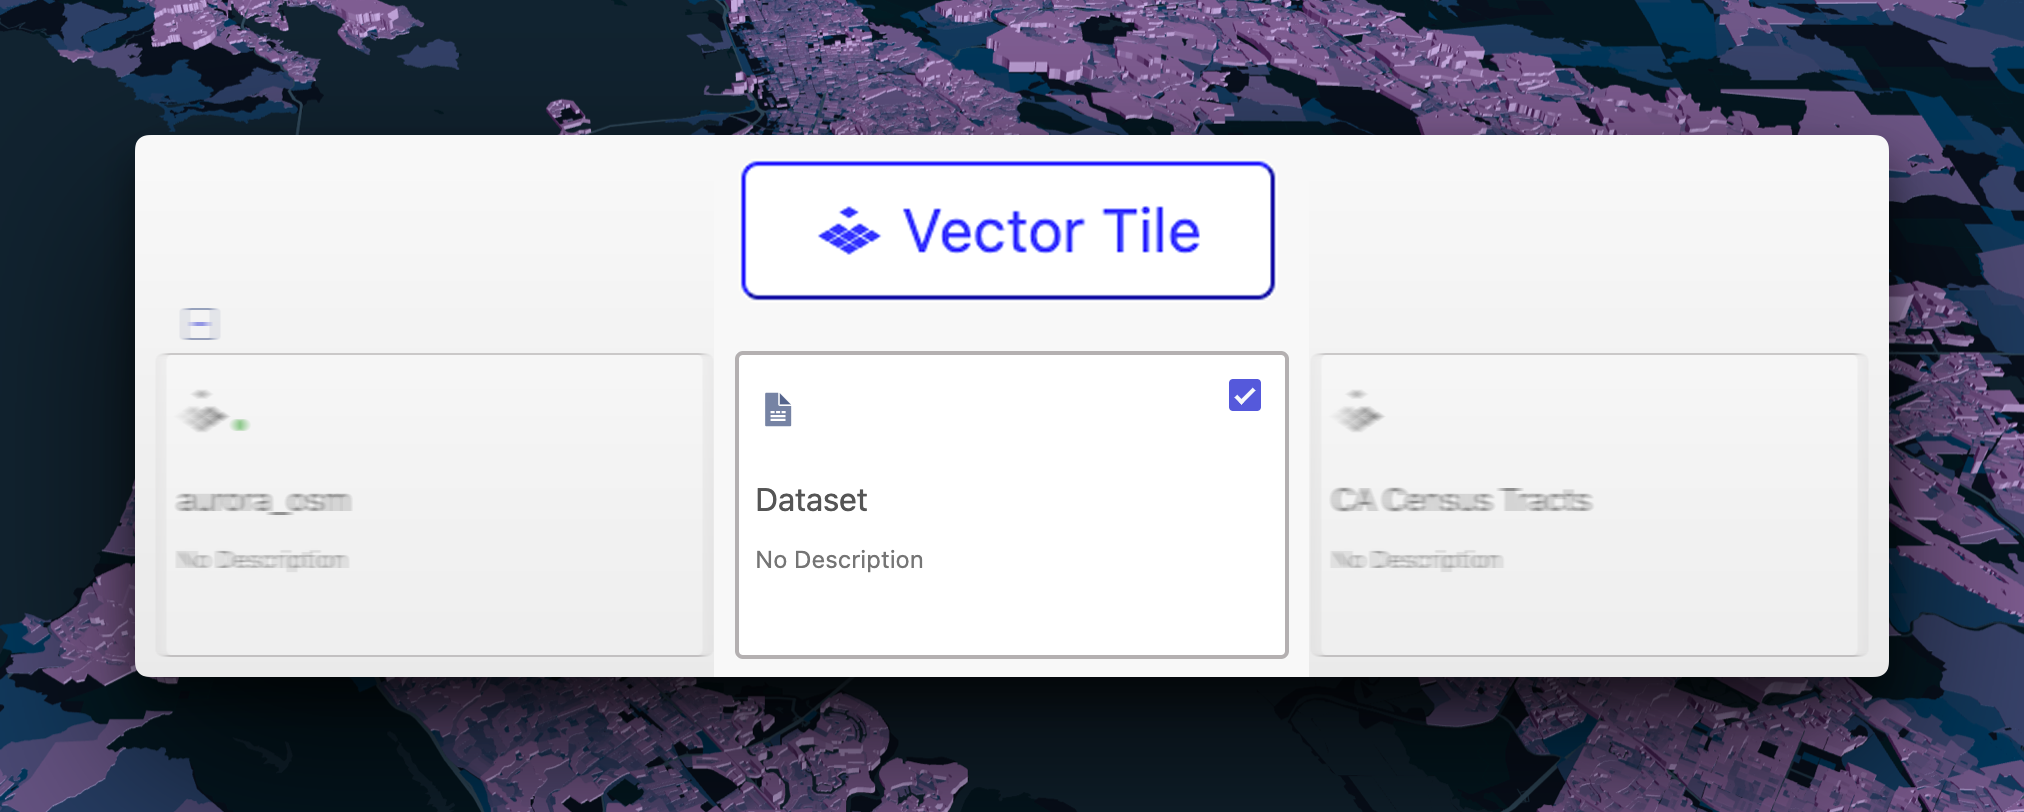
The Vector Tile option now appears when selecting a supported dataset.
Improved Legend Configuration
The legend can now be configured from Studio's left panel. Hide layers and layer groups from the legend, rename any labels, or toggle the entire legend from the Interactions tab.
kepler.gl Map Syncing
kepler.gl maps can now be saved directly to your Studio account. Bring kepler.gl maps to make use of Studio's many additional features.

kepler.gl maps can be brought into Foursquare Studio.
Seats and Tiers
Users can now see their seat and organizational tier by clicking the user icon in the top-right of Studio's dashboard. Users can also see their total allotted maps, datasets, and storage from this window.
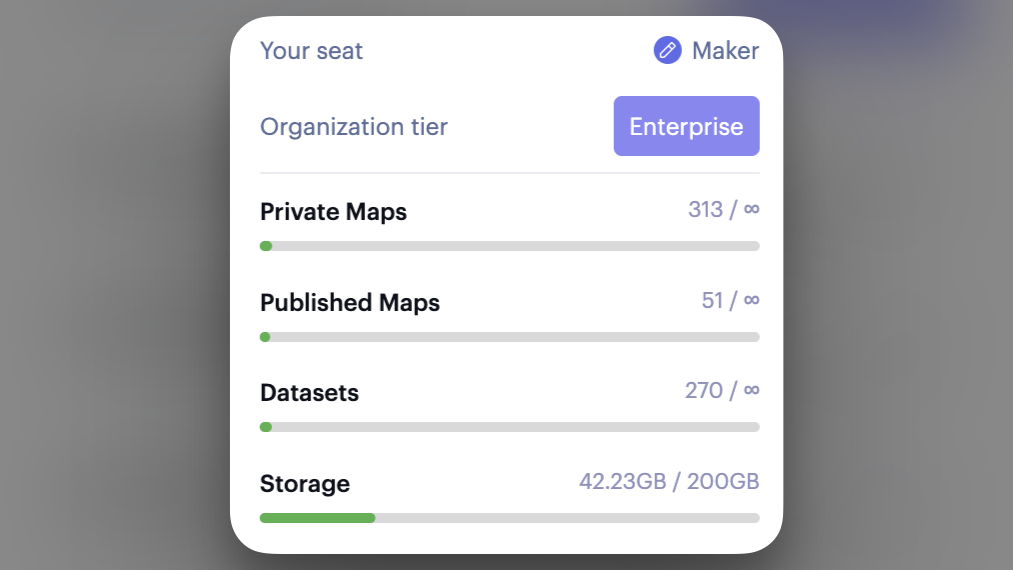
Your seat, tier, and storage capacity are now available at a glance.
Dynamic SQL Dropdown
Queried datasets now offer Dynamic SQL dropdowns. Define SQL that selects the values you wish to appear in a dropdown on the map. When users select a new value from the dropdown menu, new data is queried and added to the map.
Snowflake Key-pair Authentication
Studio's Snowflake data connector now supports key-pair authentication, which inherently provides enhanced authentication security.
Vector Tile API
Vector tiles can now be generated via a new endpoint, which can be accessed directly via API or through Python bindings from the Data SDK.
Version 1.74
Released November 7th, 2023
Legend: Move and Resize
Legends can now be repositioned by drag-and-dropping them to any spot on the map. Resize the legend by pulling the frame up and down.
Charts: Hints
In both the Line Chart and Bar Chart, you can now incorporate custom hints to help viewers interpret the chart. These hints can include variables, pulling data from the chart to help describe even the most complex charts.
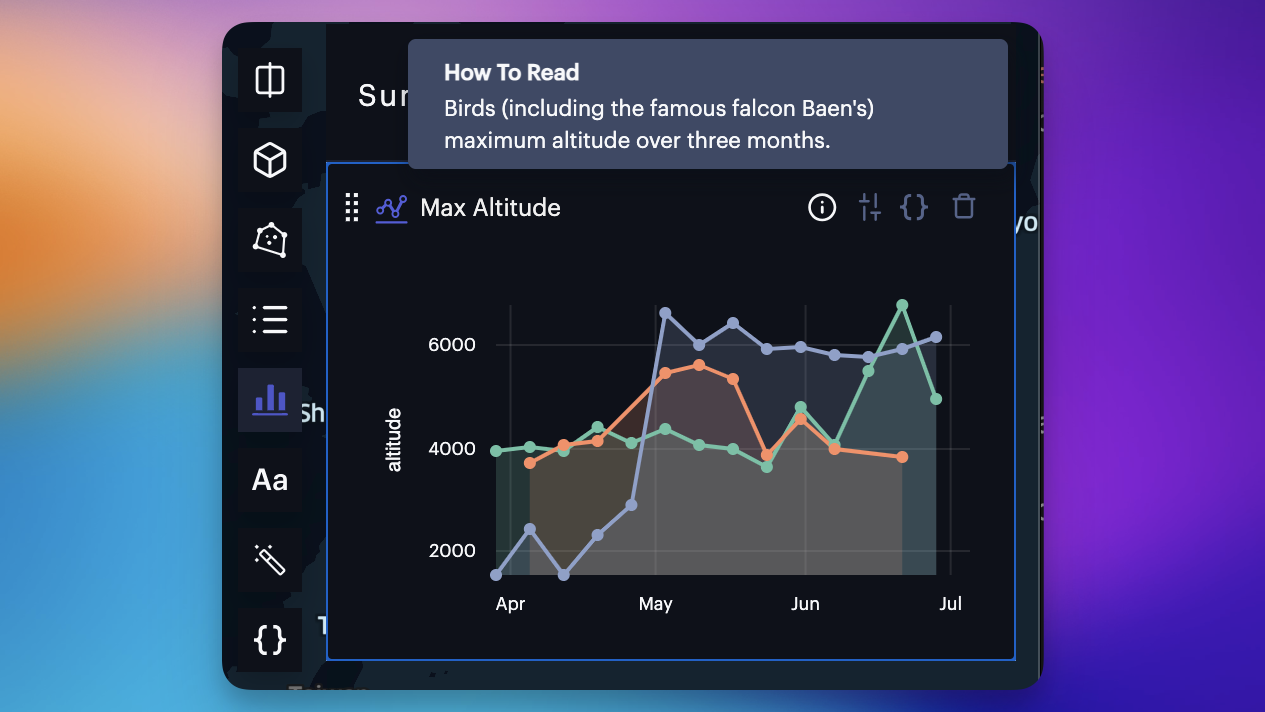
A chart hint displays when hovering over the ⓘ button.
Map SDK: Annotation API
You may now add annotations to maps via the Map SDK. See an example here, rendering a lightweight development environment in your browser.
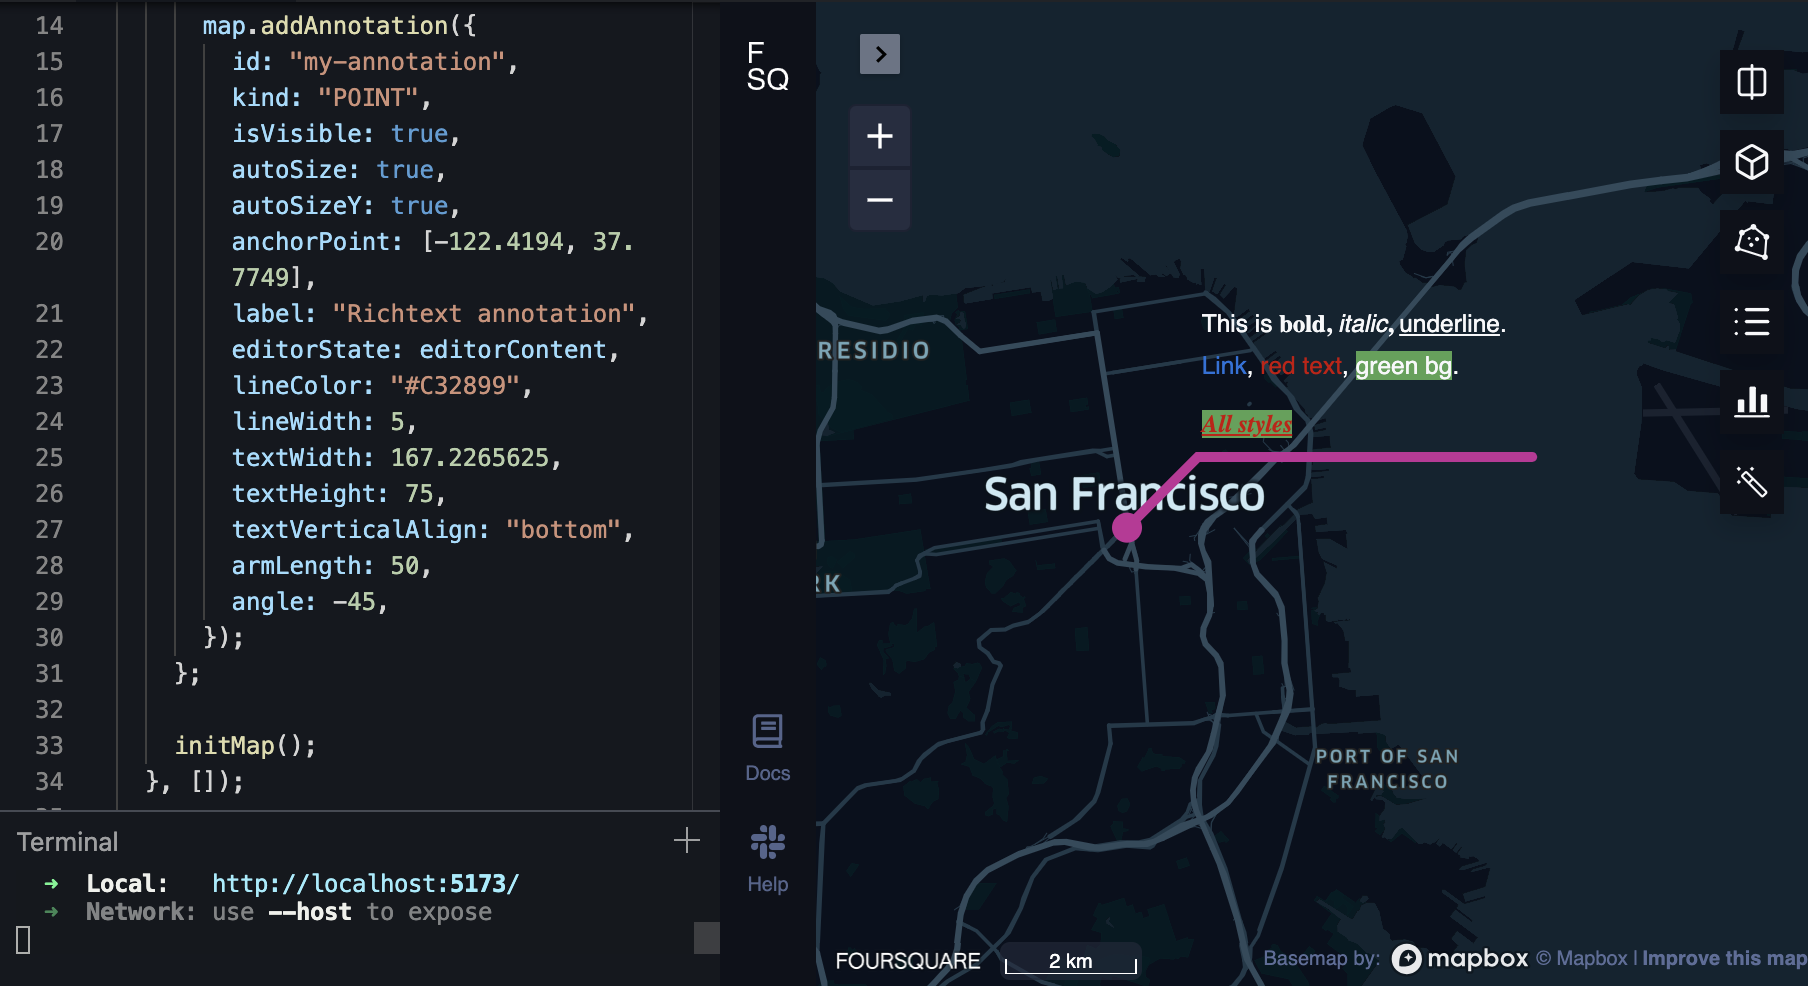
Creating an annotation from the Map SDK.
Base Map Update
Kontur Base Map Removal
As of version 1.74, Kontur base maps are no longer supported in Foursquare Studio. Maps using the Kontor Lines basemap will now use the Studio light base map, and maps using the Kontur Zrok basemap will now use the Studio dark base map. These base maps should be visually similar, however you can open your basemap settings and manually select a new base map.
Version 1.71
Released September 27th, 2023
Map Scale
Studios maps now have a scale that indicate real-world distances in kilometers.
Map SDK: Load Published Maps
The Map SDK can now be used to work with and control published maps. Simply supply the map's identifier to the createMap() function.
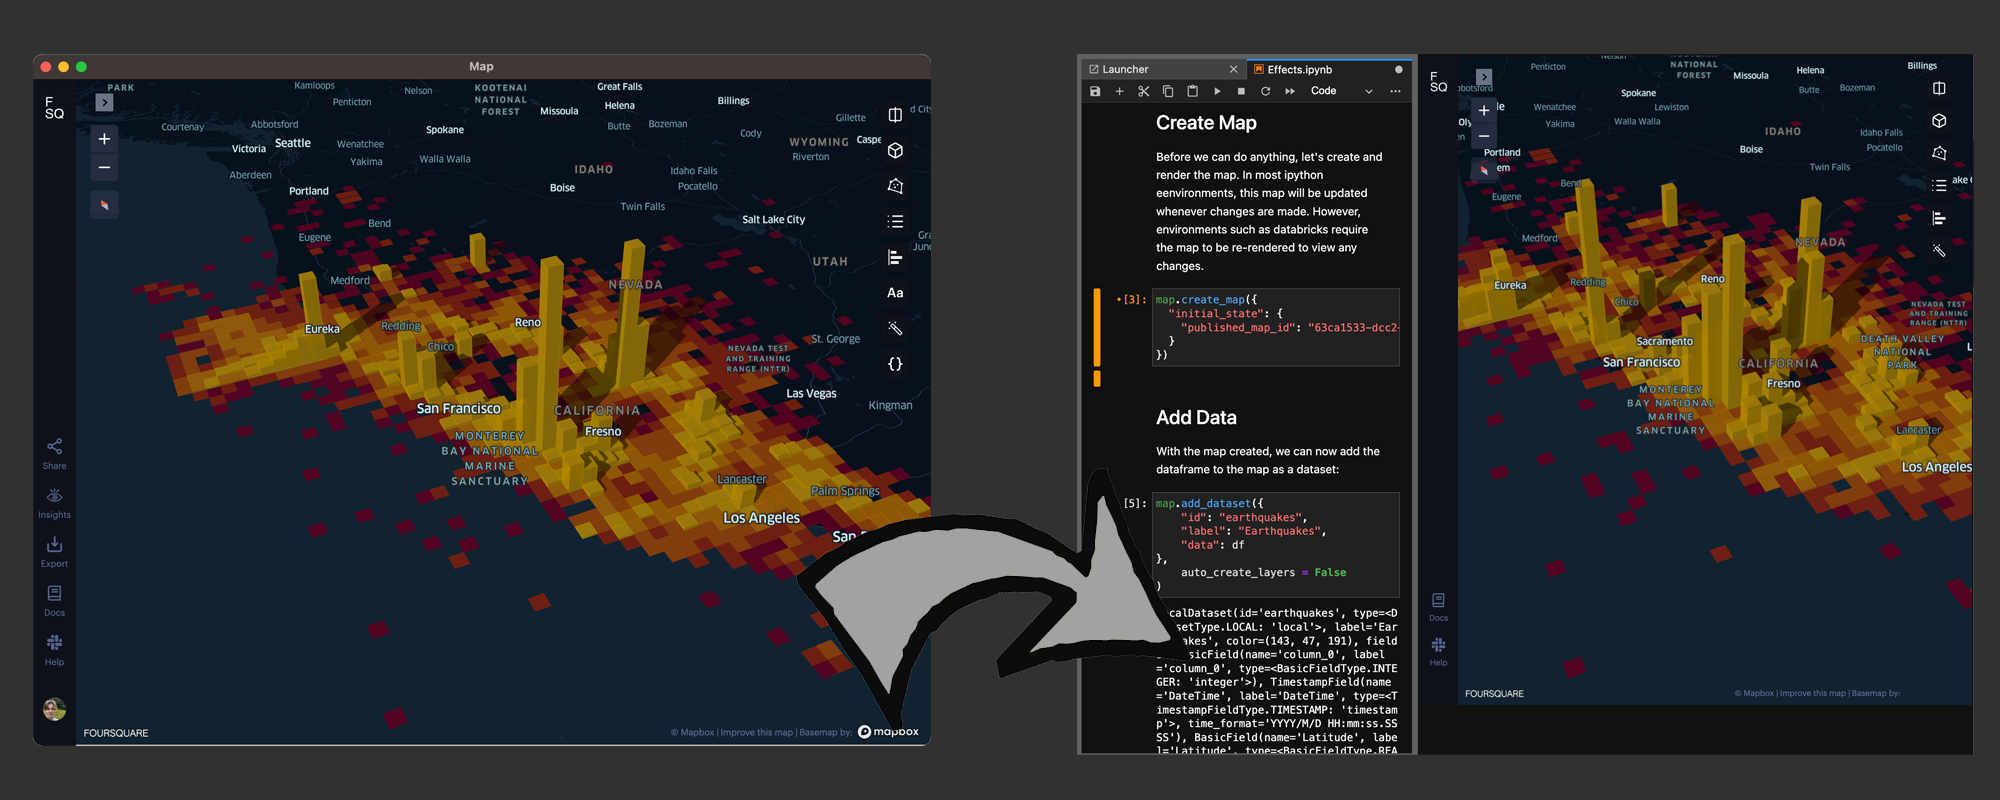
Creating a map in Studio, then loading it in a Jupyter Notebook via the Map SDK.
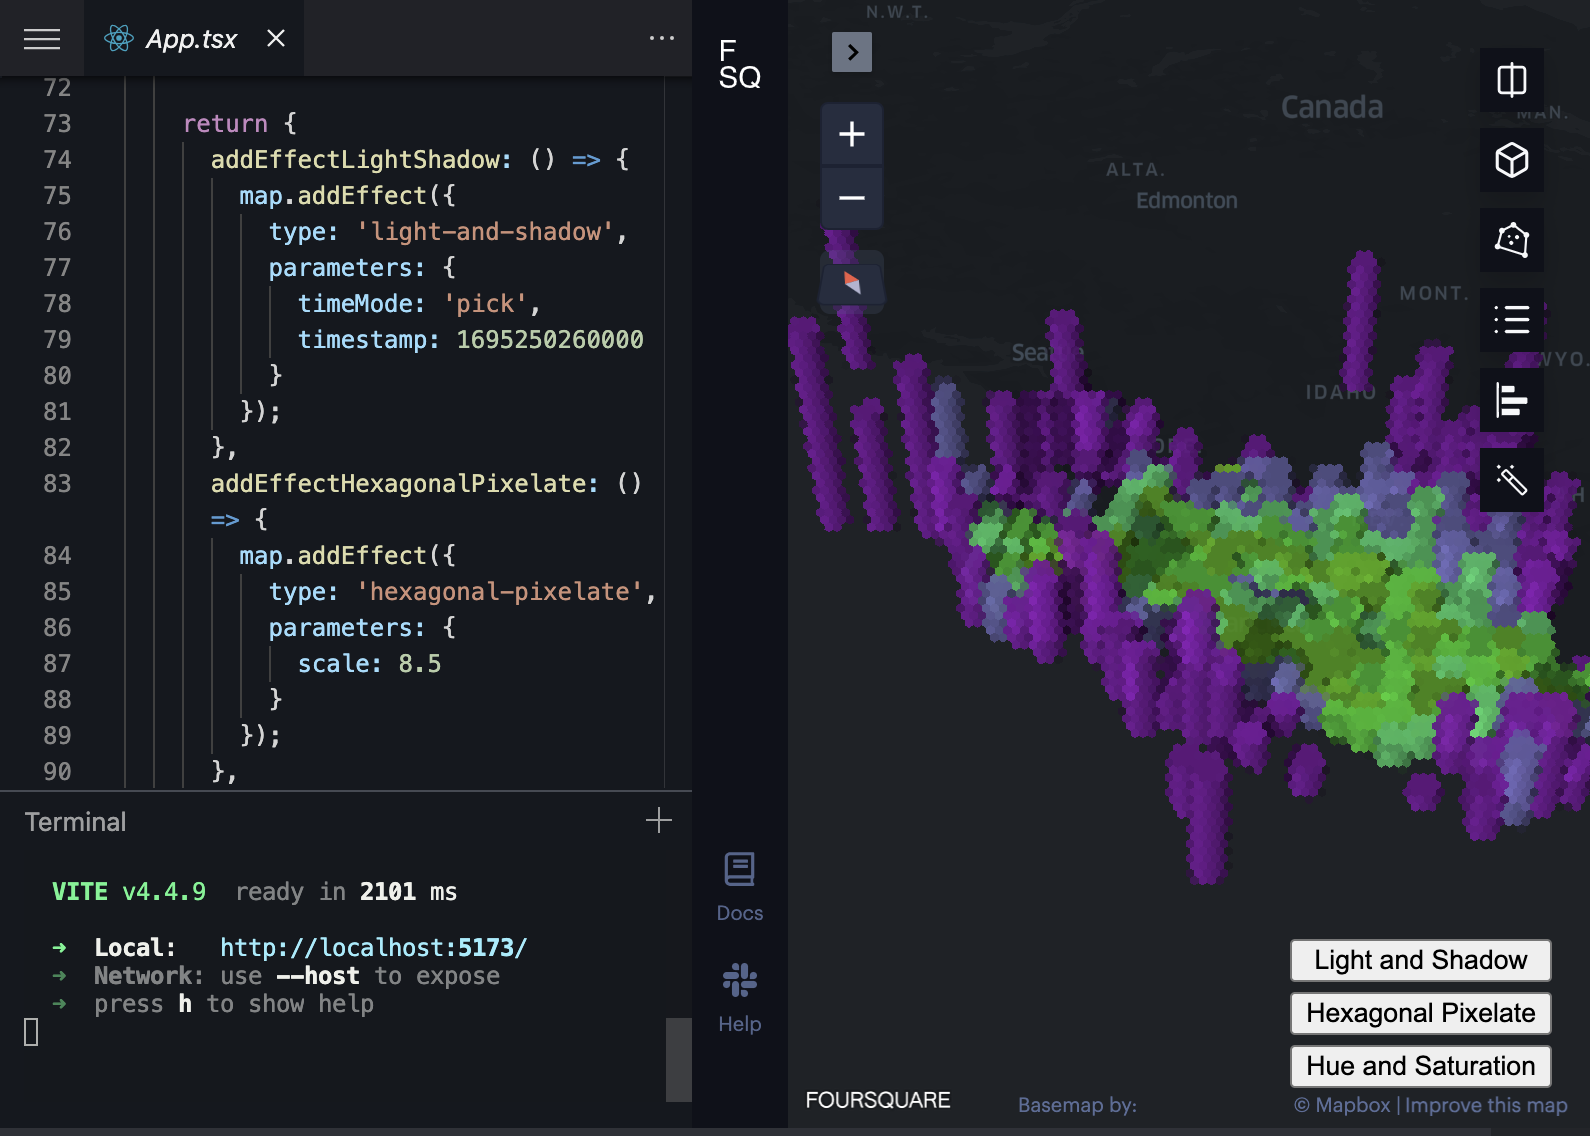
Map SDK: Effects
Post-processing effects can now be created and controlled via the Map SDK. Apply stunning visual effects such as light and shadow programmatically. See an example here.
Map SDK Examples
The Map SDK documentation now offers fully interactive examples in both JavaScript sandbox and Python notebook formats.
Version 1.70
Includes minor changes from version 1.69
Released September 13th, 2023
Collaborative Sharing
Studio users may now invite colleagues to edit their maps, allowing members/teams to work together on a single map rather than juggle several copies of the project. Collaboration is accompanied by Data API and SDK support, offering a programmatic approach to managing editor permissions.
New Share Modal
The Share modal has been updated to emphasize collaboration, and now allows you to specify email addresses to seamlessly invite specific users as viewers and editors. You can also share the map with your organization or publish it for an external viewing audience.
"Shared with Me" Workspace Tab
In the Workspace, find all assets shared with your email in a new Shared with Me tab. Assets shared at an organization level can still be found in your organization's tab.
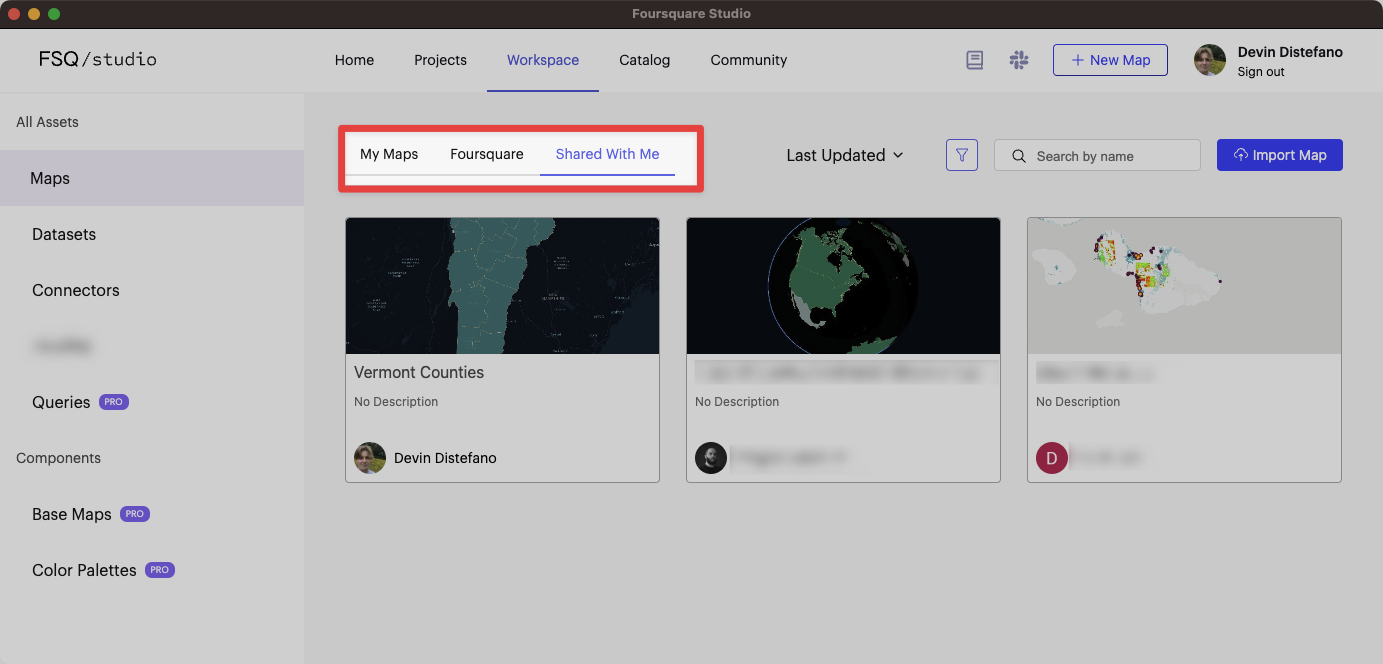
The new "Shared with Me" tab showing maps shared via email.
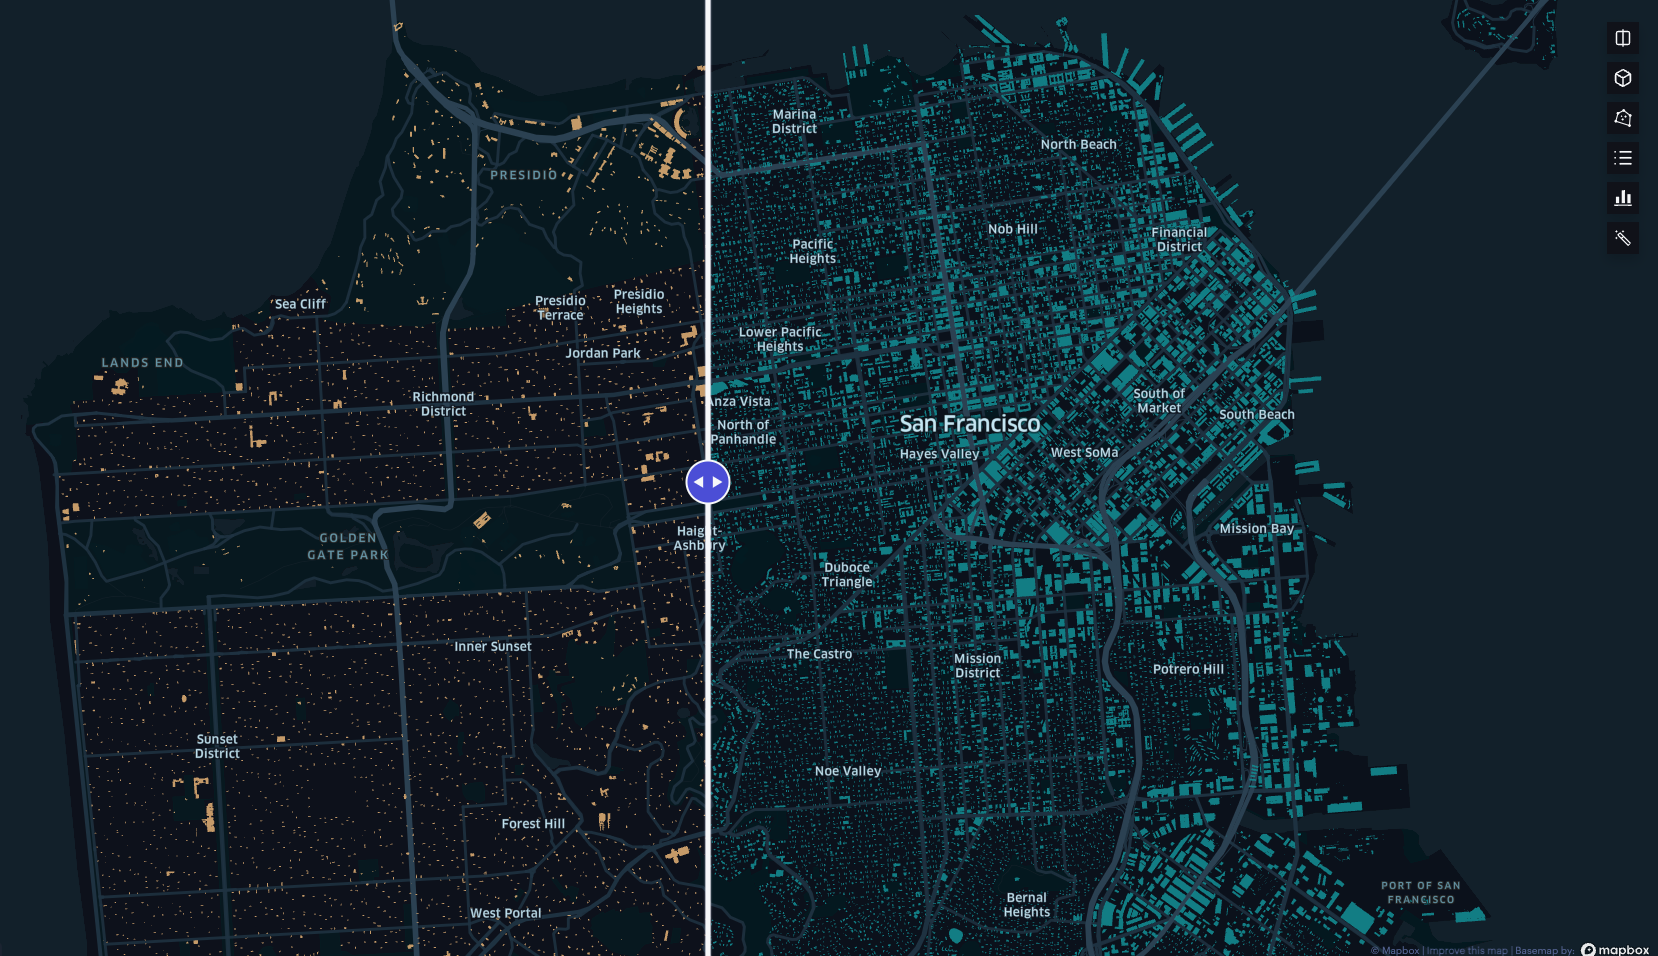
Zoom Controls
New zoom controls let you step through resolution levels. These controls provide fine control over the zoom level of your map, and are even present on alternative map views, such as dual map mode, where zoom buttons appear for each individual map view.
Version 1.68
Released August 16th, 2023
3D Tiles
Studio is rolling out support for 3D tiles, starting with Google's Photorealistic 3D tiles. Large-scale 3D data allows businesses to model and visualize their operations in a realistic setting that mirrors the real world.
Post-Processing Effects
Elevate your geospatial presentations with a collection of post-processing effects, adding a unique artistic touch to your maps without ever leaving Studio. This tool goes beyond simple image processing, offering effects such as Light and Shadow that accurately simulates sunlight casting over the map, accentuating 3D elements with striking shadows.
Vector Tile Style Improvements
The Vector Tile Layer configuration options have been aligned with the Polygon Layer. Whether your geometries are loaded from vector tiles and visualized with a Vector Tile, or loaded from a GeoJSON file and visualized with a Polygon Layer, you can apply the same styling including custom stroke width and color.
S3 Connector
Studio now offers an S3 data connector that lets you pull data directly from your Amazon S3 buckets into Studio.

Parquet + ORC Support
Through the Amazon S3 connector, Studio users can now select Parquet and ORC files as input when building Hex Tiles. Follow our guide to try it yourself.
Data SDK: Sharing and Permissions
You can now share and un-share maps, datasets and data connectors directly from the Data SDK via the new permissions endpoints.
Data SDK: External/Cloud Datasets
You can now create "external datasets" through the Data SDK. External datasets are data sources that reference an external URL. This feature can be used alongside the S3 connector to pull data from the user's own cloud. External datasets are loaded from the external source every time they are used, and will not be stored in Foursquare's cloud.
Version 1.67
Released July 26th, 2023
Color Palette Library
Users can now save custom color palettes to personal libraries. Organization members can work together to create a shared library of color palettes, facilitating brand consistency and fulfilling different color demands.
Filters: Config Editor
The configuration editor has been extended to filters. Programmatically control your filters in our full-featured code editor, or copy the configuration and paste it in other maps.
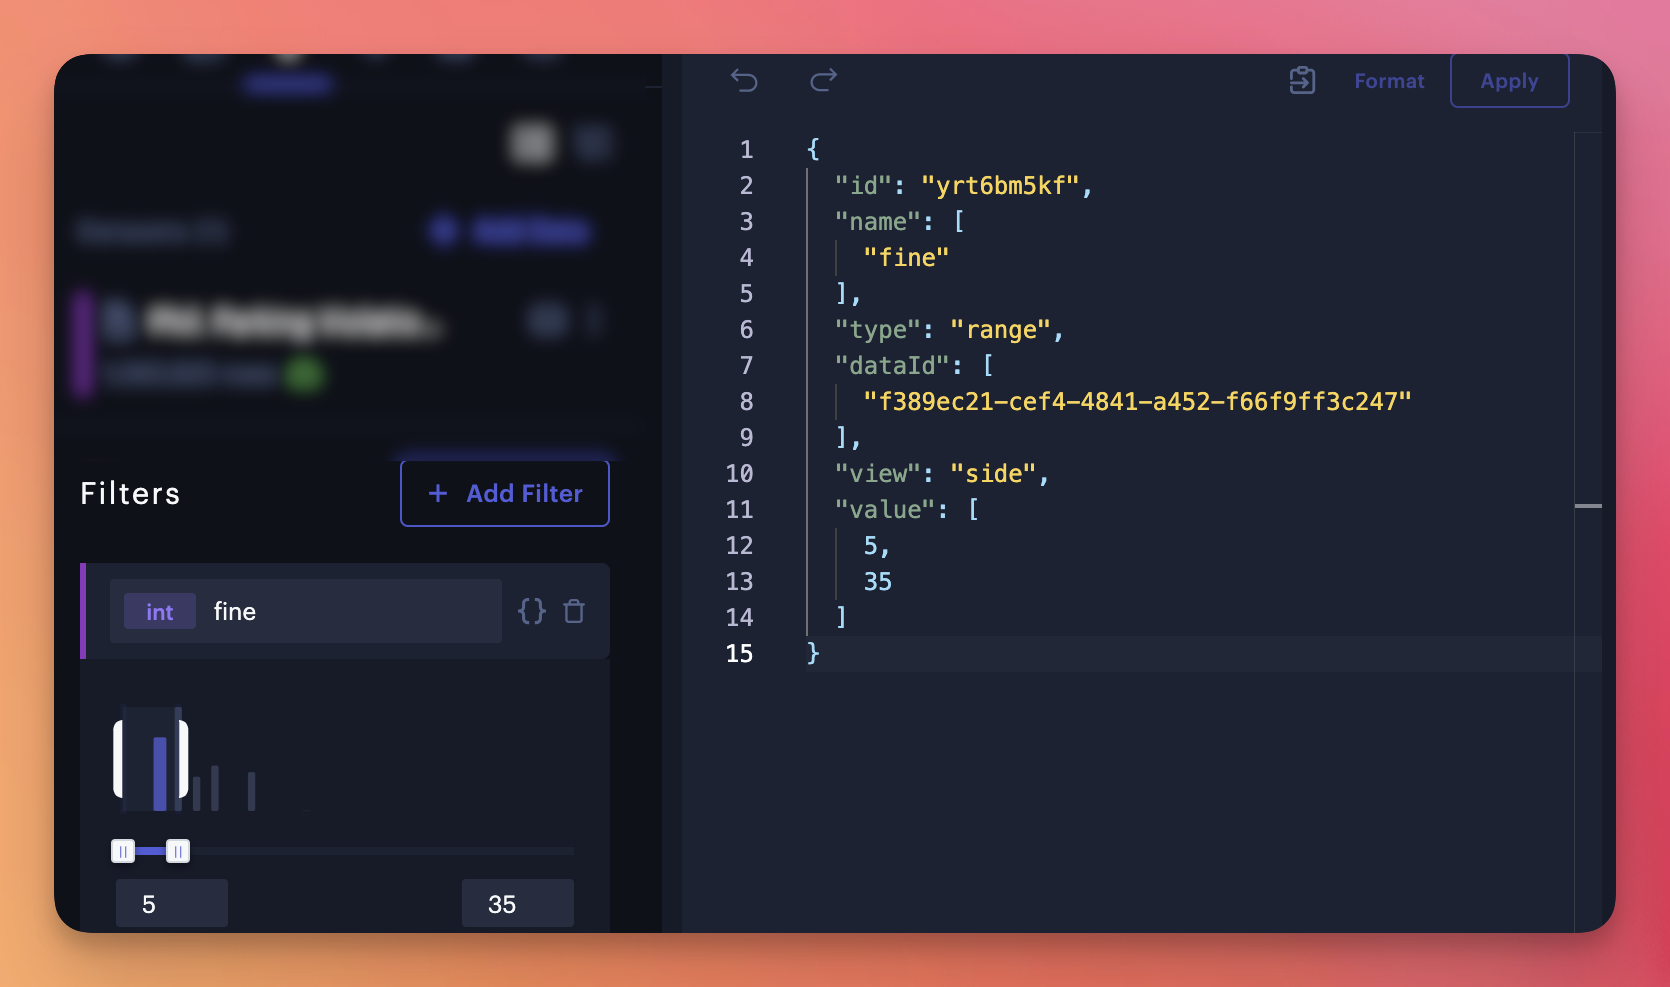
Creating a range filter via the config editor.
Bar Chart: Manual Sort
Bars in the Bar Chart can now be manually sorted, allowing users to arrange them in any desired order.
Grafana Plugin Update
Our Grafana plugin has been refreshed with export image/map functionality and other improvements. Learn how to install the plugin in your Grafana environment.
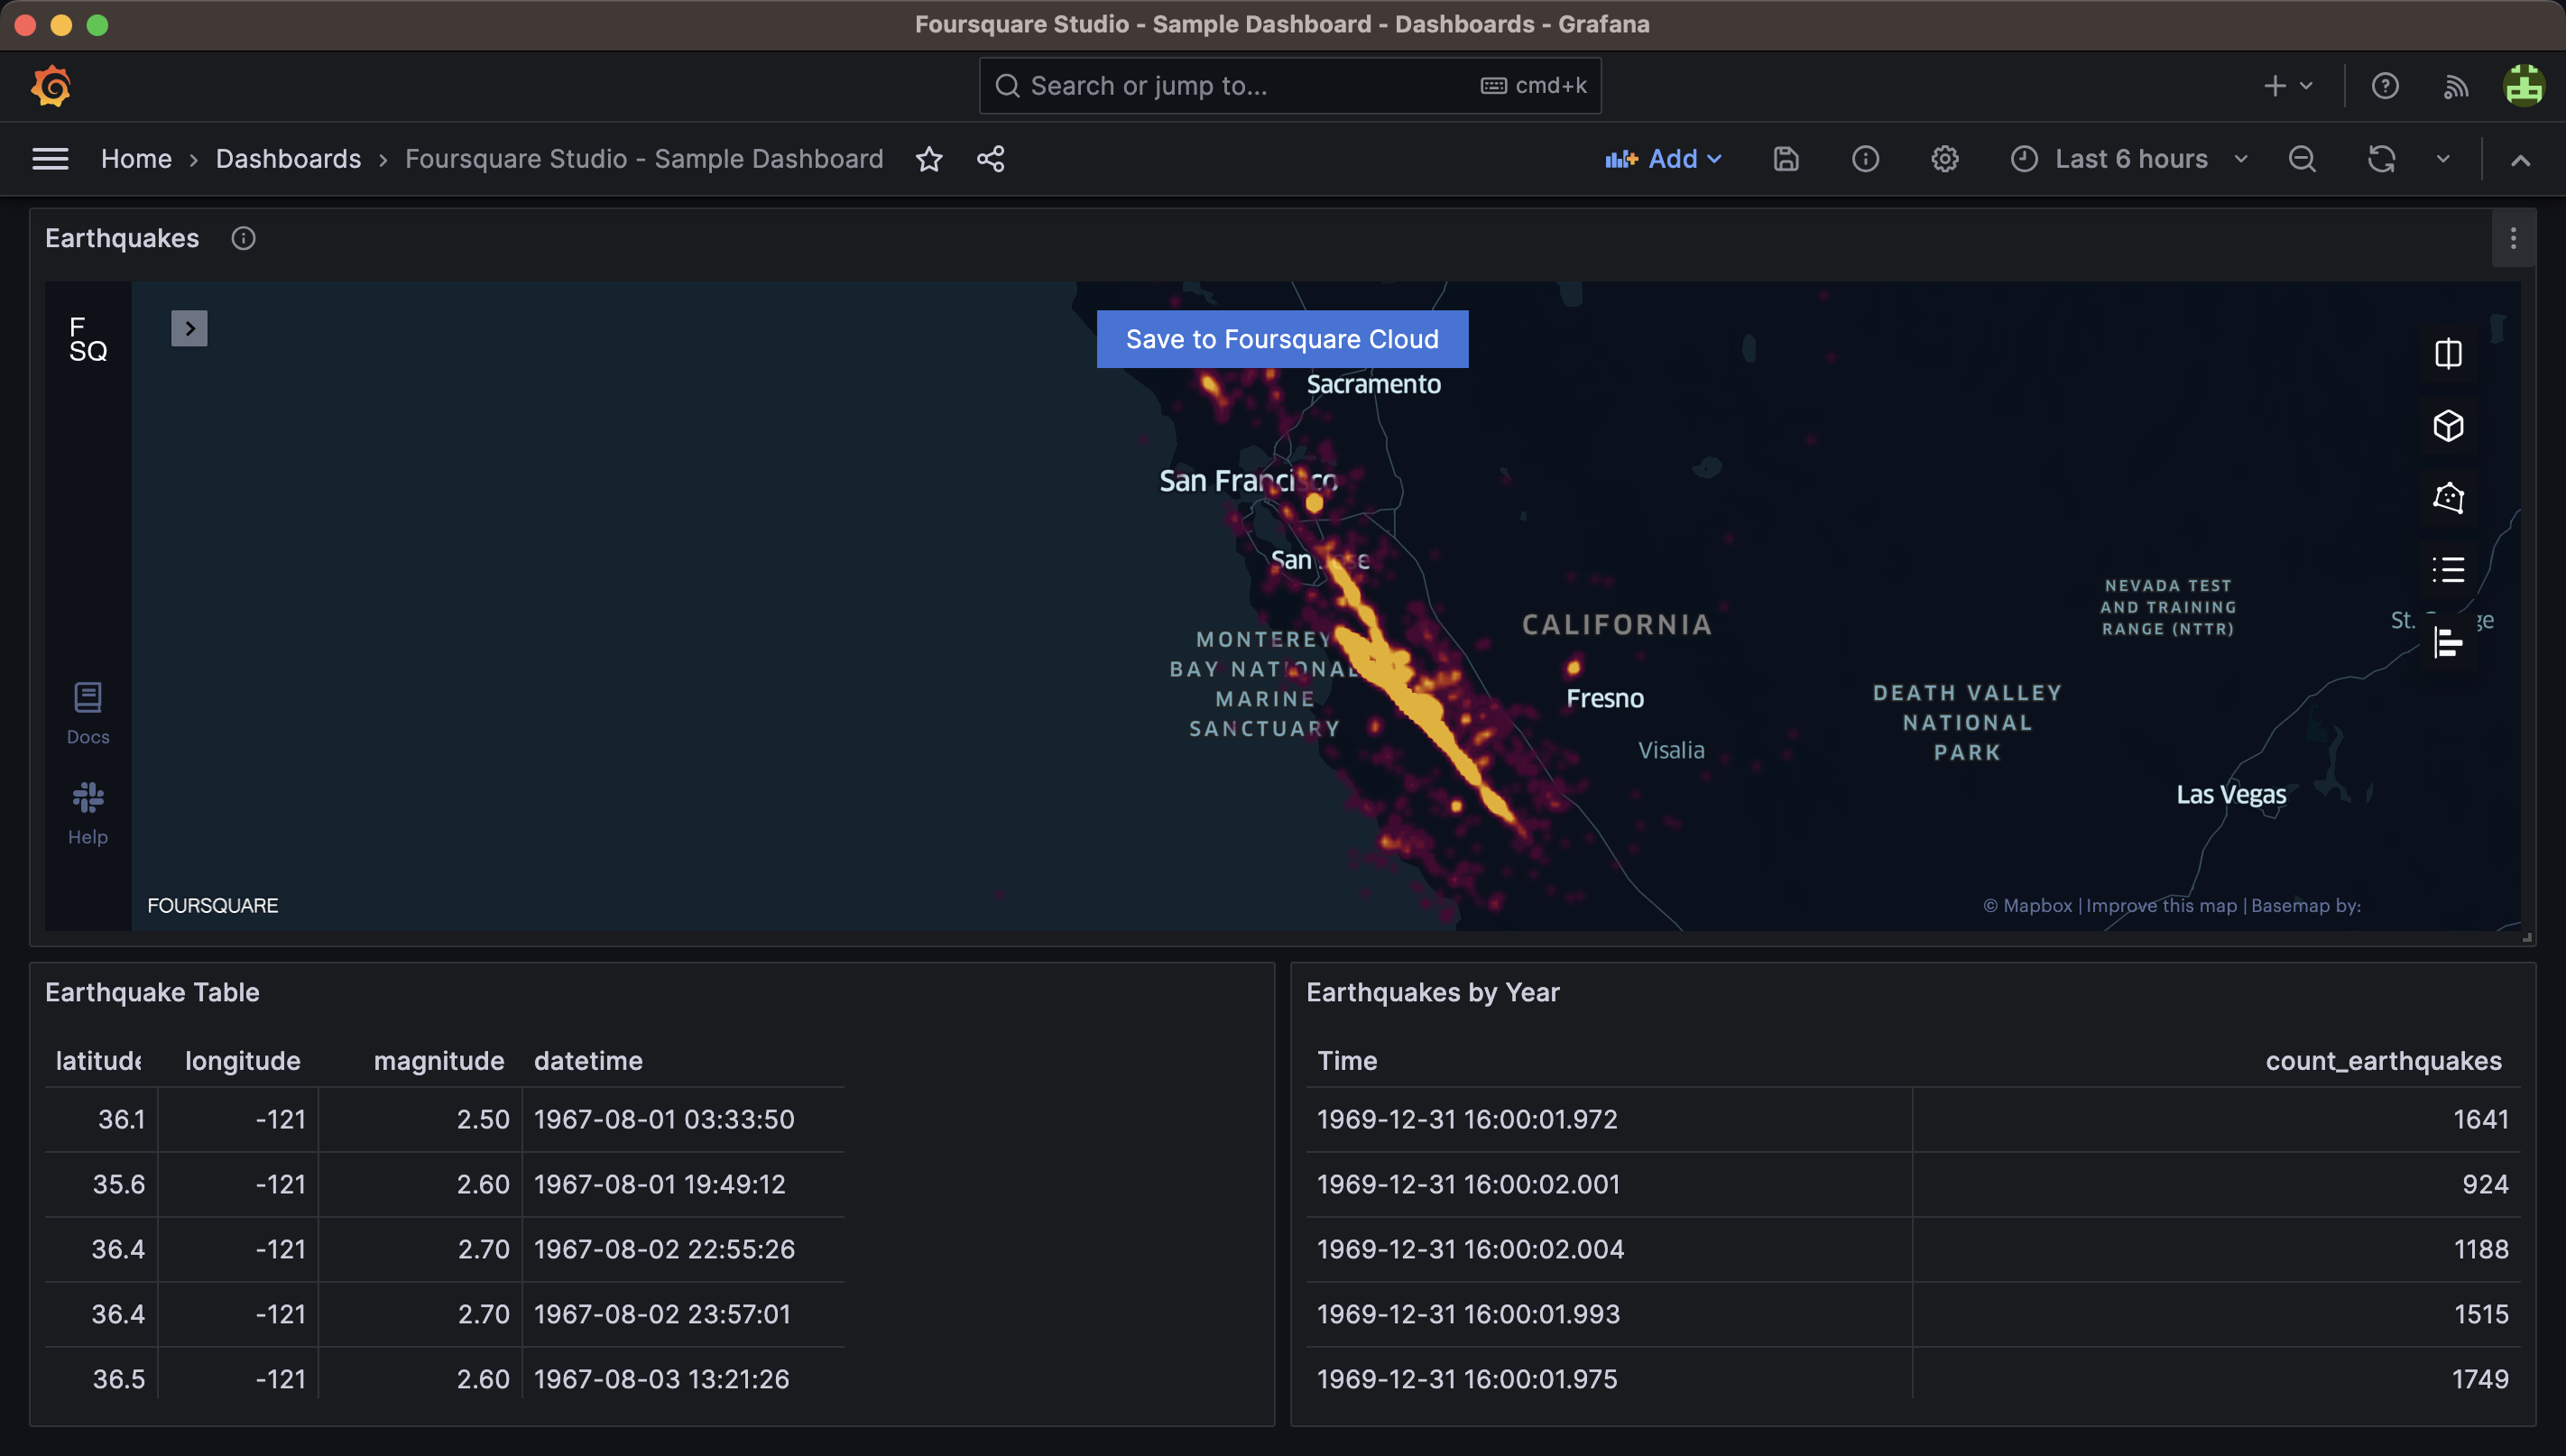
Example of the Foursquare Studio panel in Grafana.
QGIS Plugin Update
Studio's QGIS plugin, which allows users to export QGIS maps to Studio, now supports additional color scales/symbologies, including logarithmic, pretty breaks, and natural breaks (Jenks).
Version 1.66
Released July 11th, 2023
Tooltip Reordering
Columns in the mouse-over tooltip can now be easily reordered by dragging and dropping the labels.
Layer Group Improvements
We have implemented a redesign of Layer Groups, enhancing visual clarity and overall usability. Use Layer Groups to neatly sort your layers into folders for better organization.
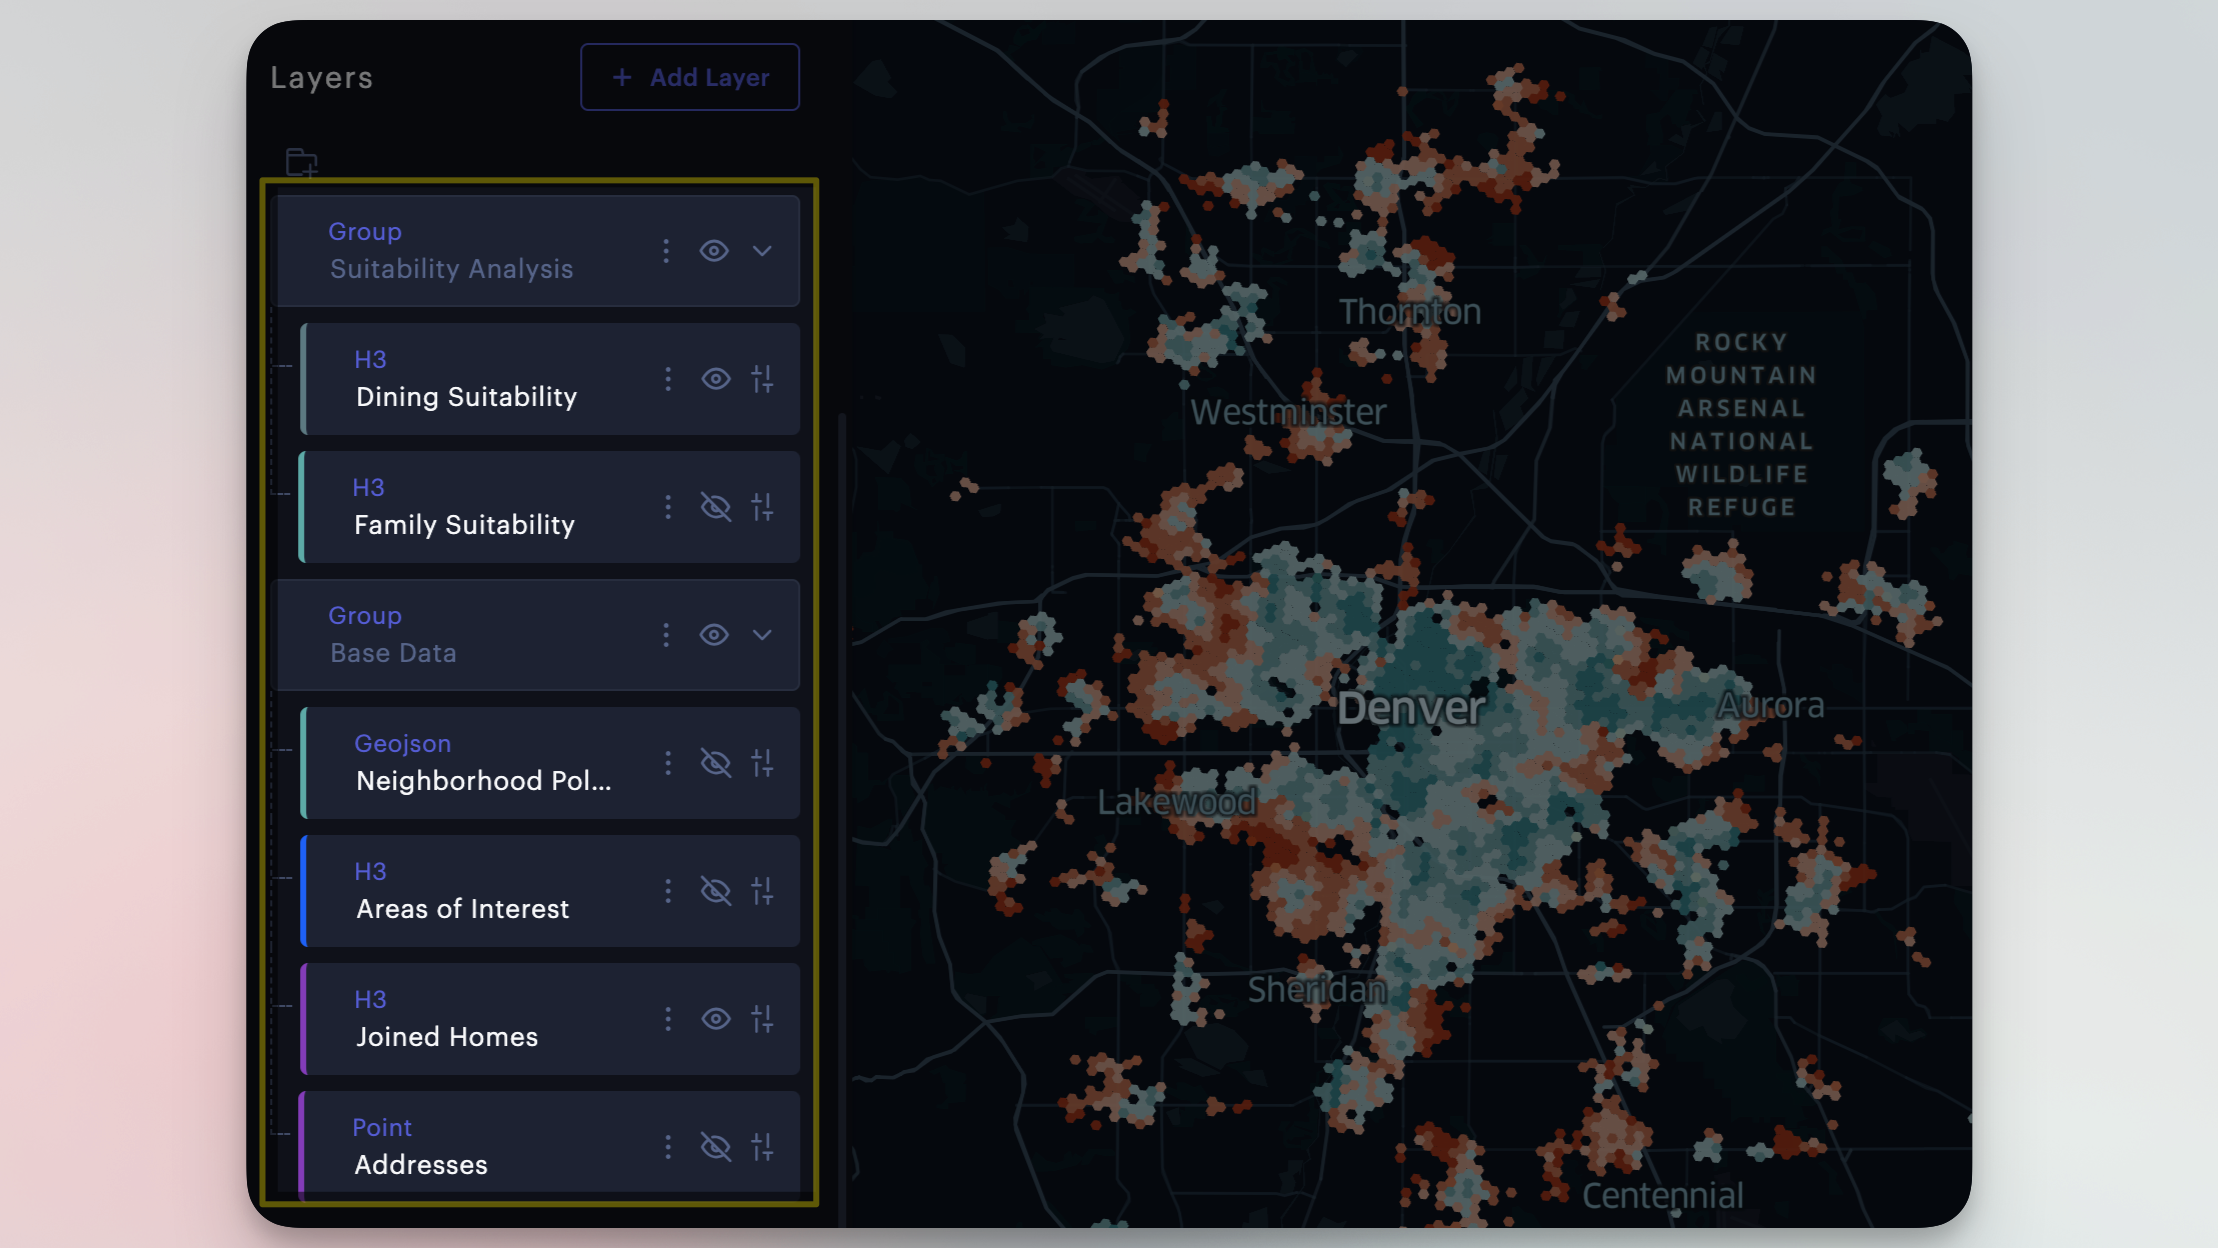
Layer group in Studio, highlighted.
Projects: Asset Info Panel
When selecting datasets or maps within a Project, metadata is now displayed in an information box.
Version 1.65
Released June 27th, 2023
Charts: Config Editor
The configuration editor has now been extended to charts. Programmatically control your charts in our full-featured code editor, or copy the configuration and paste it in other maps.
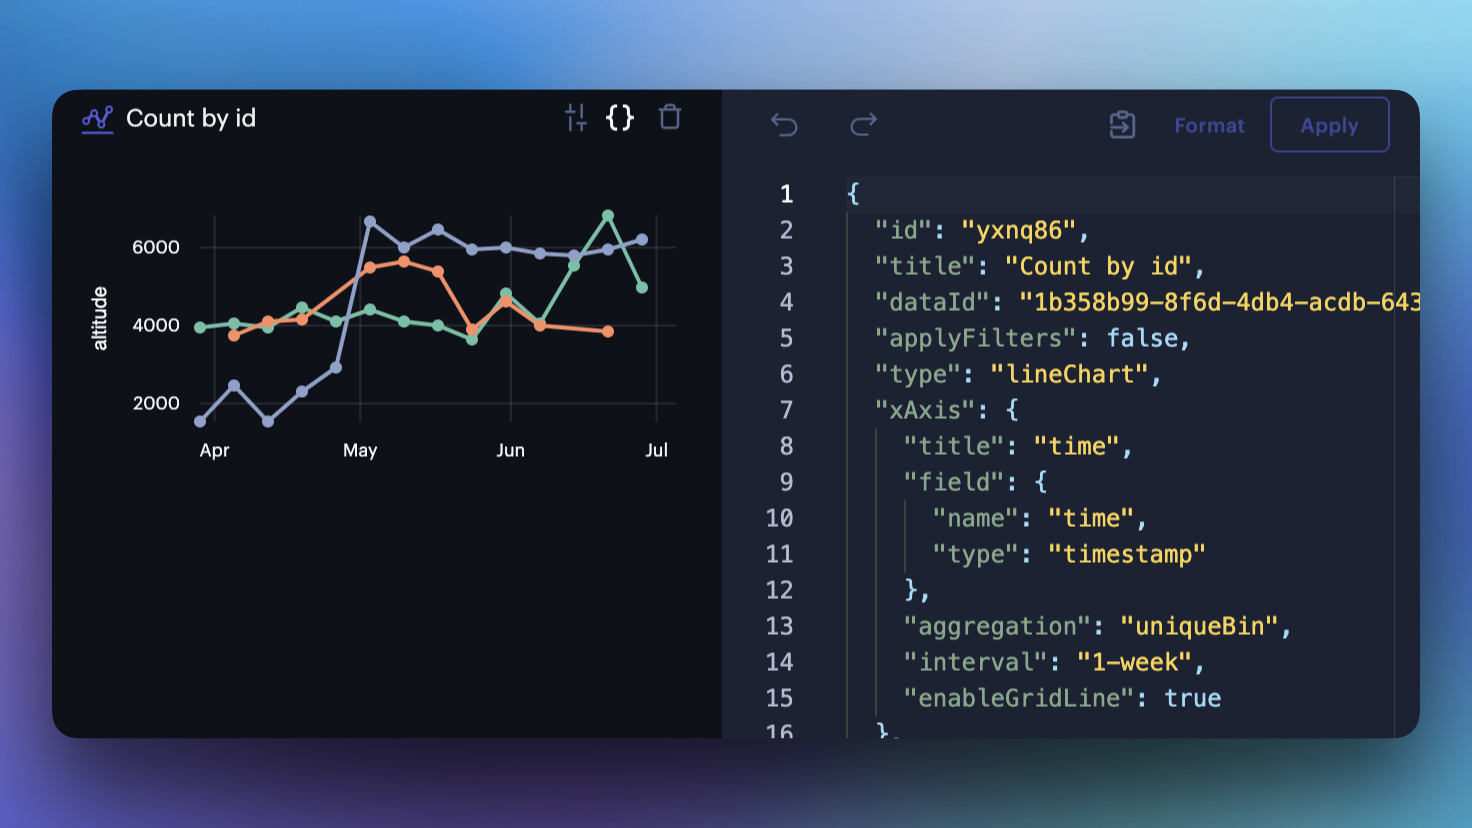
Chart config editor.
Raster Tiles: Toggle 3D Terrain
Users now have the option to toggle 3D terrain within the Raster Tile layer. Flatten raster data to better stack and blend other geospatial layers.
Data API Explorer
Studio's Data APIs let you upload and manage geospatial assets on the Studio Cloud. The new Data API explorer lets users test our APIs from the web browser. Get real responses by providing your access token.
Version 1.64
Includes maintenance version 1.63
Released June 14th, 2023
Vector Tiles: Dynamic Color
Enable Dynamic Color in the Vector Layer to estimate a color range and scale based on data visible in the viewport. Vector tiles also support a quantile color scale.
Query Parameters: Quick Edit
Users may now edit query parameters directly from the sidebar. Create new dropdown entries without jumping between menus.
Version 1.62
Released May 16th, 2023
Heatmap Chart
Use the new Heatmap Chart to observe patterns, dependencies, and associations between different geographic variables or attributes in a dataset. Offering complete customization of the correlation matrix, the Heatmap Chart highlights values atop a vibrant color palette.
Version 1.61
Released May 4th, 2023
Labels: Text Outline
Label text can now be outlined with a custom stroke width, stroke color, and background color. Labels are available for configuration in the Point, Polygon, Trip, Icon, and H3 Layer.
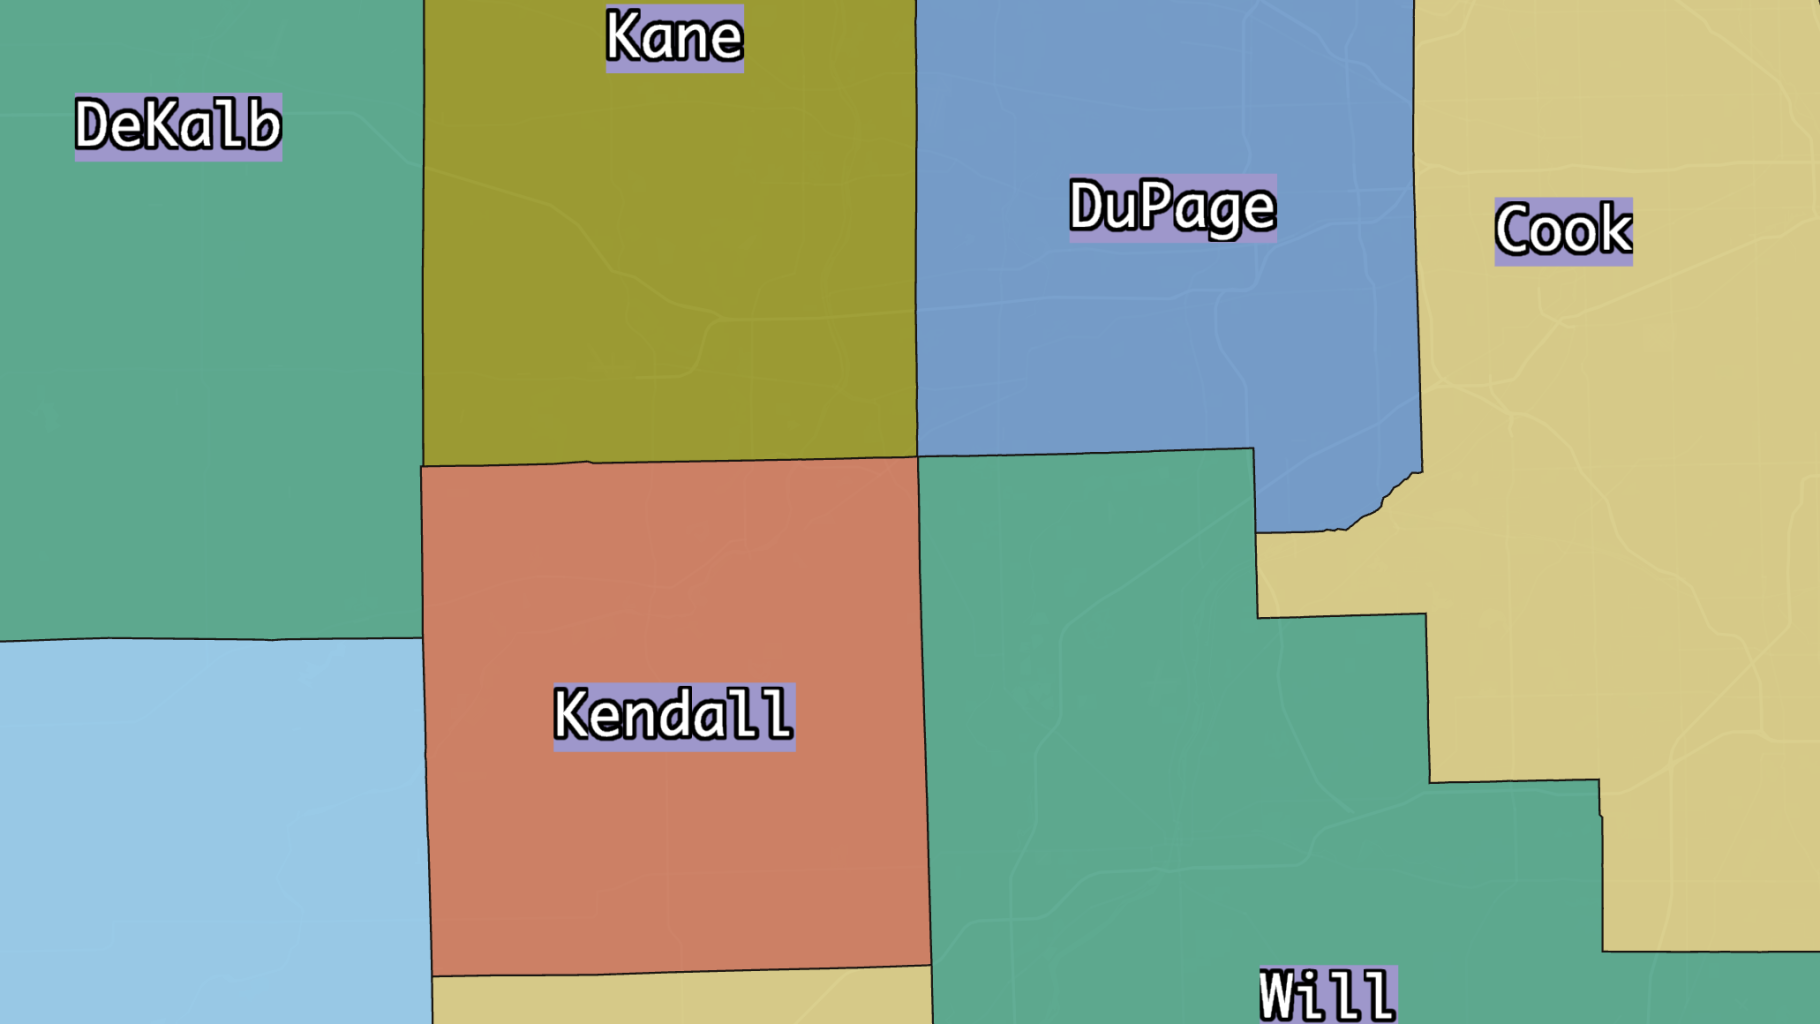
Labeled counties with outlined text.
Viewport Configuration Editor
The viewport may now be accessed and modified via Studio's config editor. With full control of the viewport configuration, you may now set an exact zoom level, latitude/longitude, and many other settings.
Map SDK: Allow Data Export
Toggle the ability to export data from the Map SDK via the mapConfig.exportEnabled flag. Users can export any dataset from the map in either CSV or GeoJSON format.
Data SDK: Data Connector Functionality
The Data SDK now offers support for Data Connectors. List available data connectors, execute queries, and create datasets from queries via a new set of Data SDK endpoints.
Use Case: Working with Text
In Studio, labels can be used to provide context and insight into the columns of the underlying dataset. You can also add custom callouts to your map with annotations, modify the map's legend, and much more. Learn more in our new guide highlighting text in Studio.
Version 1.60
Released April 18th, 2023
Layer Config Editor
Modify layers programmatically via Studio's new feature-rich config editor. Offering syntax suggestions, multi-line editing, and a number of other options found in modern code editors, Studio's human-readable layers configurations are now more accessible than ever.
Custom Color Scale for Categorical Values
Map categorical and ordinal values to any color on both layers and charts. With any color on the spectrum available, you may now visually communicate categories far more effectively.
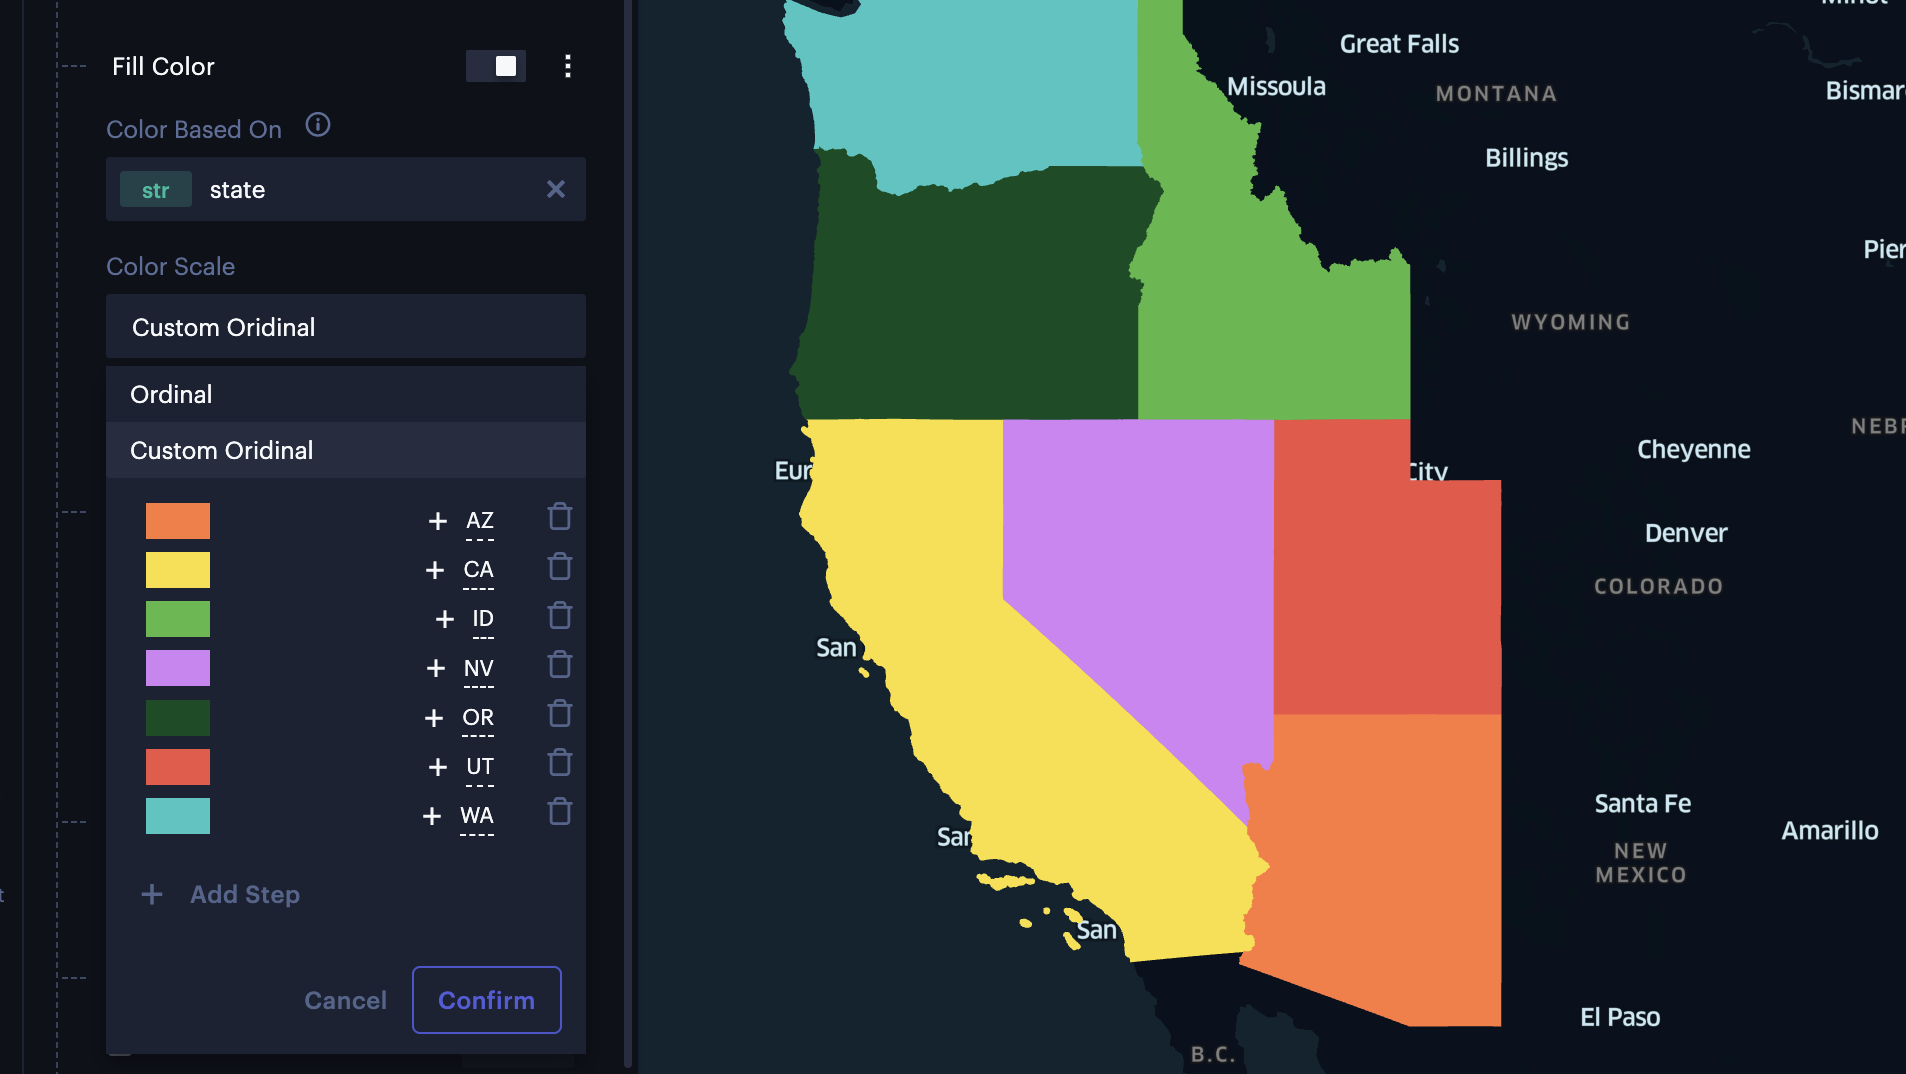
Custom color scale for US States.
Replace Dataset Validation
Studio now validates new datasets during the Replace Dataset operation. When replacing a dataset, Studio now offers insight into which layers may be disabled or broken due to missing or mismatched columns.
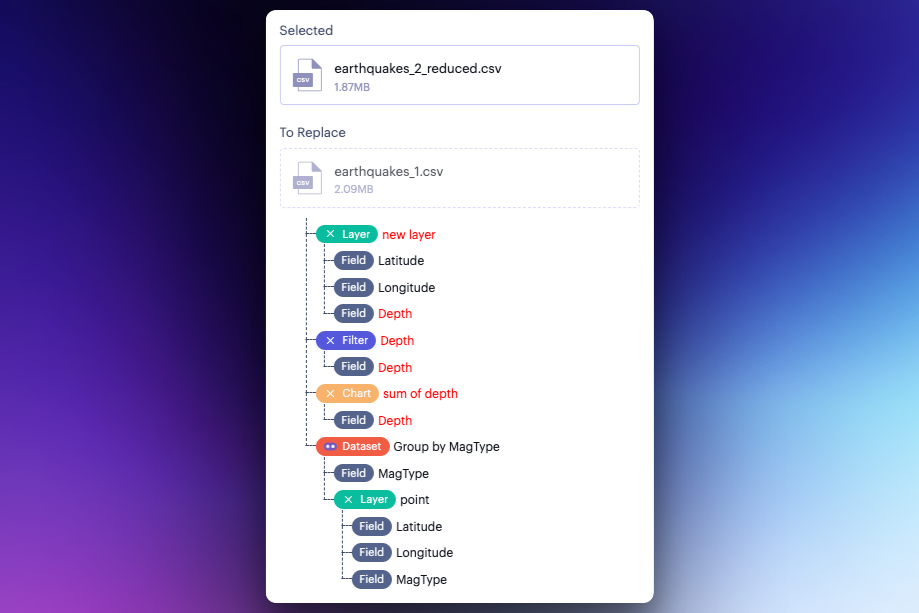
Warnings now appear when replacing a dataset.
Map SDK: Replace Dataset Validation
When calling replaceDataset via Studio's Map SDK, the new dataset is now checked for any missing or non-matching columns.
Map SDK: Raster Categorical Color Scale
Users may now specify a custom color scale for raster imagery by mapping available image pixel values to a color hex codes.
Version 1.59
Released April 7th, 2023
Includes minor changes from version 1.58
WMS Service Support
Studio now offers support for WMS services, rendering map imagery as a visual layer. Instead of downloading a map for the entire globe, an image is rendered covering the current viewport.
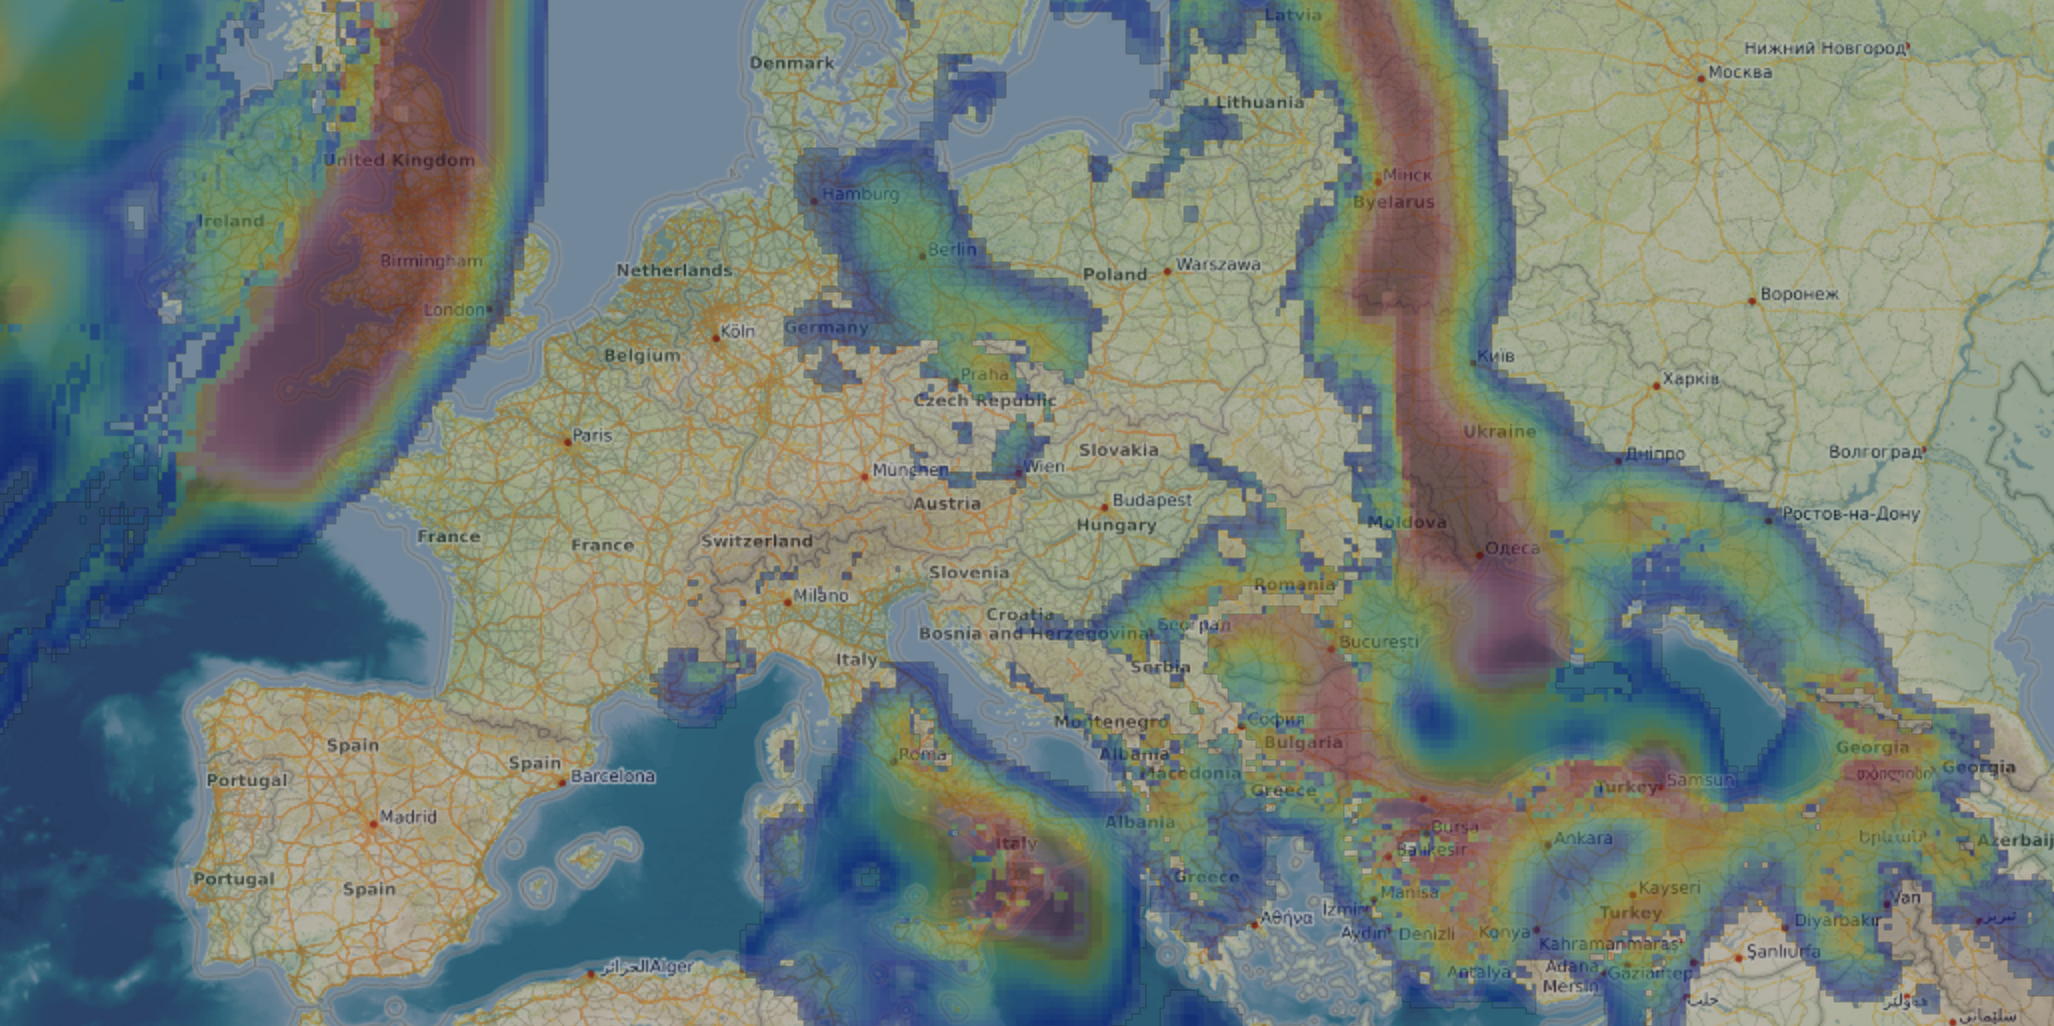
Rain probability layer over an OpenStreetMap and topographic layer.
Data Connectors: Dynamic Viewport Query
Insert the {{viewport}} query parameter to retrieve filtered data that falls within the current viewport. Moving the viewport dynamically updates the query, pulling new data for the current view.
Data SDK: Replace Dataset Compatibility Check
When calling Replace Dataset from the Data SDK, the new dataset will now be checked to make sure it has all the fields that are being used by the old dataset. This will help prevent layers, filters, charts, and other elements from failing to render if dataset schemas don't match up.
Version 1.57
Released March 22nd, 2023
Introducing Projects
Projects are spaces for teams to organize maps and datasets. Offering folder support, Projects allow you to structure your assets in a way that makes sense to your team.
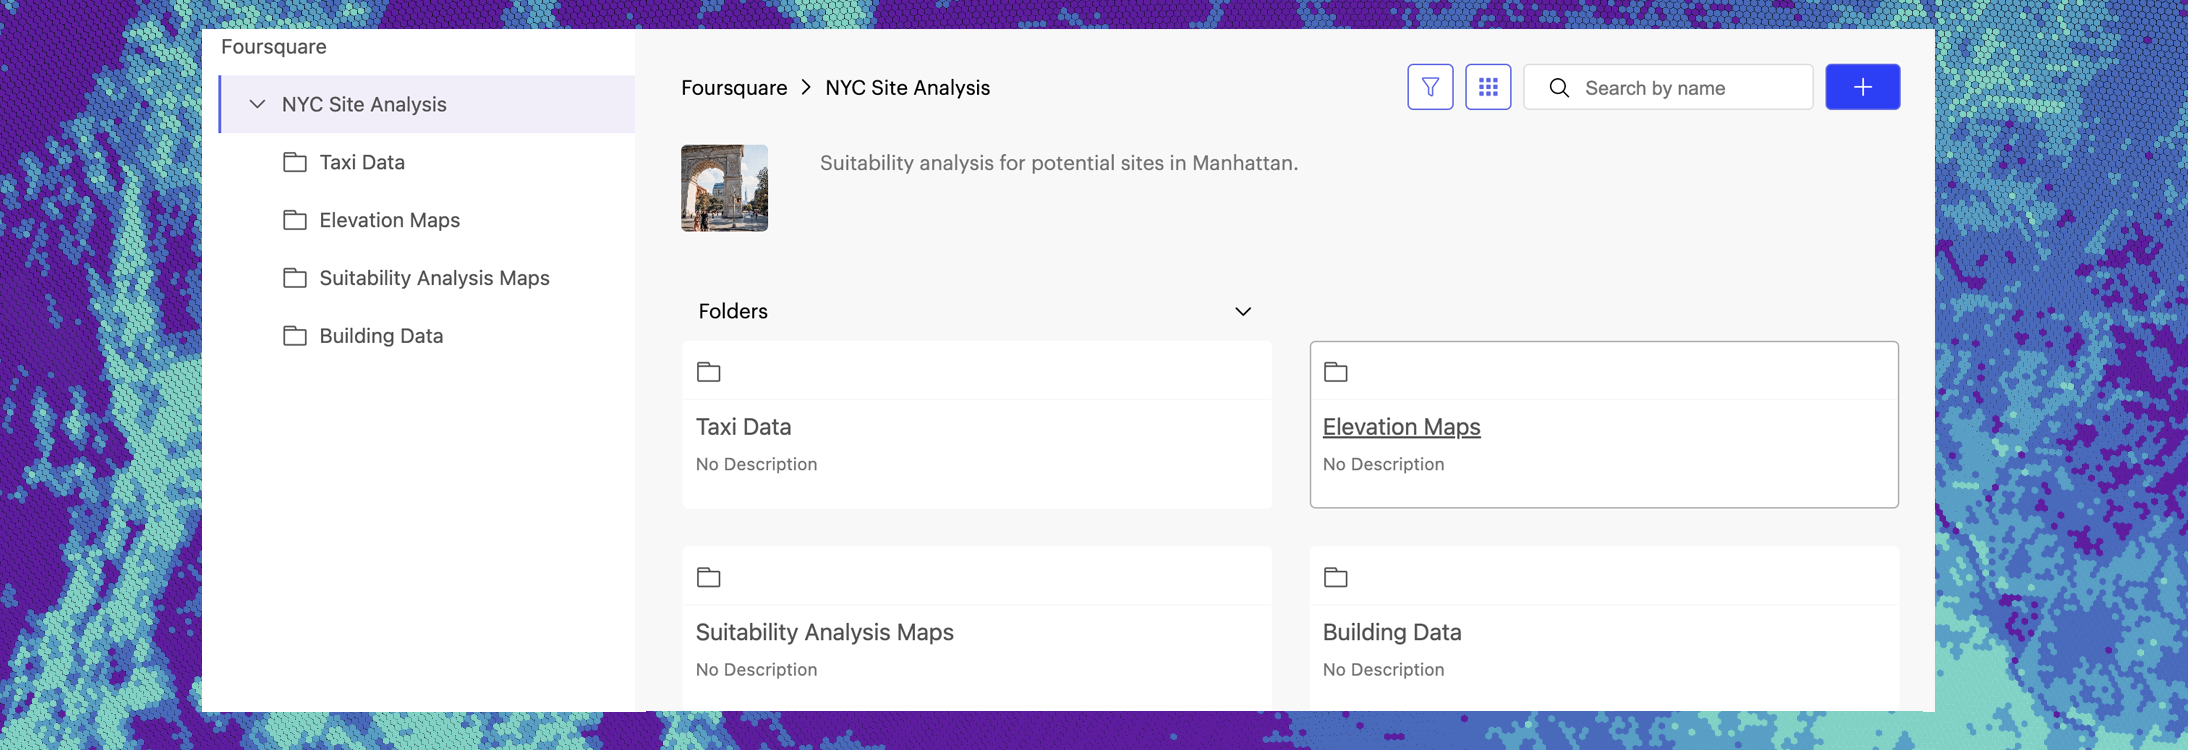
A project example showing four folders.
Raster Layer: Single Band Support
The Raster Layer now offers single band support. With single band image selection enabled, users may choose to view any individual raster band available in a STAC collection.
Hex Tiles: Dynamic Color Scale
The new Dynamic Color Scale option for Hex Tiles updates the color scale domain based on the area visible in the viewport.
Data Connectors: Multi-Selection Query Dropdown
Data connectors now support multi-selection via the query parameter dropdown feature.
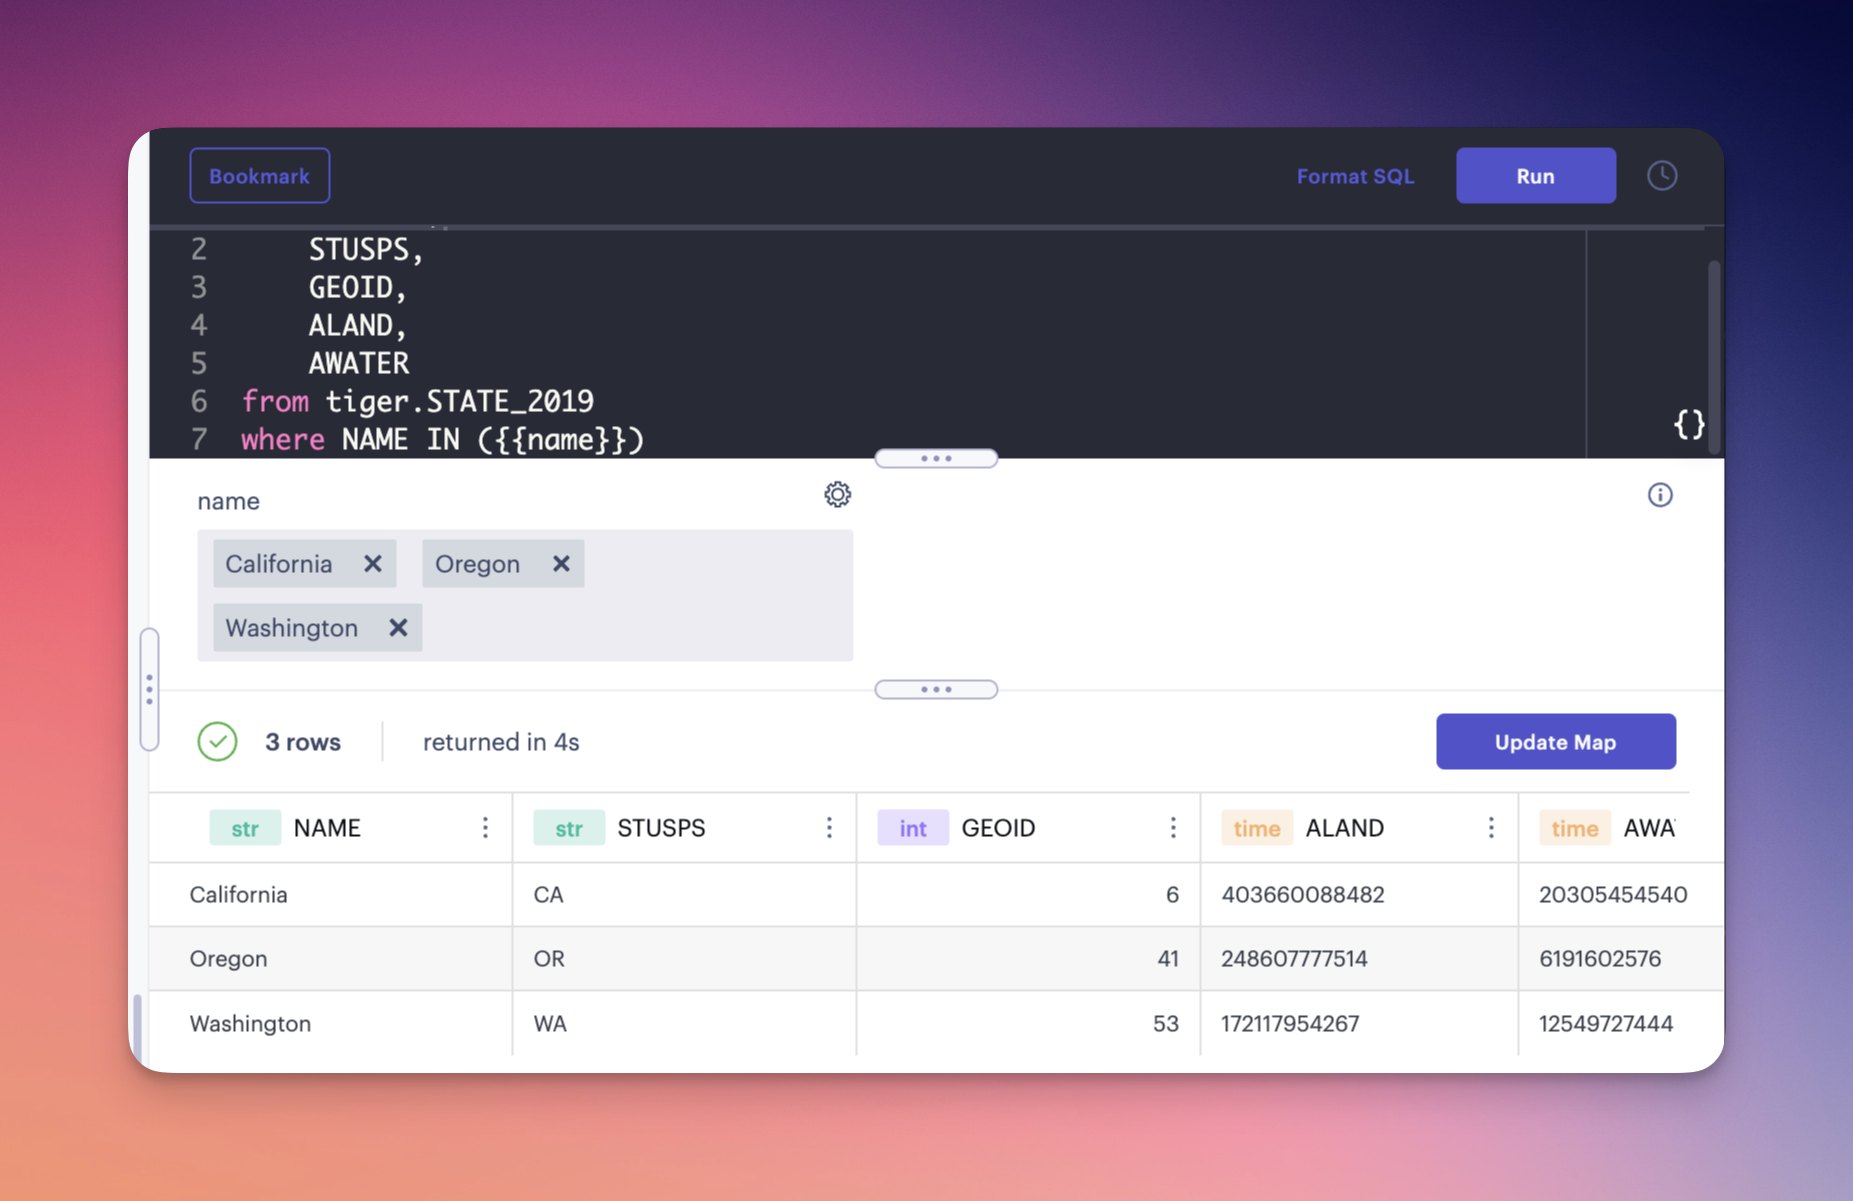
Querying data from several US states via multi-select.
Version 1.56
Released February 22nd, 2023
Chart Improvements
A host of chart enhancements has landed to Studio. Users may now add custom labels to the Y axis, toggle grid lines, and apply padding between bars and groups.
Annotation Improvements
Editing annotations is now easier with a number of bug fixes and quality-of-life changes. All annotations on a map can now be toggled on or off from the Interactions tab, and the rich text editor now supports vertical alignment.
Version 1.55
Released February 9th, 2023
Charts: Hex Tile Support
Charts can now display data from Hex Tiles within the viewport. Summarize massive datasets using bar, line, and big number charts.
Charts: Benchmark
You may now designate a group from a column to serve as a benchmark for line and bar charts. Use benchmarks to evaluate how a business stacks up to competitors, if a franchise is meeting its goals, and much more.
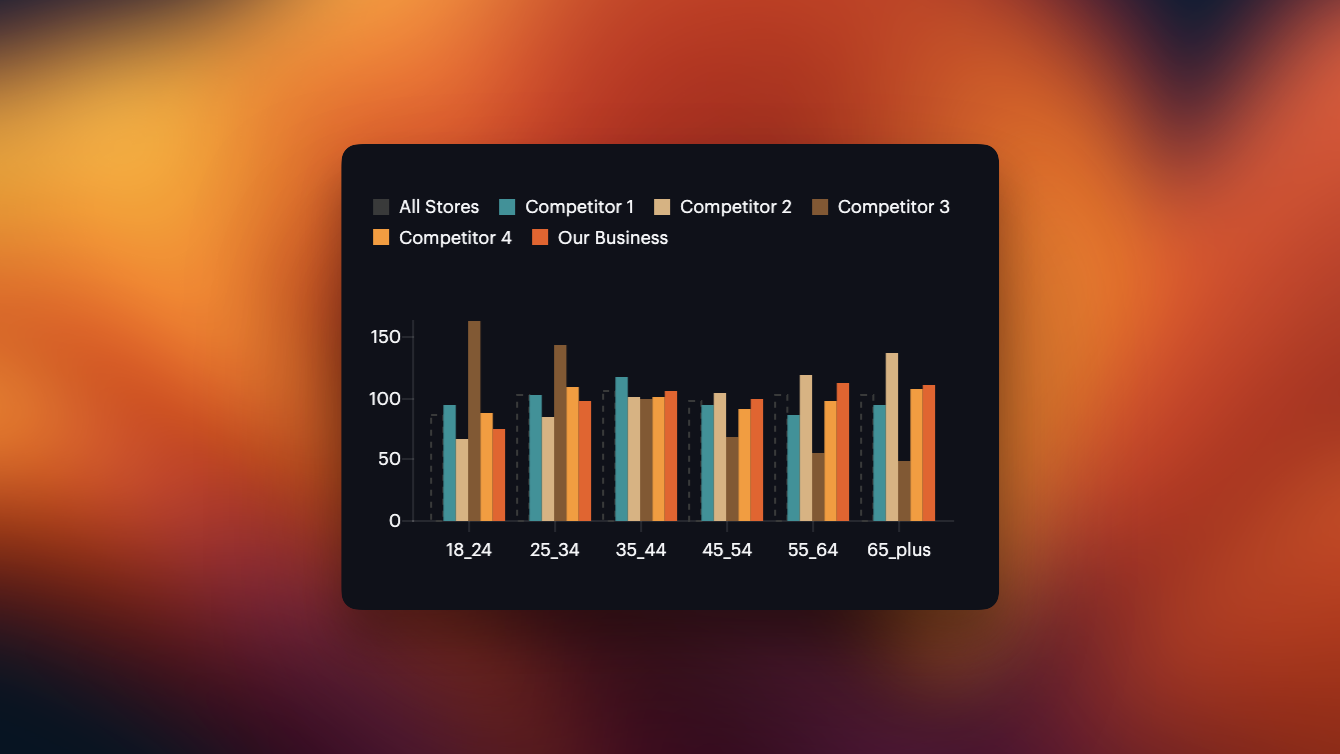
Comparing average sales across age groups against an "All Stores" benchmark.
Version 1.54
Released January 25th, 2023
(Contains features from 1.53)
Annotations
Studio's new Annotation feature lets you place text and callouts on the map. Equipped with a rich text editor, annotations are highly customizable, supporting fonts, colors, hyperlinks, and more.
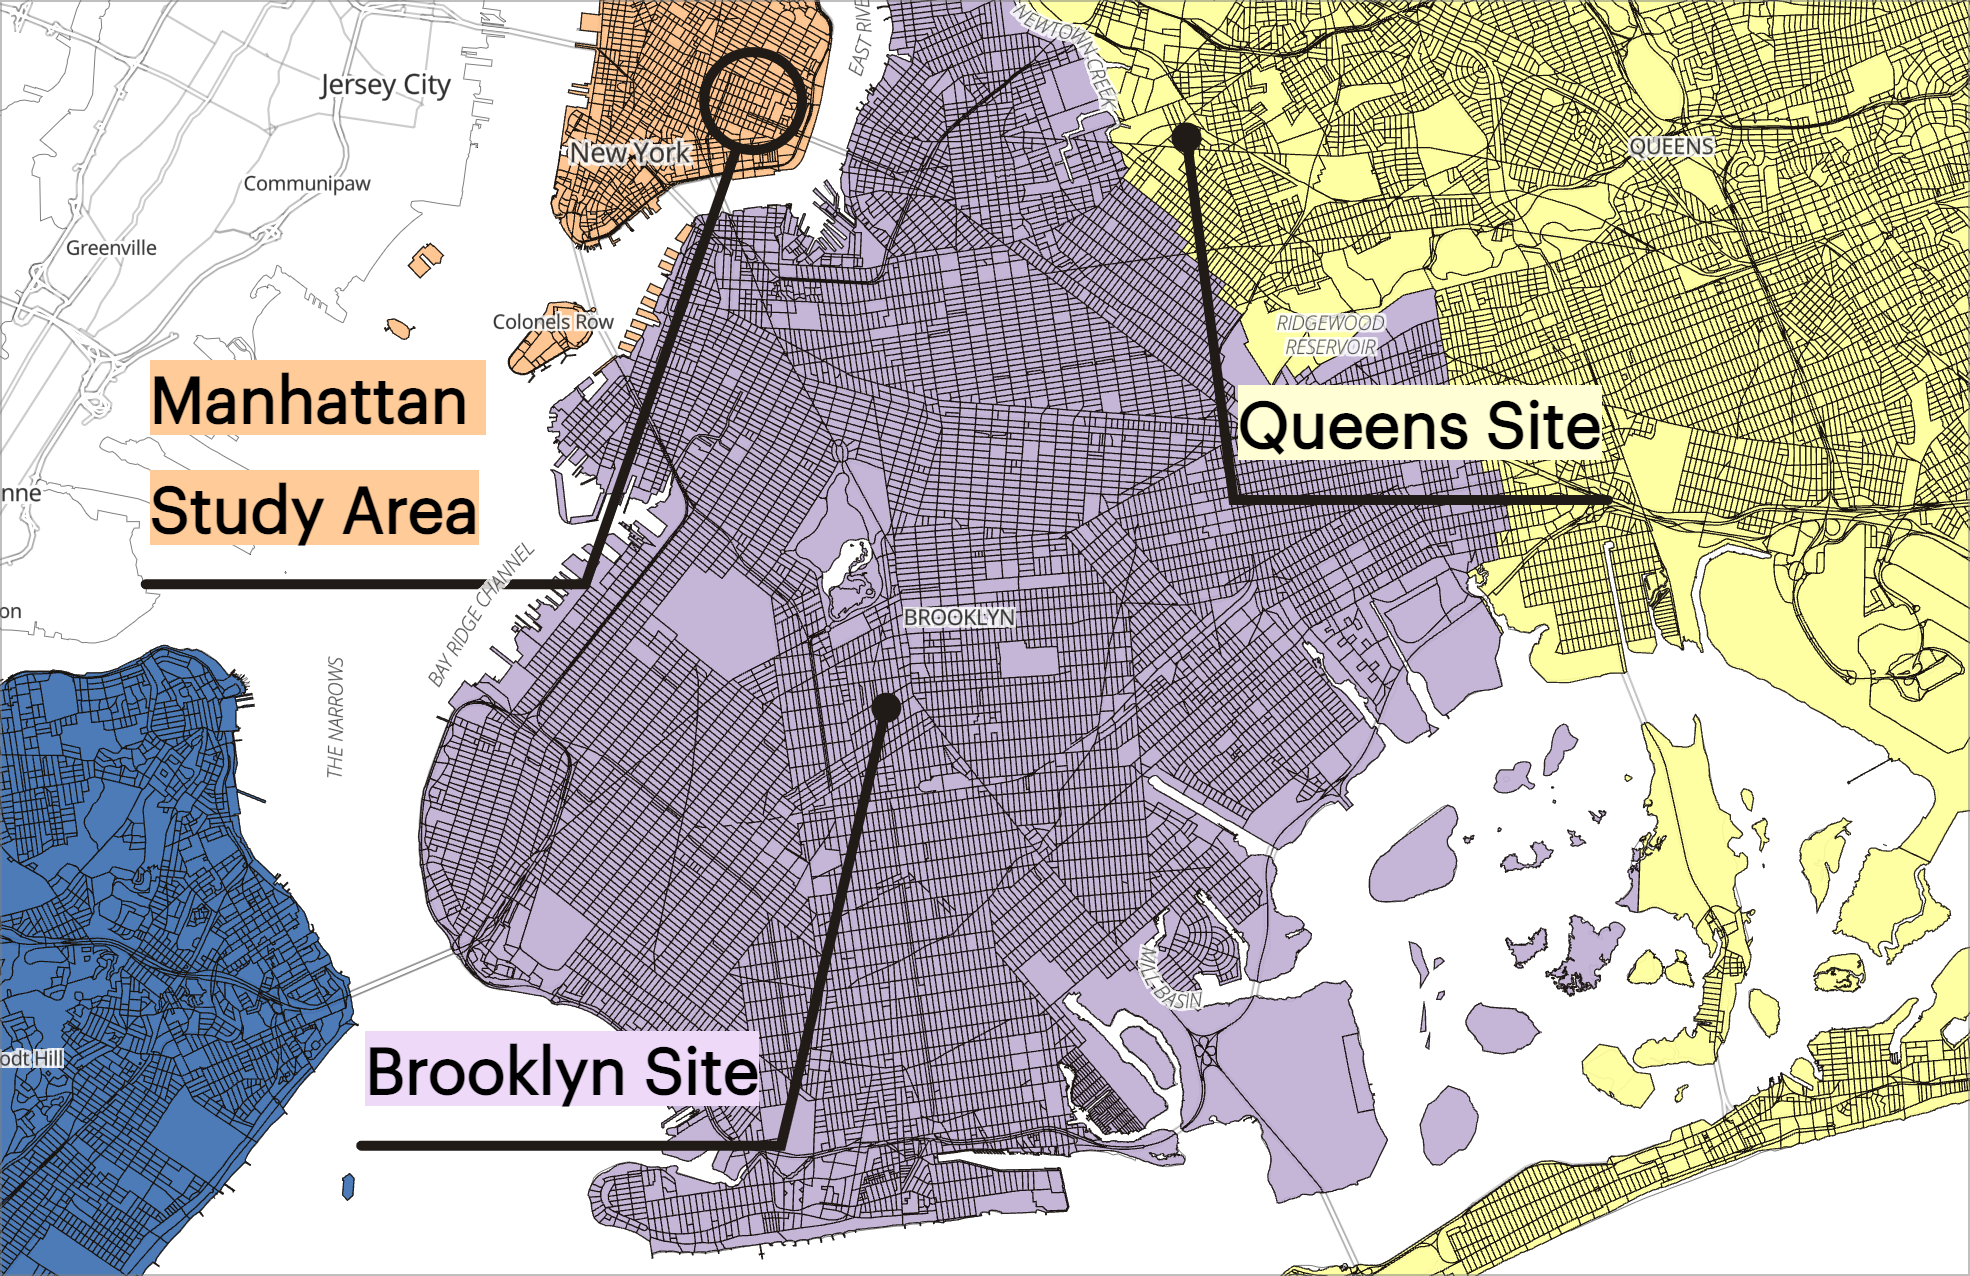
Annotations pointing to locations in New York City.
Save and Share Base Maps
Add base maps to your workspace for future reuse. Saved base maps can also be shared with all members of your organization, allowing any member of your team to use a custom base map.
Expressions: New Aggregation Functions
Aggregate data from columns using a new suite of aggregation expressions, including sum, count, quantile, and more. Big number charts support these expressions, letting you compute and display aggregated metrics in a matter of seconds.
Data Connectors: Test Connection
Before adding a data connector, the new Test Connection feature communicates with your database to verify your connection prior to adding the connector. If your connection fails or is rejected, an error message will be relayed from your data provider.
New Asset Tile Cards
Assets are now represented with new compact, responsive title cards. This is only a sneak peek of our upcoming dashboard improvement that further enables team collaboration on Foursquare Studio.
Version 1.52
Released December 14th, 2022
Dashboard Improvement: Workspace
Your maps, datasets, queries, and data connectors can now be found in the Workspace tab. Spend less time searching for assets with this new easy-to-navigate interface.
New Expression Editor
Our expression editor has been redesigned to expedite column creation. Find our library of built-in functions on the left panel, then view function definitions and expected parameters in the editor window.
Version 1.51
Released November 23rd, 2022
H3 Layer Improvements
The H3 layer now supports text labels, stroke outline customization, and fill transparency.
Transparent H3 cells with custom outlines and labels.
Flow Layer: H3 Support
You may now use H3 indexes as source/target locations in the Flow Layer.
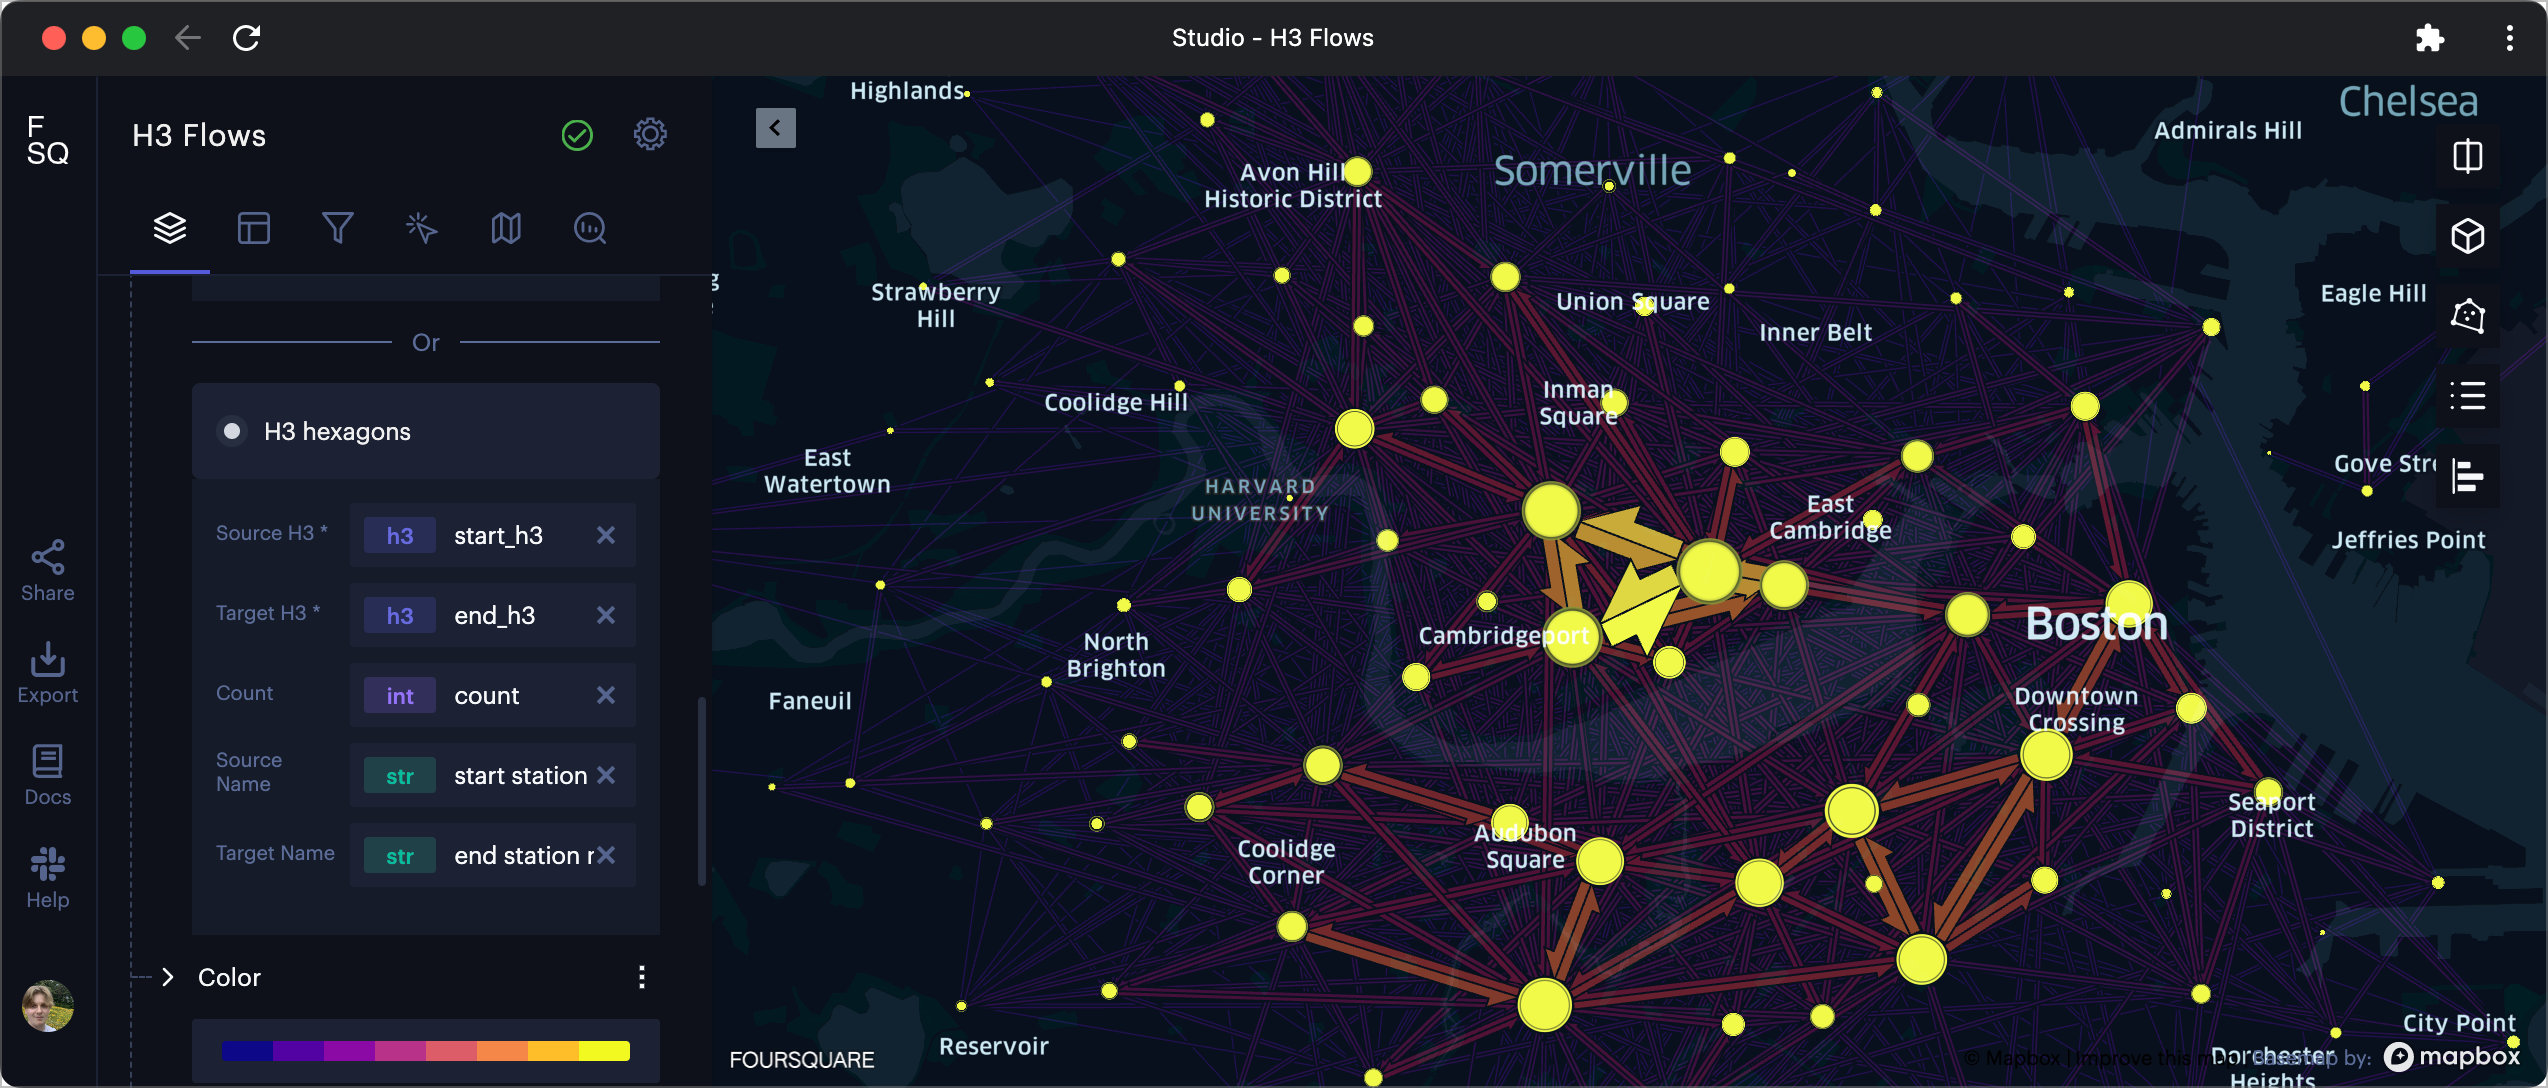
A Flow Layer using H3 indexes.
Guide: Geospatial Data Operations
Visit our new guide to learn about geospatial data operations available in Studio. Follow along with the examples to see how common use cases are met completely within a Studio map project.
Map Month: Last Week for Submissions!
There's only 1 week left to enter our 2022 Map Month Competition! Don't forget to submit your best #30daymapchallenge creations using Foursquare Studio for the chance to win one of three $500 prizes 🏆!

Version 1.50
Released November 16th, 2022
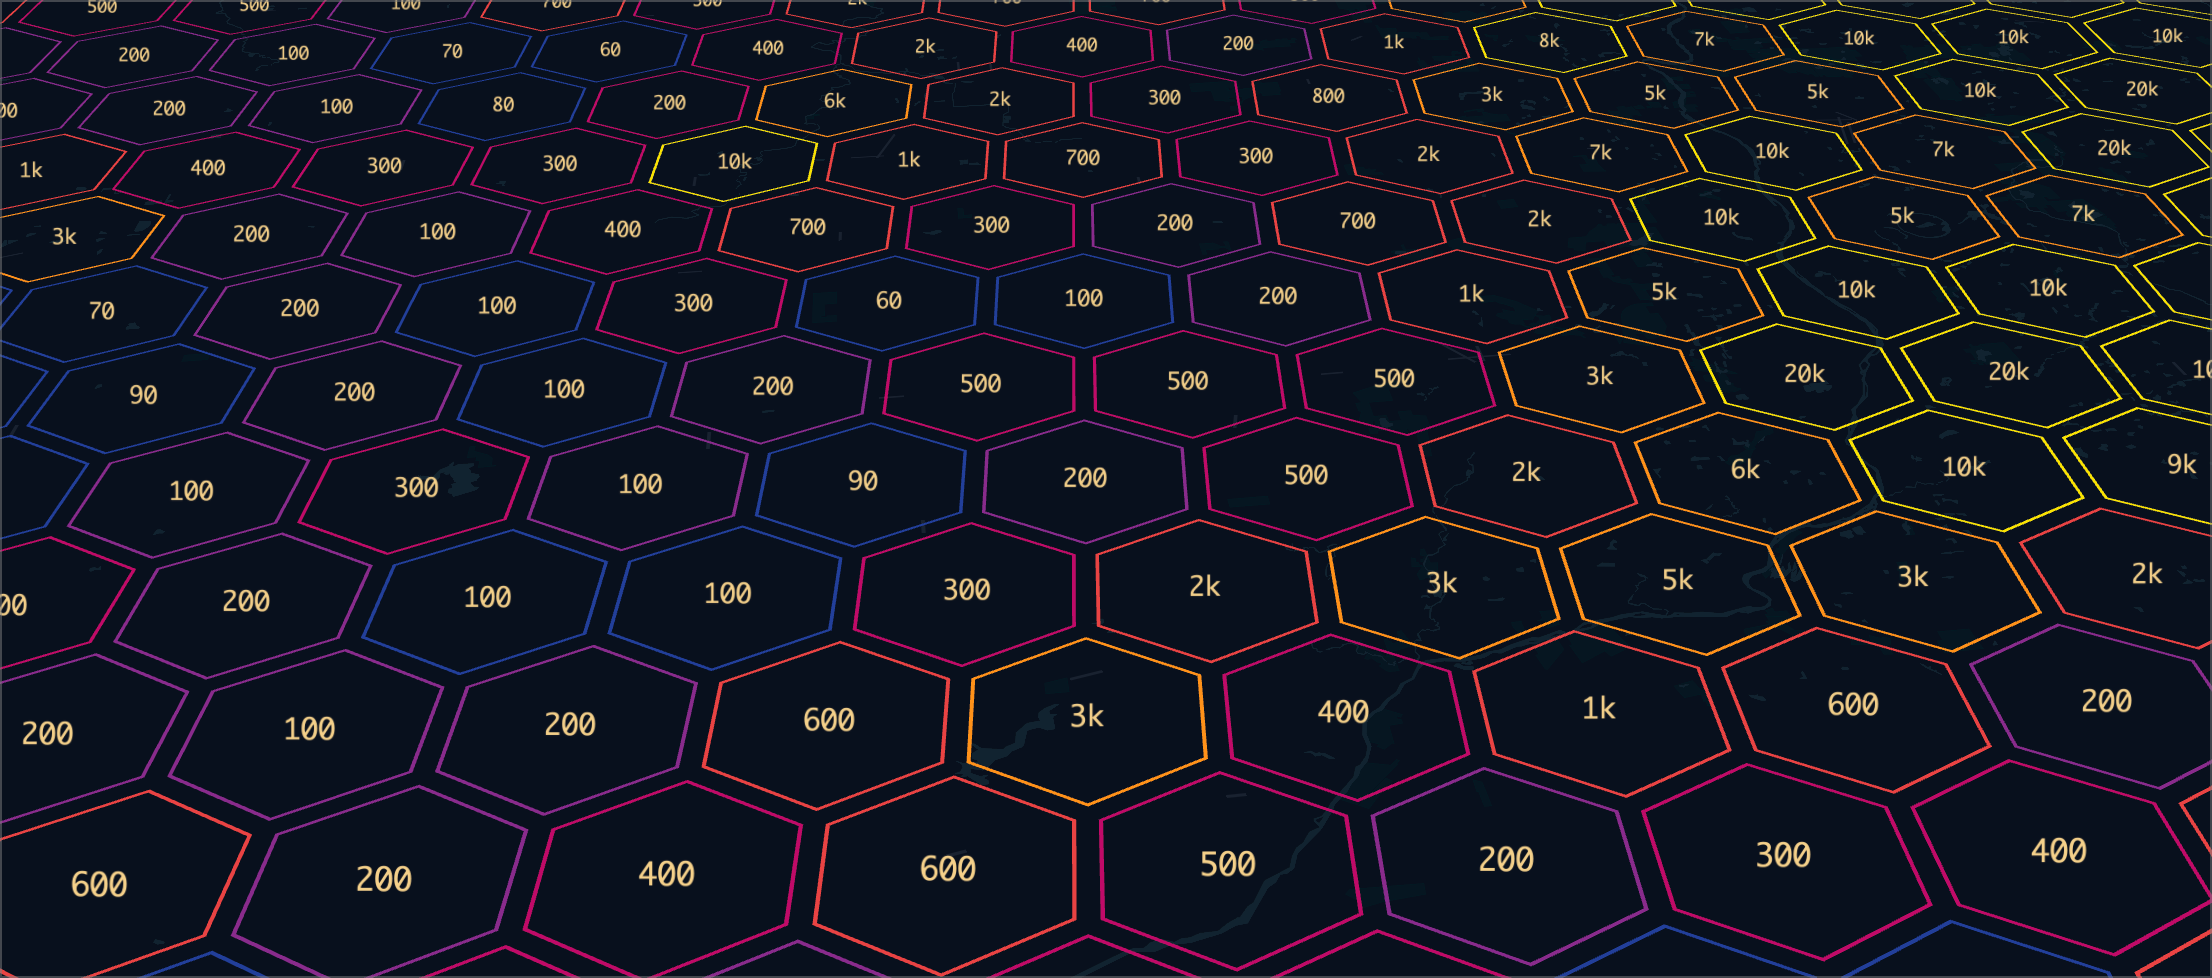
Hex Tiles: Custom Color Scale
Users may now apply a custom color scale in the Hex Tile layer. Create a custom color scale to highlight areas that are above or below a certain value, or select the exact colors to represent your data.
Query Parameters: Dynamic Dropdown
Use the new dynamic dropdown feature to select a specific column to use as a source for unique values. This option streamlines populating a dropdown list for a query parameter.
Time Series: Group By
Temporal data can now be grouped and displayed as multiple lines on the histogram, providing your audience with a categorical comparison alongside an animated visualization.
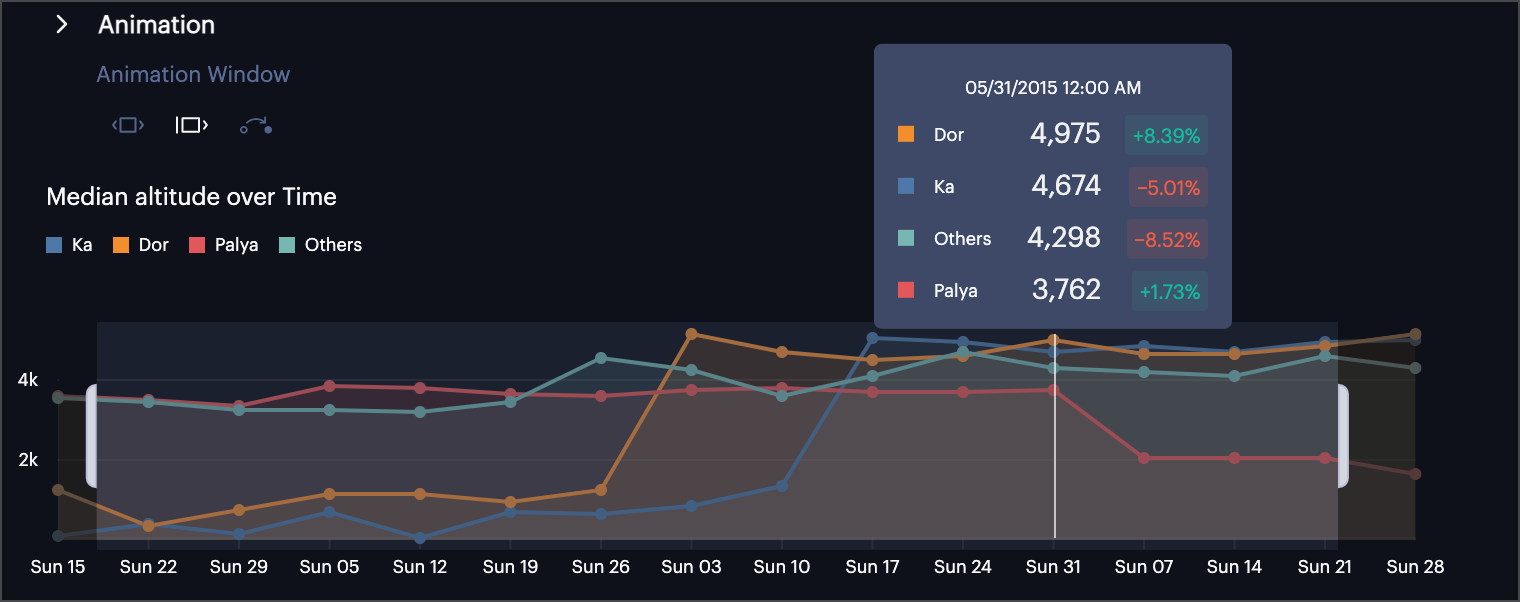
Comparing median maximum altitude for a temporal dataset.
Data Connectors: Redshift
You can connect the Studio platform to your Amazon Redshift cluster using the Redshift data connector. Read our guide to get started.

H3 Presto Bindings
Presto bindings are now available for the H3 Core Library via the new H3-Presto plugin.
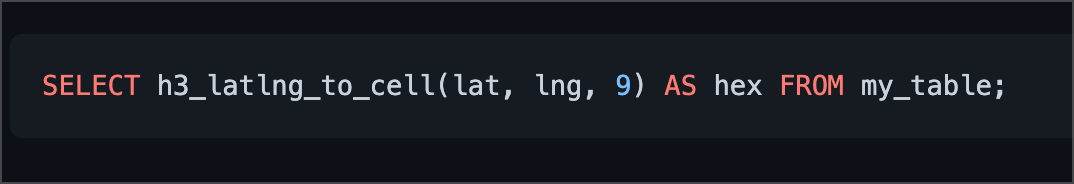
Calling an H3 function from SQL via the H3-Presto library.
Version 1.49
Released November 1st, 2022
Unfolded Studio is now Foursquare Studio
The move from Unfolded to Foursquare Studio is both a symbolic and practical investment in our product and its users. Continuing into 2023, expect to see more new integrations, powerful analytic features, and other exciting tools. Read last month's blog post and the accompanying FAQ.

New Documentation Hub
Our documentation has moved to https://location.foursquare.com/studio/docs. This transition creates a one-stop-shop for customers that use Studio along with other Foursquare offerings. As with Studio, we are eager to hear your feedback in our community Slack channel.
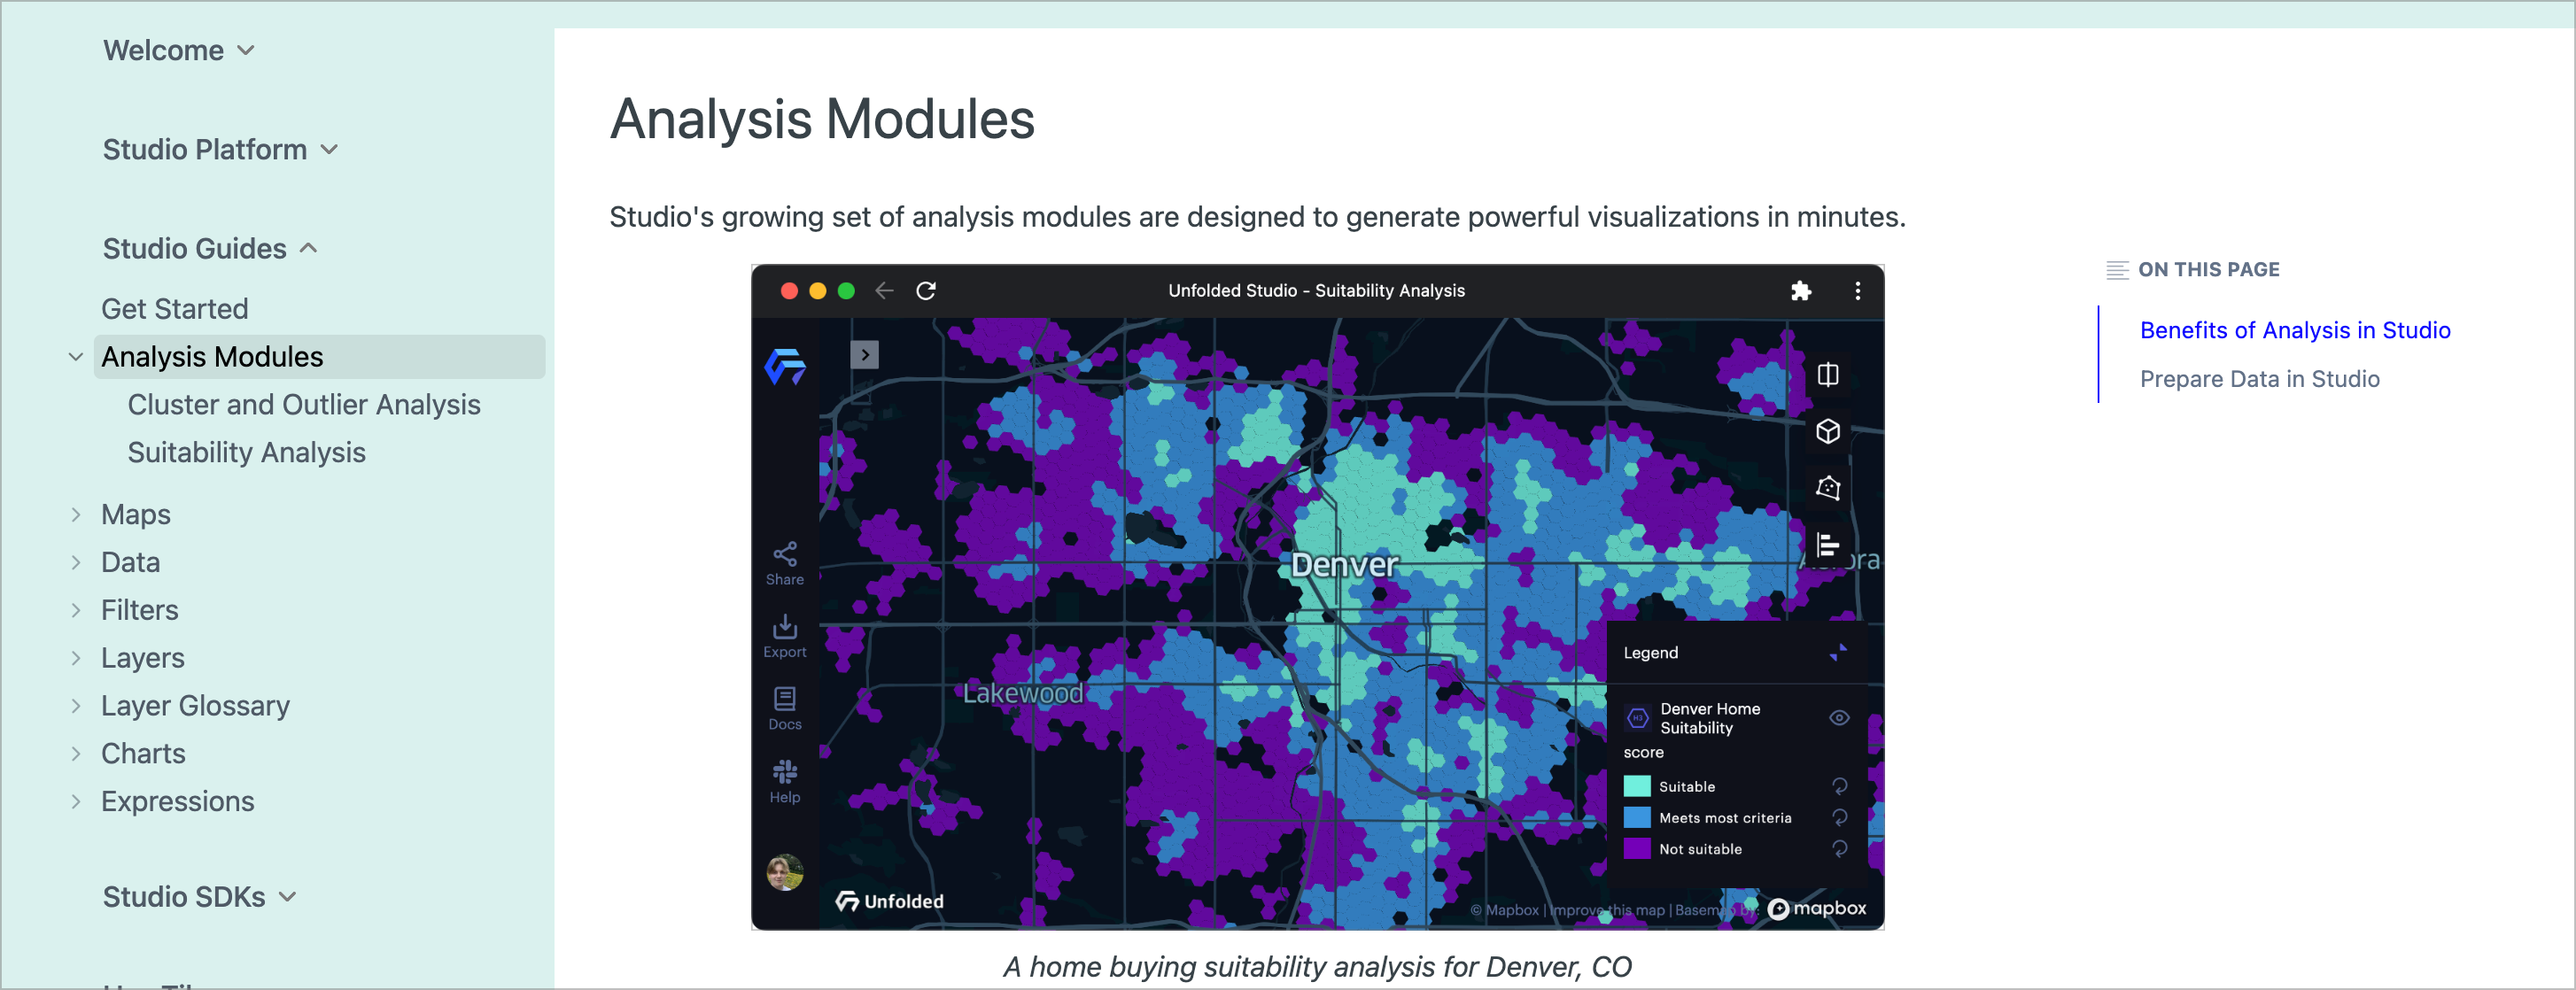
The new Studio documentation hub.
Version 1.48
Released Oct 12, 2022
Dropdown Query Templates
Bookmarked query templates now support dropdown lists. Specify a set of values to appear in the list, allowing for easy query re-execution from Studio's side panel.
Shared Datasets: Create Map
Users can now select any number of shared datasets, then click Create Map to initialize a new project with the selected datasets.
Shared Datasets: Copy to Account
Users may now copy shared datasets to their personal account. This allows users to privately tag and modify datasets without impacting other members of their organization.
Data SDK: Command Line Authentication
We have enabled easier Data SDK authentication via the command line, removing the need to manually copy tokens from our website.
Data SDK: Non-rotating Refresh Token
The Data SDK now supports non-rotating refresh tokens. This makes it easier to authenticate with the Data SDK from environments with read-only secrets like Databricks.
Version 1.47
Released Sep 26, 2022
Chart Improvements
This update brings a host of improvements across Studio's charts, aligning functionality across the platform.
- Horizontal layout
- Sorting options for values on the x-axis
- Sorting options for groups
- Coloring options: color by groups, x-axis, or apply no coloring
- Use filtered data toggle
- Format x-axis and y-axis values
- Support for integer values on the x-axis
- Sorting options for groups
- Coloring options: color by groups
- Format categorical breakdown values (supports only numerical values)
- Format y-axis values (supports only time series)
- Color options: y-axis, or apply no coloring
3D Layer Improvements
The 3D layer now allows users to select from a library of models or specify a custom model (which must be provided via URL). Additionally, models in the 3D layer now support full rotation and tilting via fields accepting roll, pitch, and yaw data.
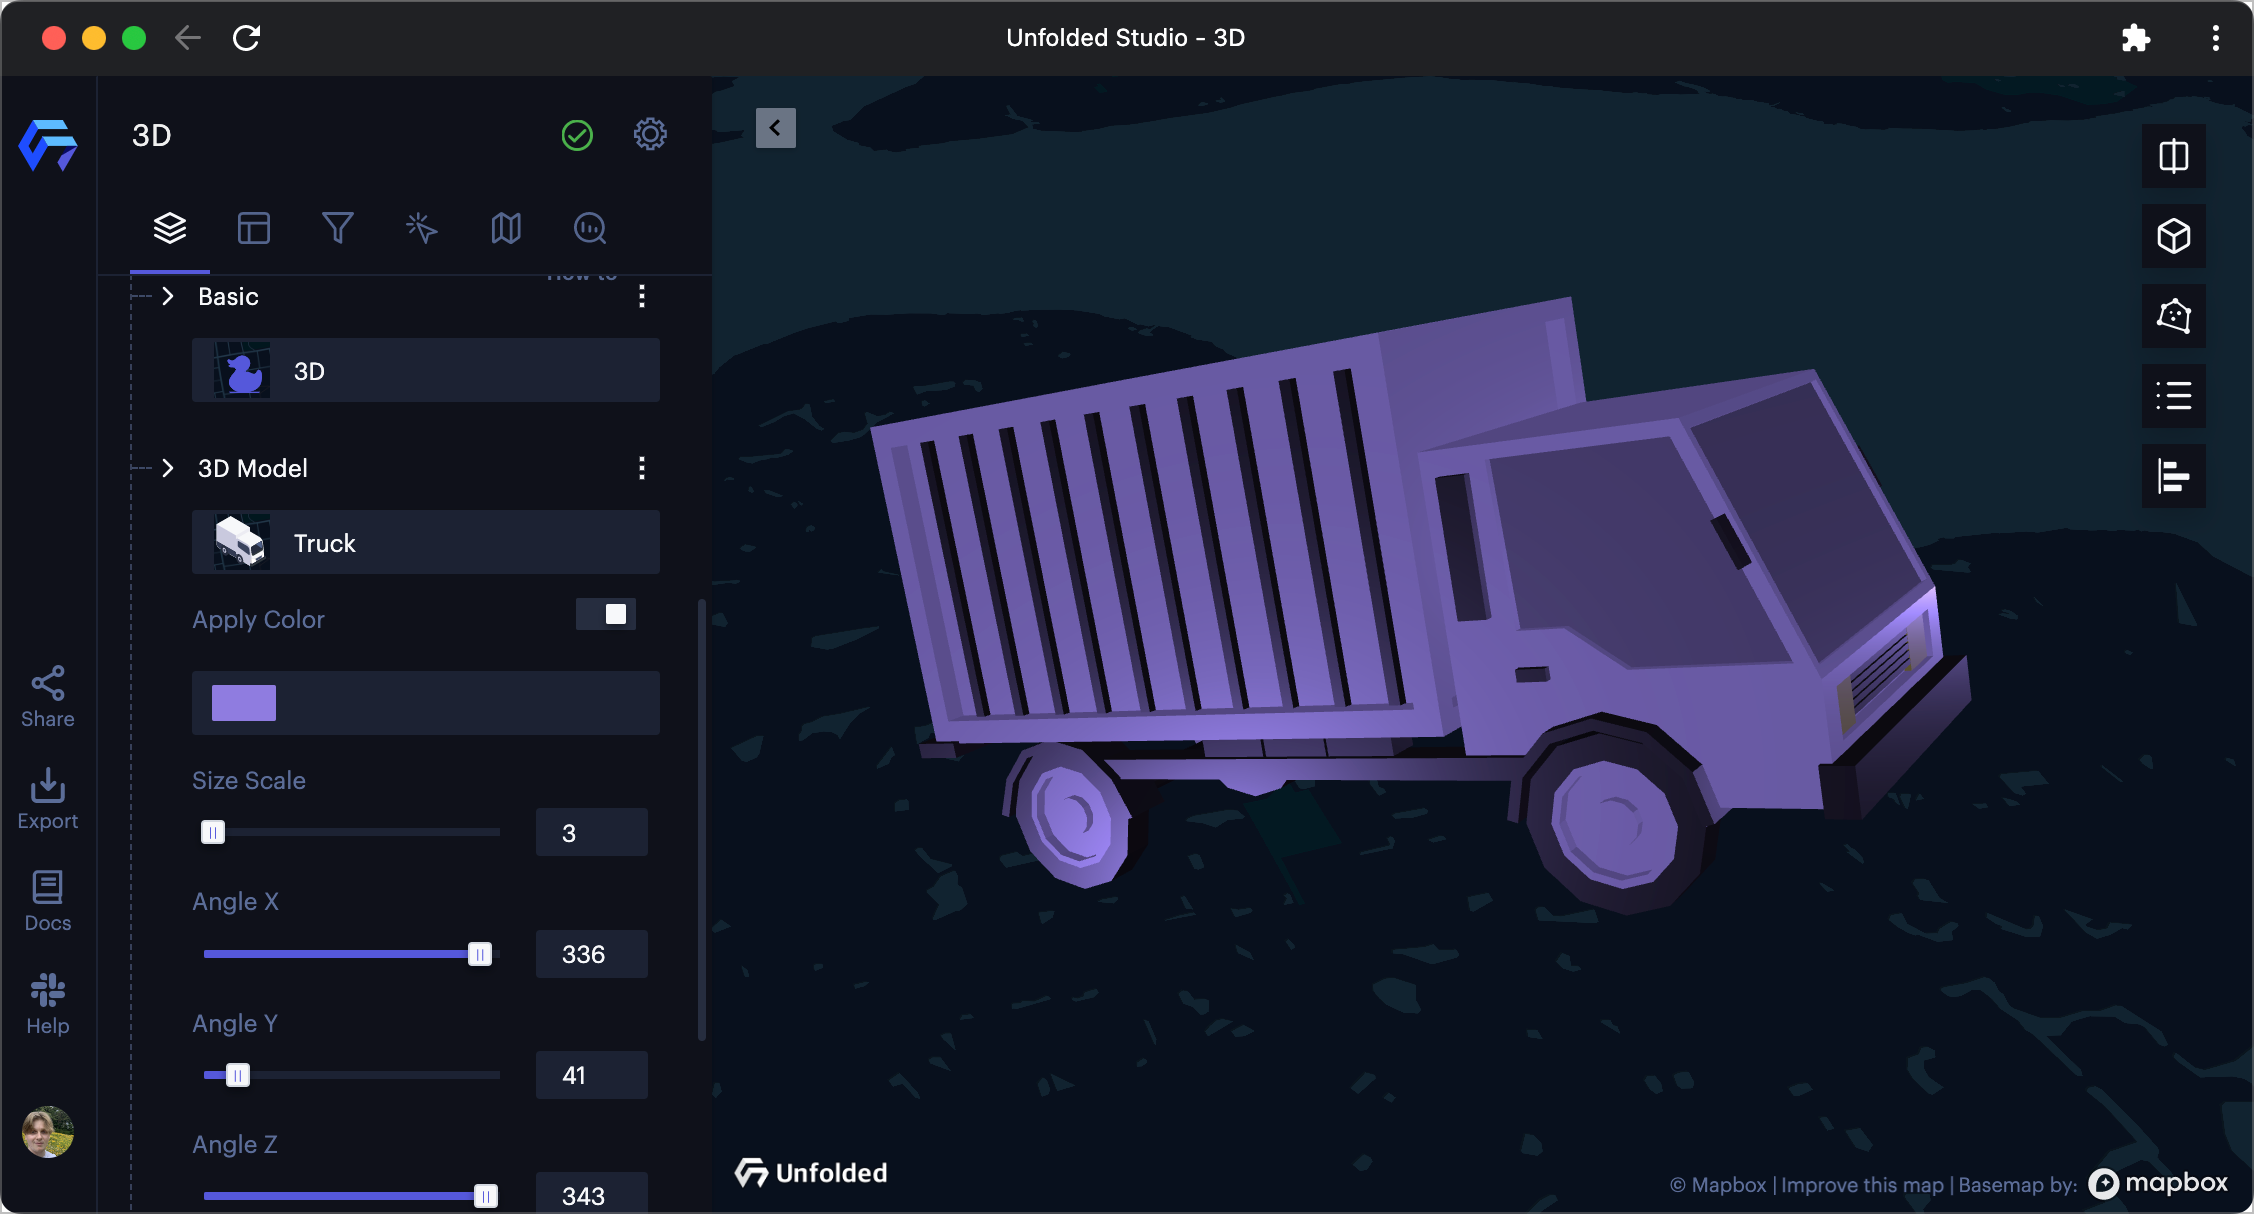
The new 3D layer configuration panel.
Raster Use Case Examples
Interested in exploring remote data in Foursquare Studio? Our new use case article breaks down the features of our Raster Layer This article includes examples showing the Raster Layer used in several use case examples, including agriculture and emergency management.
Version 1.46
Released Sep 15, 2022
Layer Groups
The long-awaited Layer Group feature has made its way to Studio. Create a new group, then drag and drop your project's layers into labeled folders. Users may also click the visibility toggle the display of all layers in the group.
Chart UI Improvement
Chart options have been organized into intuitive sections that collapse and expand, streamlining chart configuration. The chart panel is now larger, dedicating more screen space to the chart itself.
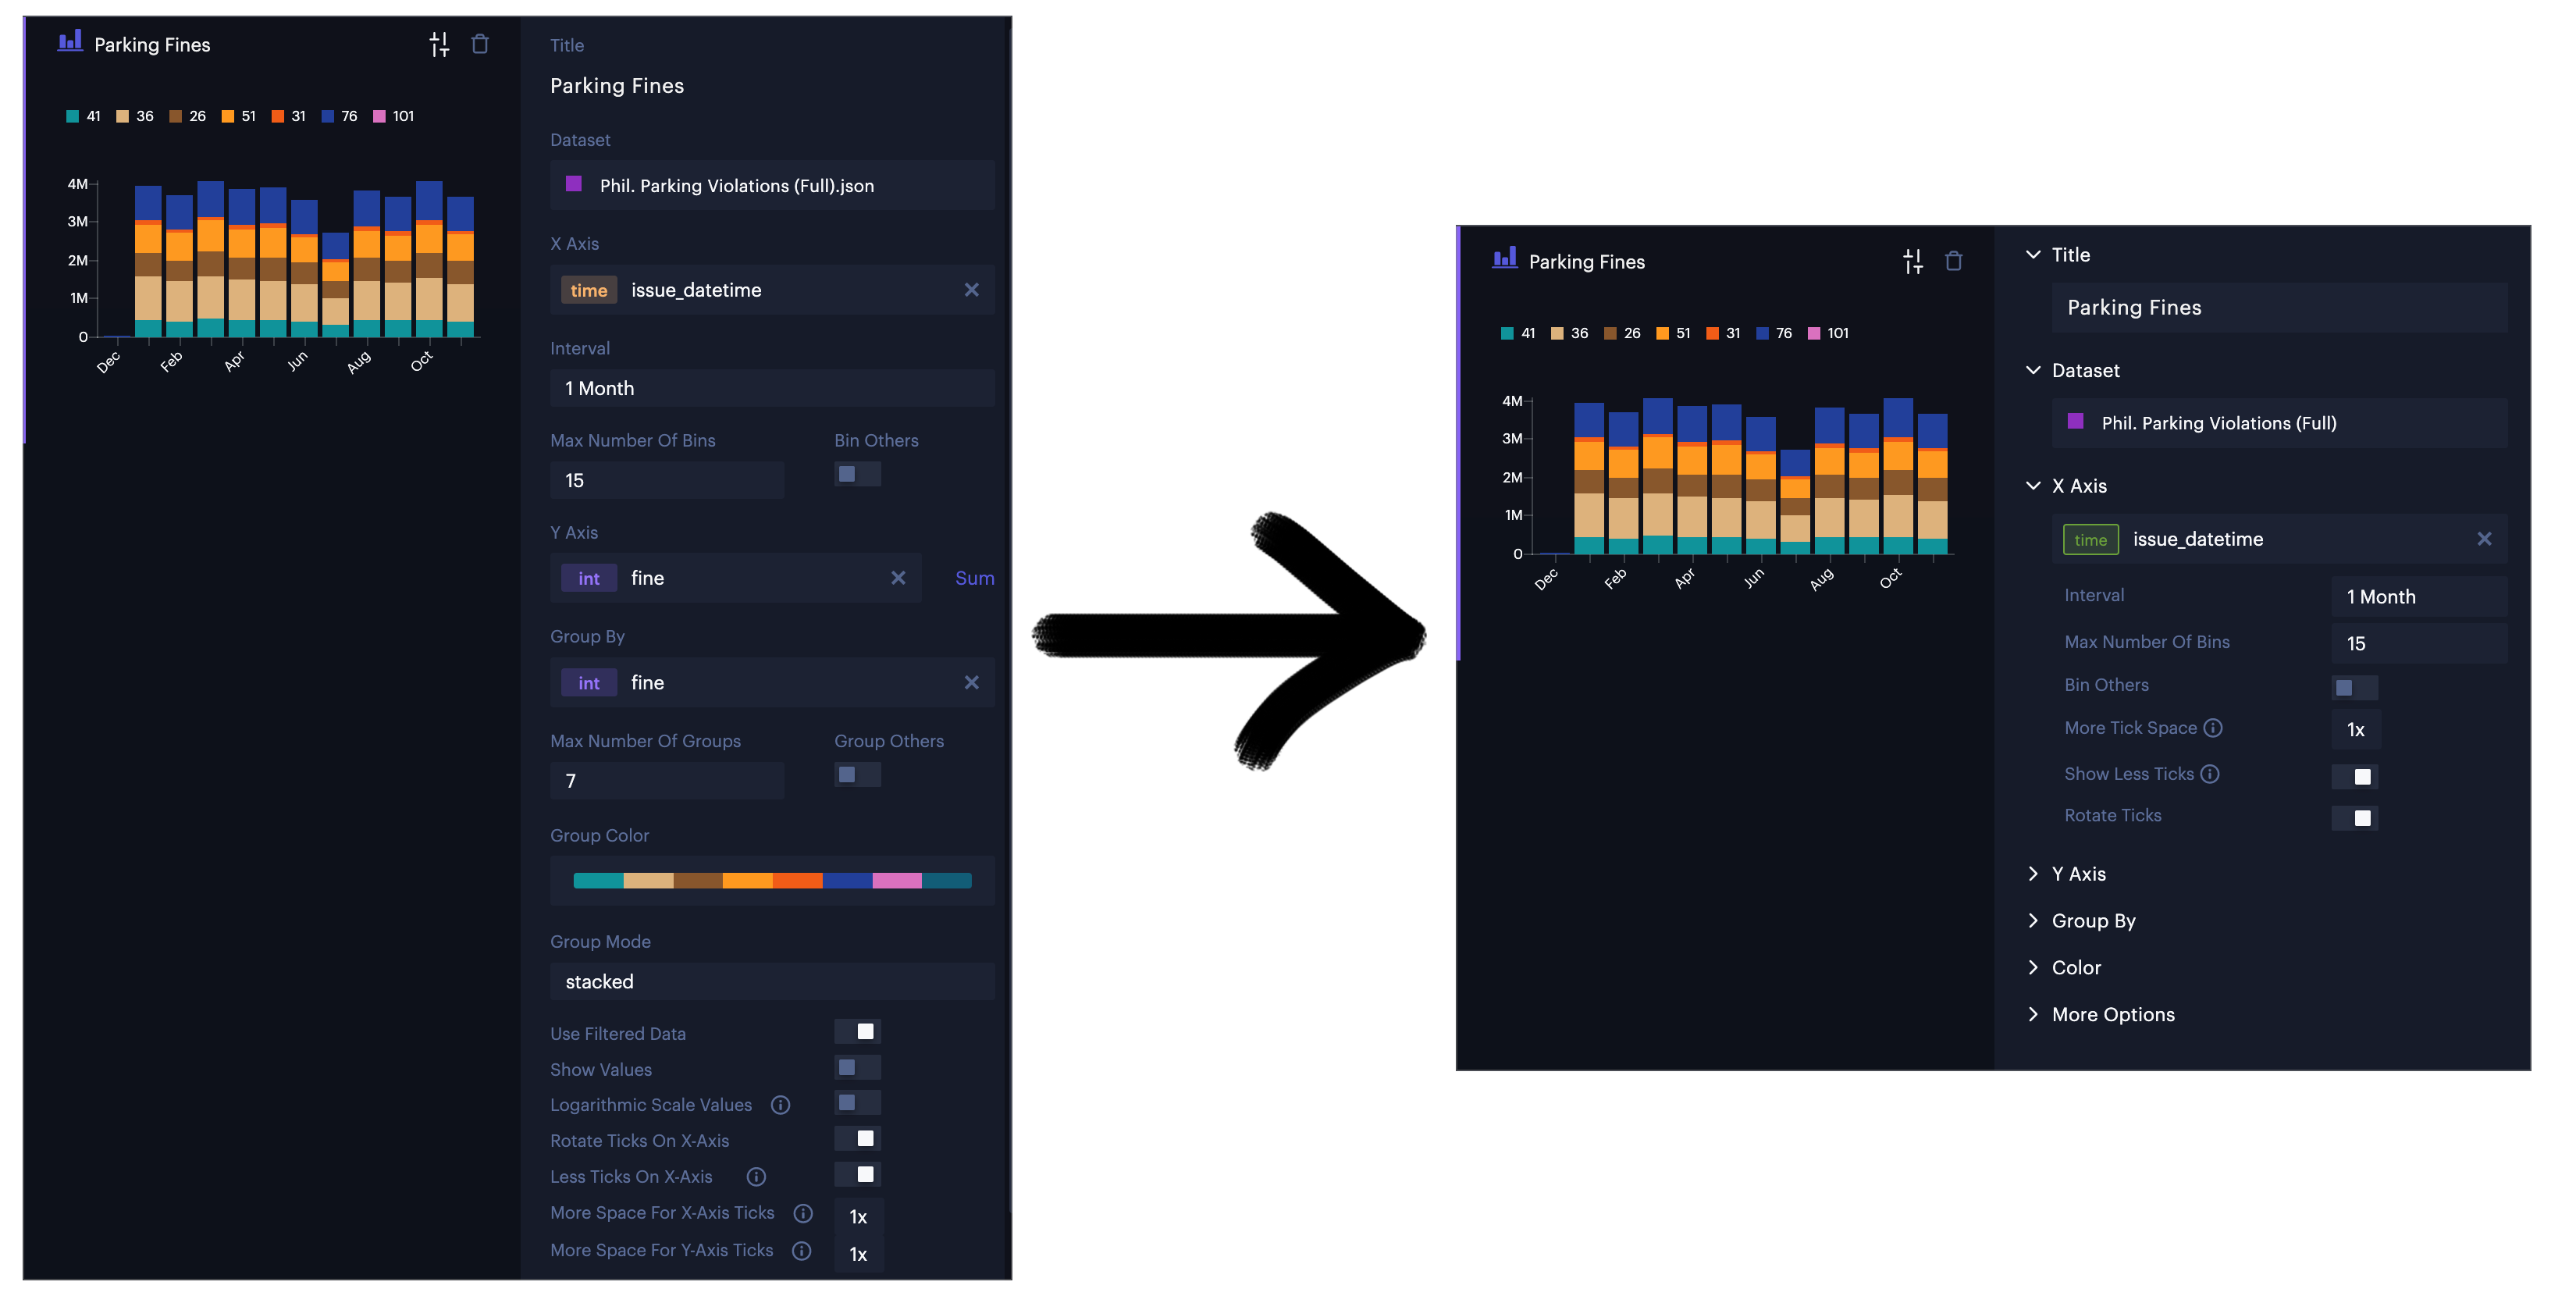
Left: Old chart configuration panel; Right: New chart configuration panel.
Grafana Studio Plugin
The official Foursquare Studio Panel plugin is now available as a direct download on Grafana, providing the power of Studio to build location intelligence on your dashboards. Add it to Grafana Cloud with a single click, or install it via the CLI for local Grafana instances. Read our blog post for more information.

The Studio plugin is now available as a direct download on Grafana.
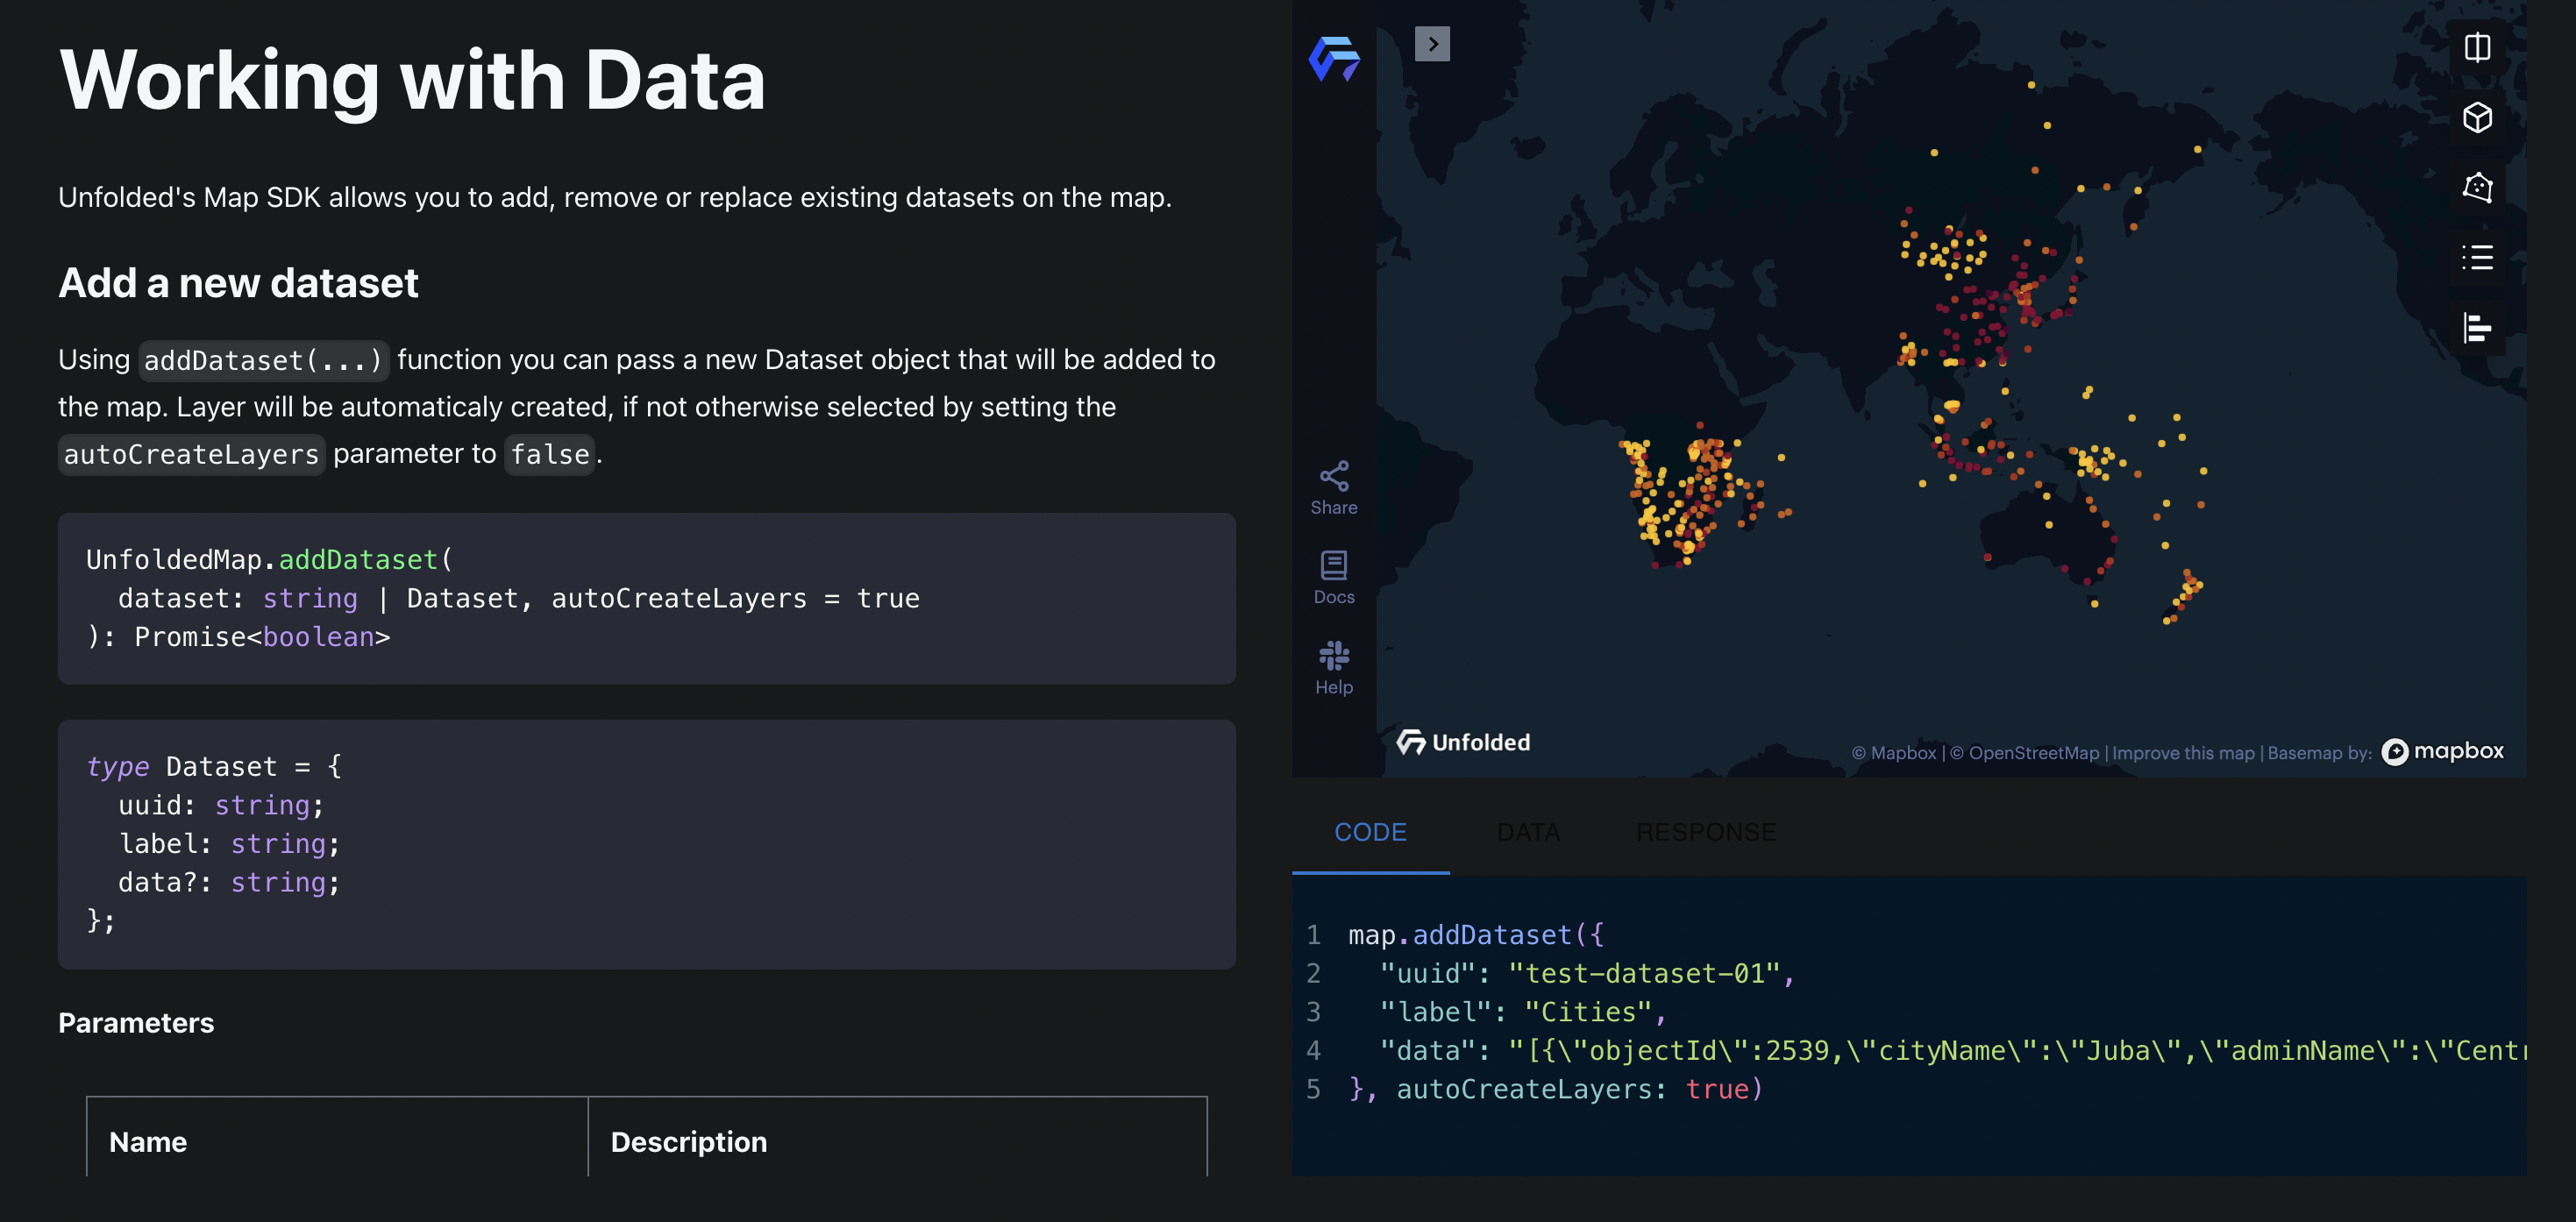
Map SDK Updates
Map SDK version 1.2.0 features new APIs for layer groups as well as support for Databricks notebooks. Learn how to set up the Map SDK on your environment.
![Using the [SDK Playground]\(<https://foursquare.github.io/fsq-studio-sdk-playground/>](https://files.readme.io/11d39e7-sdk-playground.png)
Using the SDK Playground to test the Map SDK.
Allow Data Export in Published Maps
As a new pro feature for published projects, allow users to export data on the map. With this option enabled, users are free to extract both data imported to Studio as well as data generated in Studio, including the output of analysis modules such as Cluster-Outlier Analysis or Suitability Analysis.
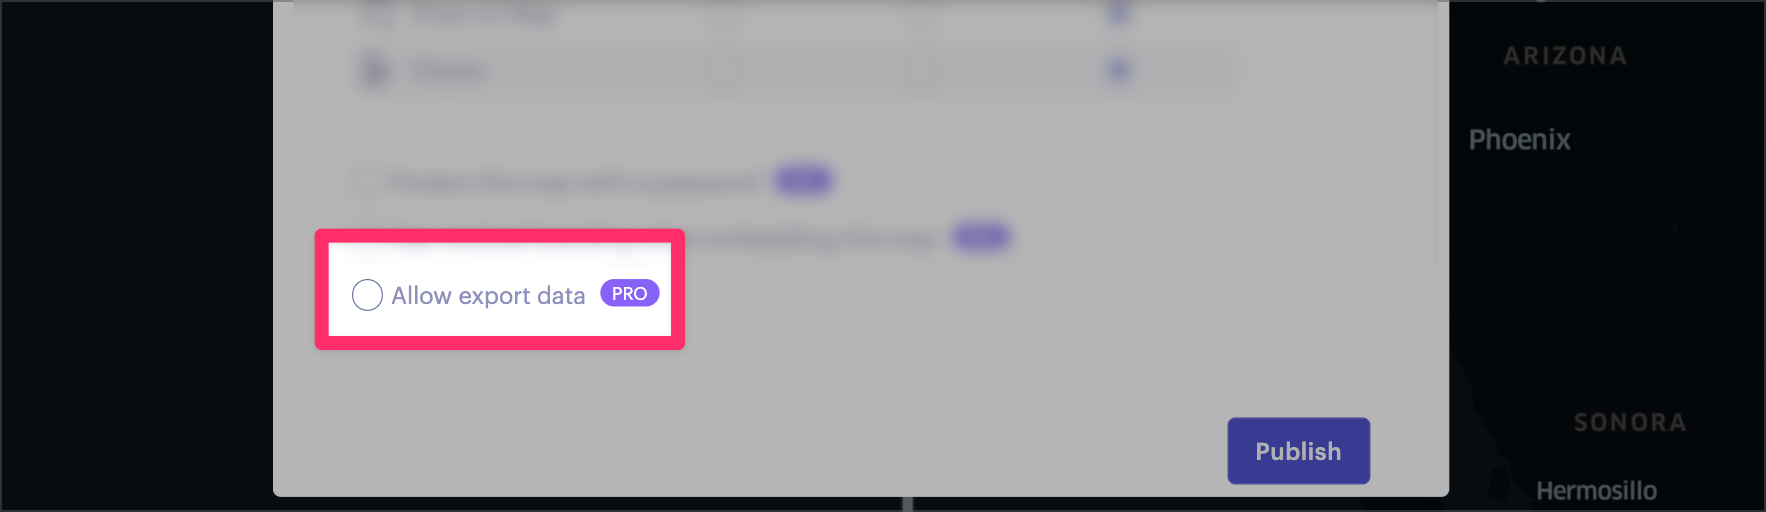
The "Allow Export Data" option on published maps.
Version 1.45
Released Sep 1, 2022
Map SDK v1.0
We have released version 1.0 of the Map SDK, providing far more control over Studio's map, layer, dataset, and filter elements.
Map SDK v1 extends functionality via a new set of APIs along with type safety, stability, and consistency across the Javascript and Python packages. Try it out now on the Map SDK playground or follow the set up guide to get started on your local environment.
Using the Map SDK v1 in the Map SDK playground.
Bar Chart
Plot and display your datasets with Studio's new bar chart. Our implementation pays special attention to your data's context, inferring its statistical type (e.g. continuous, categorical, or temporal), then applying automatic binning and other preset configurations. While powerful out of the box, the bar chart is equipped with a large set of aggregation, binning, and grouping options.
Dashboard: Dataset Selection Improvement
It is now easier to organize your datasets and queries, find and delete stale items, or select datasets in bulk to share or download. Use the new Select All button to select or unselect everything, and use shift-click to select ranges of datasets. From the query and dataset tabs, click on column headings to sort your data in ascending or descending order.
Version 1.44
Released Aug 16, 2022
Dashboard: Queries Section
All previously defined queries can now be found in the Data Tab under a new Queries section. In the Queries section, you may sort, share, and delete any query.
Custom Color Scale for Aggregated Layers
You may now apply a custom color scale to aggregated layers, such as the Grid, Hexagon, and Cluster layer.
Improved Data Formatting
From the data table, select a formatting style for a column data type. Changes made here will be reflected across the Studio platform.
Timezone Selection
When using a time filter, use the new timezone dropdown to display your project's temporal data formatted in the appropriate time zone.
Version 1.43
Released Jul 25, 2022
Suitability Analysis: Color Palettes
You may now customize the color palette of the suitability analysis layer during its initial set-up.
Data Catalog: New OpenStreetMap Hex Tile Datasets
Unfolded's Data Catalog now offers Hex Tile datasets from OpenStreetMap, including global railways, US buildings, and US highways. Bring these datasets into your analytics to discover spatial relationships with infrastructure.
Time Filter: Custom Intervals
You may now apply custom x-axis intervals to temporal data with a time filter.
Format Values in Data Table
In the Data Table viewer, apply formatting to values in a column to better match a dataset's context.
Shapify Improvements
Shapify can now be accessed from the dataset action menu, opening a dedicated sidebar with settings and parameters.
Updated 10 months ago