
H3 Layer
H3 layers visualize spatial data using H3 Hexagonal Hierarchical Spatial Index.
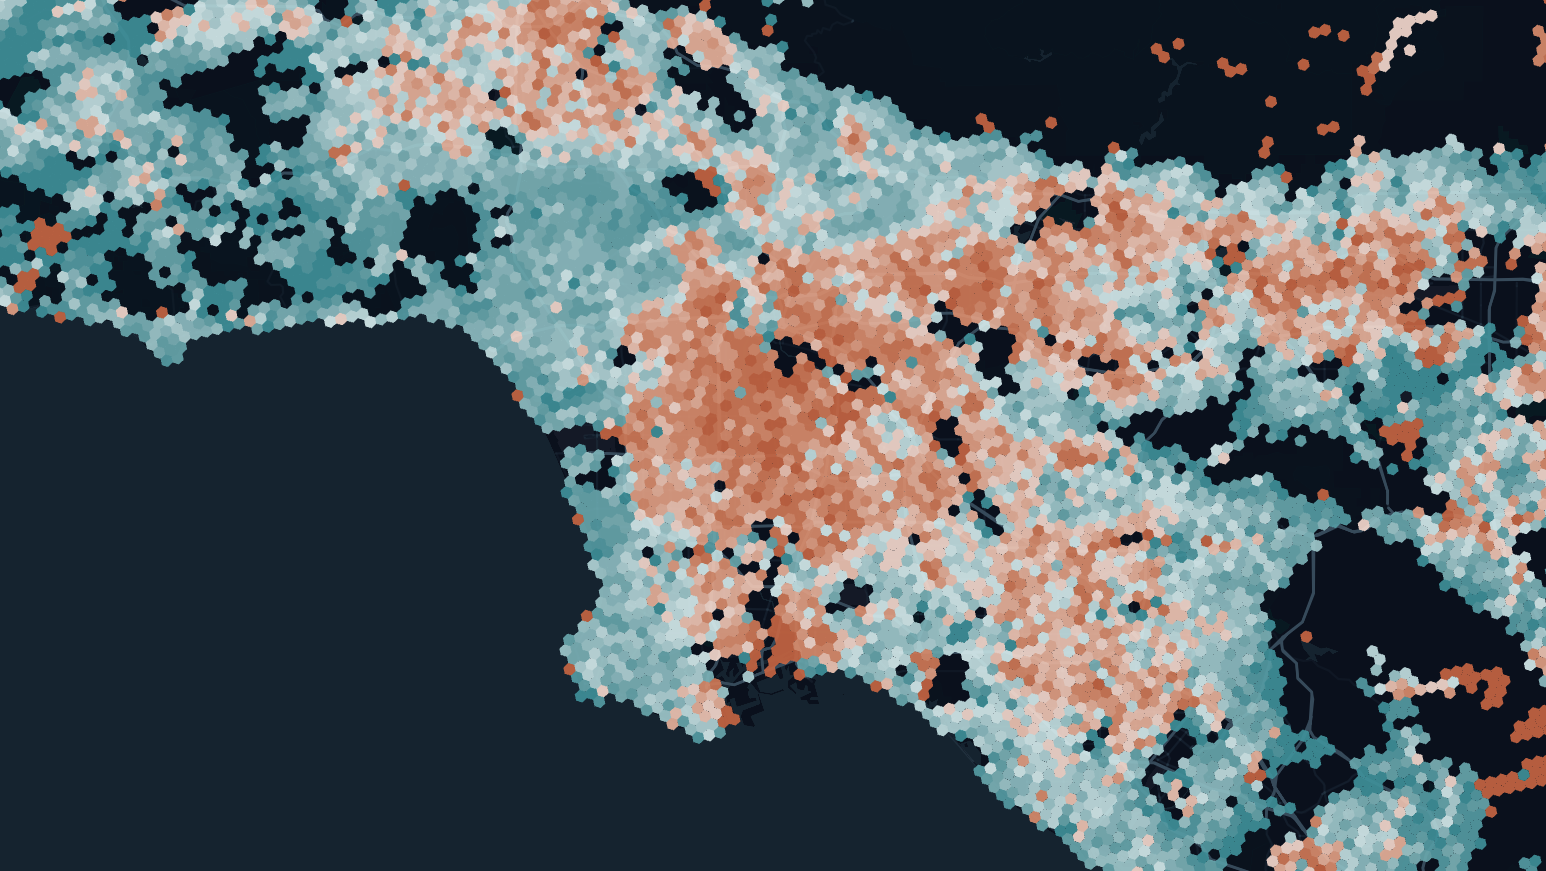
An example of the H3 layer.
Usage
To use an H3 layer, you need a hex_id or hexagon_id in your dataset, which can be generated using h3-js from latitude, longitude and resolution.
Studio auto generates H3 layer from column: hex_id, hexagon_id
Sample dataset:
| hex_id | value |
|---|---|
| 89283082c2fffff | 64 |
| 8928308288fffff | 73 |
| 89283082c07ffff | 65 |
| 89283082817ffff | 74 |
| 89283082c3bffff | 66 |
| 89283082883ffff | 76 |
Settings
The following settings are available for the H3 layer:
Basic
Core settings of the H3 Layer.
| Setting | Description |
|---|---|
| Layer Type | Must be H3 to use the H3 Layer. |
| Dataset | The dataset from which to derive H3 indexes. |
| Hex ID | The column containing H3 indexes. |
Fill Color
Fill color settings for H3 hexagons.
| Setting | Description |
|---|---|
| Fill Color Toggle | Toggle to add or remove a fill color. |
| Color Based On | The metric that the fill color is based upon. |
| Color Scale | The color scale and palette of the layer. |
| Fill Opacity | The opacity of color fill. |
Outline
Outline/stroke settings for H3 hexagons.
| Setting | Description |
|---|---|
| Outline | Toggle to enable/disable outline. |
| Stroke Color Based On | The metric that the fill color is based upon. |
| Stroke Color Scale | The color scale and palette of the stroke. |
| Stroke Width (Pixels) | The width of the stroke/outline in pixels. |
| Opacity | The opacity of the H3 cells, 100 = 100%, 0 = 0%. |
Coverage
Coverage settings for H3 hexagons. Coverage refers to how much space the H3 hexagon takes of the H3 grid.
| Setting | Description |
|---|---|
| Coverage | The percentage of area the H3 cell spans. 100 = 100%, 0 = 0%. |
Height
Height settings for H3 hexagons. Height is best viewed with 3D viewing mode.
| Setting | Description |
|---|---|
| Height | Toggle to enable/disable cell height. Optimally used in 3D/Globe view. |
| Height Based On | The metric that the height is based upon. |
| Height Scale | The scale that H3 cells use for height. Choose from Linear (default), Sqrt, or Log. |
| Height Multiplier | A float to multiply height by. |
Label
Label settings for the H3 layer. Labels will appear on each H3 cell.
| Setting | Description |
|---|---|
| Label | One or more labels to add to the H3 cell. |
| Font Size | The size of the font. Scales as users zoom in and out. |
| Font Color | The font's color. Choose from preset colors or type a hex/rgb value in the color picker. |
| Outline Width | The width of the outline in pixels. Set to 0 to disable the outline. |
| Outline Color | The color for the outline label. |
| Background Color | Toggle to enable a background color for the label. Choose a color with the color selector. |
| Text Anchor | The horizontal location that the text begins in. Either start, middle, or end. |
| Alignment | The vertical alignment of the text. Either top, center or bottom. |
JSON Schema
For details on how to programmatically specify layer properties, refer to the Layer Configuration specification.
Updated 3 months ago