
View Data
You can view data in a table view, allowing you to inspect the actual columns and values of your datasets.
To open the table view, click the Show Data Table button next to a dataset.
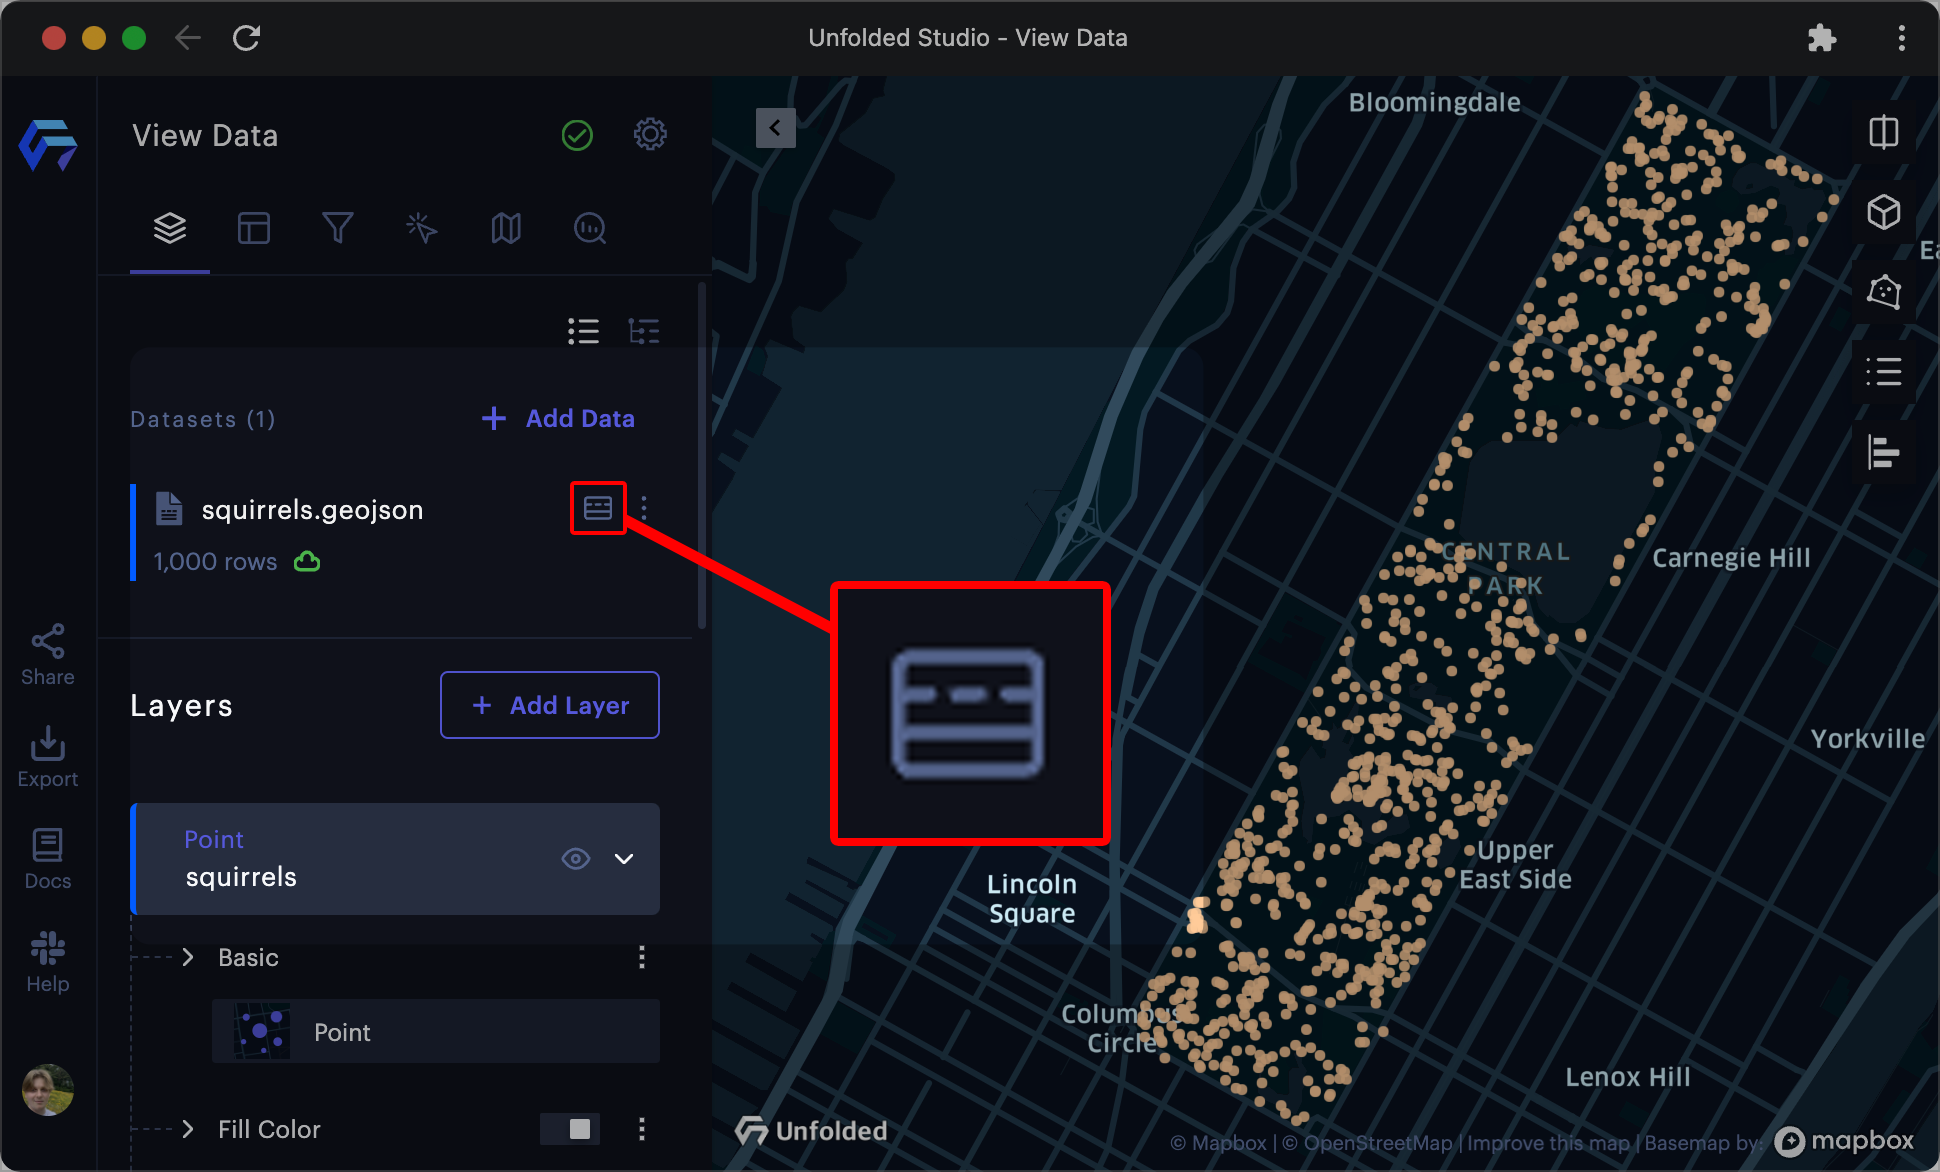
The show data table button in Studio.
Table Features
The first row of the table contains all column names and their associated data types (i.e. int, time, string). The data type is inferred by Studio when you import the dataset.
Studio provides a panel containing column statistics. The statistics displayed in this window depend on the data type and the range of values for each column. For example, time data may display a start and end date, while float values may contain the mean, standard deviation, and various quantiles and distributions.
Column Options
Hover over a column to reveal a ⋮ Options button. The options menu contains the following functions:
| Function | Description |
|---|---|
| Sort Ascending & Sort Descending | Sorts the entire table in ascending/descending order of values in the selected column. |
| Pin | Locks the selected column to the left while you explore the table. |
| Copy | Copies the column's data to your clipboard. |
| Format | Apply formatting to values in the column. Select from several common formatting options. To format several columns at once, see the section below. |
Format Data Types
Click the Settings ⚙ button on the top-right of the table to select the data type you wish to format. Currently, formatting options are available for integer, float, timestamp, date, and boolean columns. These formatting changes will be reflected across all data displays, including the table, mouse-over tooltip, and preview panels.
View Column Data
To view only data from a single column in a lightweight panel, please visit the View Column Data documentation.
Updated 3 months ago