
Flow Layer
The Flow Layer is an effective way of visualizing origin-destination movement patterns. Flows are a great choice for analyzing traffic flows, commute patterns, and migrations.
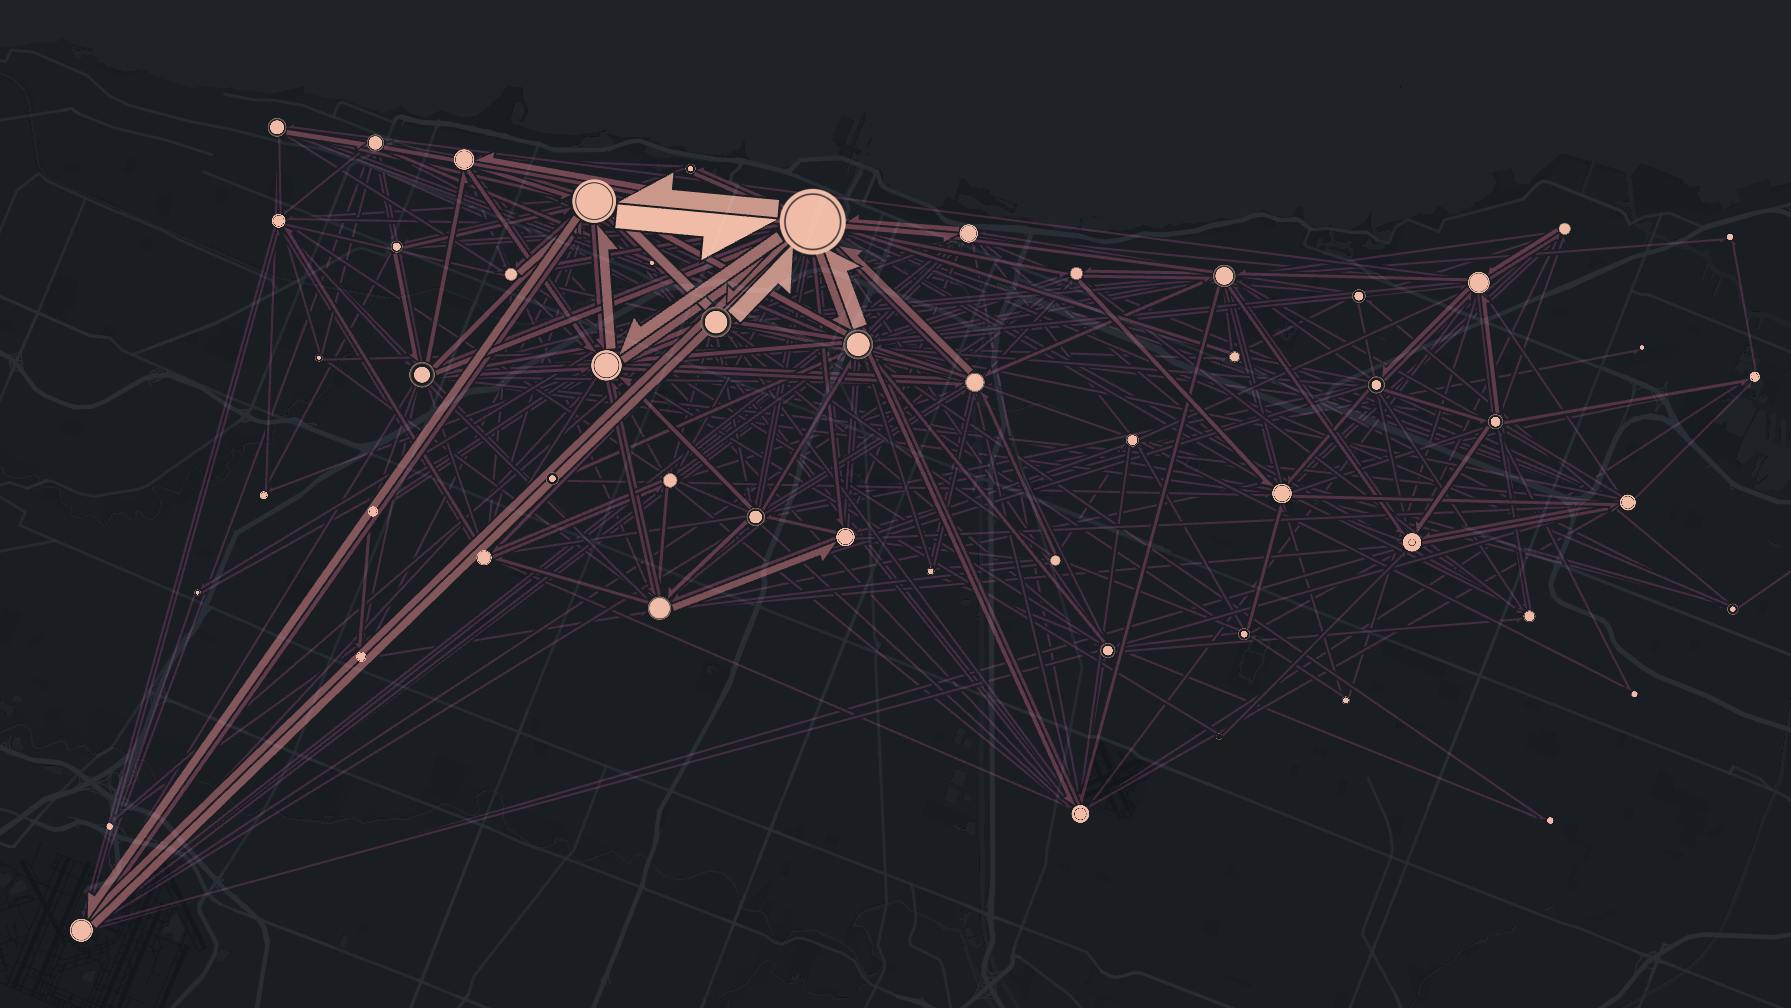
An example of the Flow Layer.
Settings
The following sections detail every setting available for the Flow Layer.
Basic
Core settings for the Flow Layer.
| Setting | Description |
|---|---|
| Layer Type | Must be Flow to display the Flow Layer. |
| Dataset | The dataset to use for the Flow Layer. |
| Columns | Columns to use for the Flow Layer. Must fill the required fields of Lat/Lng or H3 Hexagons. |
| Lat/Lng | Specify a pair of source/target latitude and longitude columns. Optionally, include a count (used for weighting points), as well as a Source Name and Target Name. |
| H3 Hexagons | Specify a pair of source/target H3 columns. Optionally, include a Source Name and Target Name. |
Color
Color settings for the Flow Layer.
| Setting | Description |
|---|---|
| Color Palette | The color scale and palette for the Flow color. |
| Dark Base Map | Enable to increase visibility on a dark base map. |
| Opacity | The opacity of the flows. 100 = fully opaque, 0 = fully transparent. |
Fade
Fade setting for the Flow Layers.
| Setting | Description |
|---|---|
| Fade Toggle | Enable to fade smaller flows. |
| Fade | Slide to fade smaller flows. |
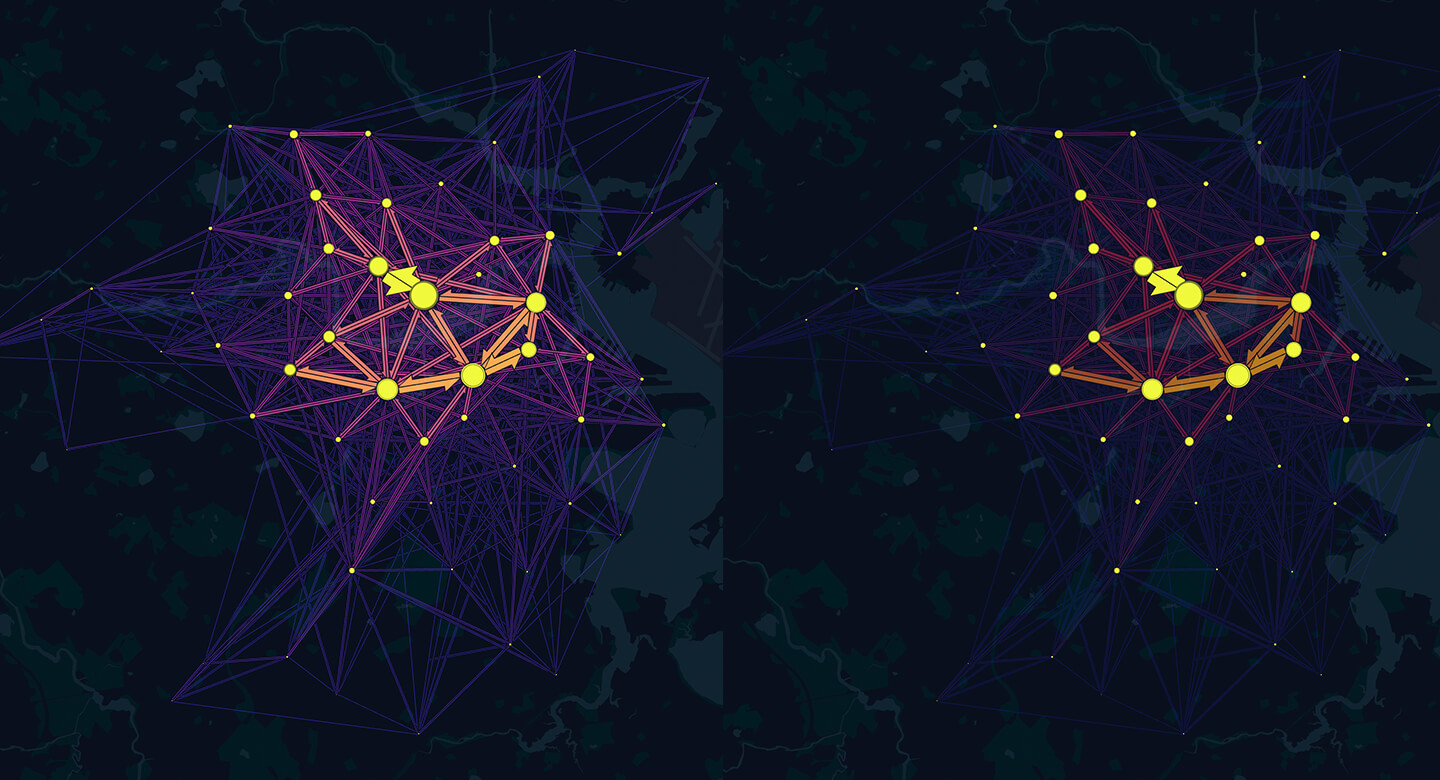
Left: Fade = 0; Right: Fade = 30.
Display
Additional display settings for the Flow Layer.
| Setting | Description |
|---|---|
| Animation | Animates the Flow Layer. |
| Flowing | Groups nearby source/target points. Increases visibility and adapts as you zoom in and out. |
| Location Totals | Create a new location totals circle at each flow Flow, its size based on the number of flows in and out of the location. |
| Adaptive Scaling | Adjusts flow thickness based on flows inside the current viewport. When disabled, flow thickness is based on all flows on the map. |
| Max Top Flows to Show Alider | Slide to increase/decrease the max number of flows displayed. |
Charts
The Flow Layer supports Tooltip Charts. Using the Tooltip Chart with the Flow Layer, you can display chart metrics in the mouse-over tooltip. This allows users to interactively explore the top origins and destinations for any given point on the map.
Follow these steps to create a Flow Layer chart:
1. Create a Flow Layer, then click Show Charts.
2. Click Add Chart, then select Tooltip Chart.
3. A chart of the flows will automatically generate. Click Chart Settings to configure the Tooltip Chart.
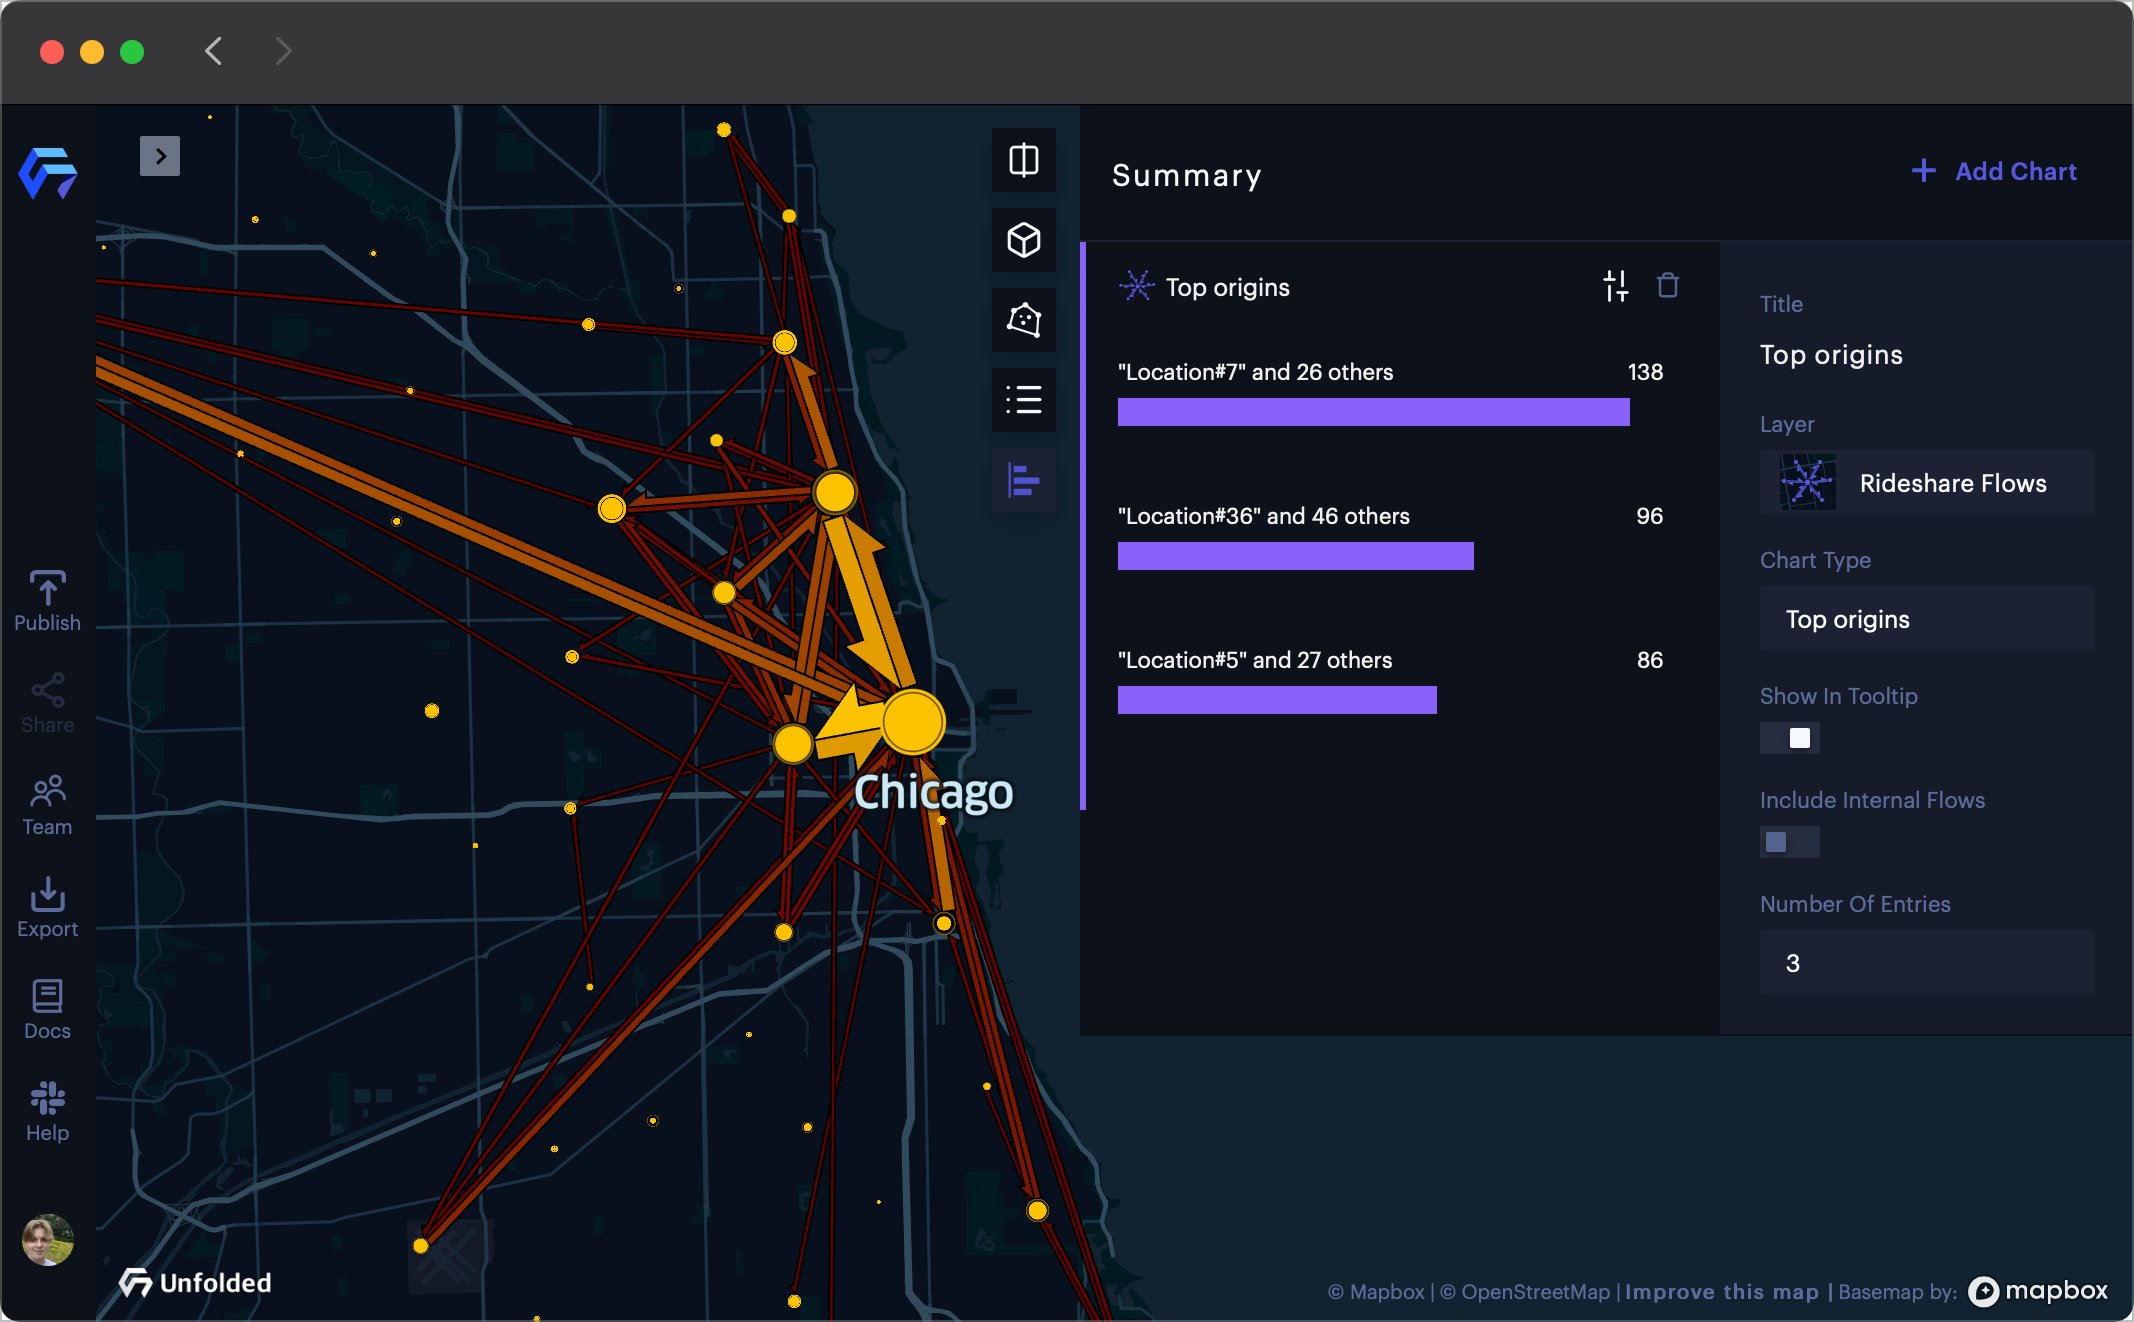
A Flow Chart showing Chicago rideshare data.
The charts will update to the viewport when zooming to show the Flowed locations for the current zoom level.
Chart Settings
| Setting | Description |
|---|---|
| Title | Title of the Tooltip Chart. |
| Layer | Layer to represent in the chart. |
| Field and Aggregation | The type of information to display (based on the layer selected). |
| Show in Tooltip | If enabled, displays chart metrics in the mouse-over tooltip. |
| Include Internal Flows | If enabled, includes internal flow data in the chart metrics. |
JSON Schema
For details on how to programmatically specify layer properties, refer to the Layer Configuration specification.
Updated 3 months ago