
Interactions
Studio's interaction features provide users with a toolkit to explore your visualizations.
To add/remove interactions to your project:
-
Open the Interactions menu by clicking the Interactions icon in the sidebar.
-
Click the switch next to the interaction you wish to activate/deactivate.
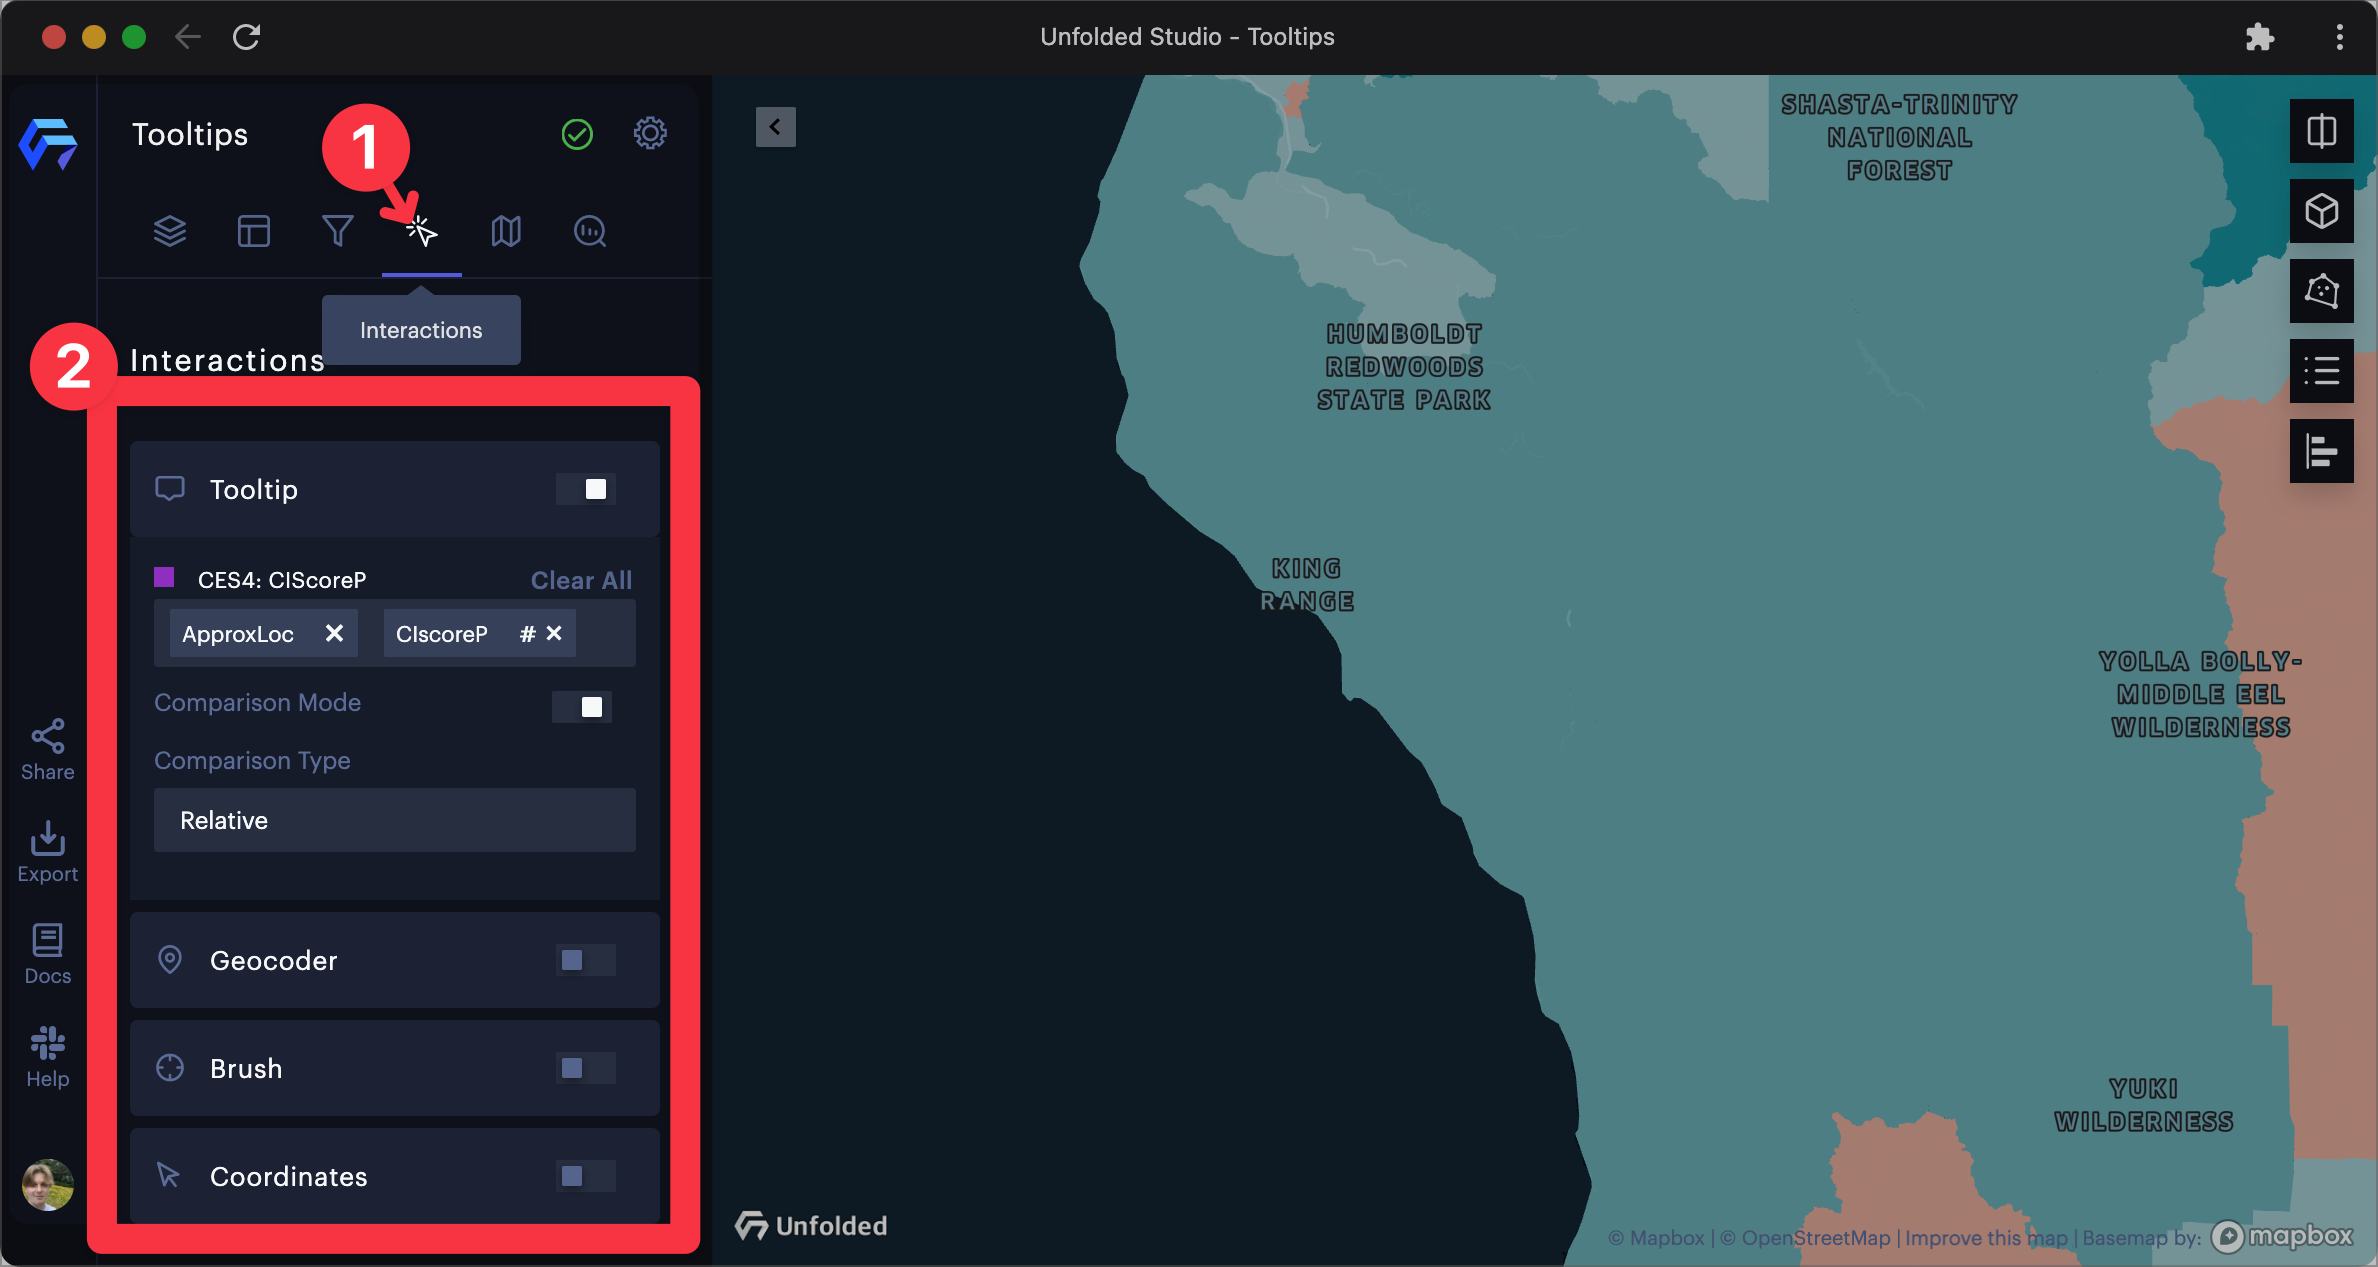
Opening the interaction menu in Studio.
Interactions to choose from include: Tooltip, Geocoder, Brush and Coordinates.
Note:
The brush and tooltip cannot be toggled on at the same time.
Tooltip
Toggle Tooltip to display metrics when the user's mouse hovers over a data point. Choose which fields are displayed in the tooltip configuration menu.
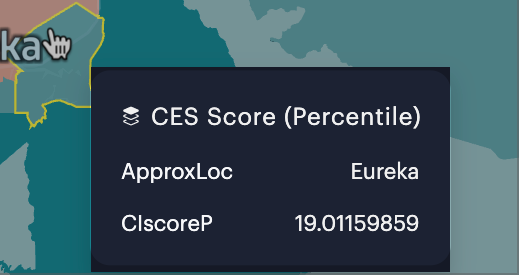
A basic tooltip showing a pollution percentile score for census-designated areas.
You can reorder tooltips by dragging and dropping the column labels. Columns placed first will appear on top of the tooltip, and columns placed last will show at the bottom of the tooltip.
Comparison Mode
With Comparison Mode enabled, users can click to place a primary tooltip in a location, then continue exploring the map to compare different data points in secondary tooltips.
Click the map to place a primary tooltip. If you need to move this tooltip, click the Move (< or >) button to shift the tooltip to the left or right. The option presented depends on the location of the tooltip.
Comparisons are shown next to metrics on the secondary tooltip. Red text represents a decrease from the primary metric, while green text represents an increase from the primary metric.
You can also change the Comparison Types:
| Comparison Type | Definition |
|---|---|
| Absolute | Absolute comparison = (Values in secondary tooltip) - (Values in primary tooltip) |
| Relative | Relative comparison = ((Values in secondary tooltip) - (Values in primary tooltip) / (Values in primary tooltip)) * 100) |
To remove the primary tooltip, click the Pin button (represented by a blue pin).
Formatting
Click the # (Format) on a metric to format it in the tooltip.
Displayed values in the tooltip can be formatted by selecting from a list of formatting options.
Images and Web Links
Images can be added to tooltips if the field name contains <img> and the field content contains http url.
Tooltips can also contain clickable web links. To add a web link to a tooltip, add a url that starts with <http://> to the field content.
Example dataset formatted to display images and a clickable link in the tooltip.
| id | <img>-tooltip | link |
|---|---|---|
| Colosseo | <http://my-image.com/colosseum.png> | https://en.wikipedia.org/wiki/Colosseum |
| Big Ben | <http://my-image.com/big-ben.png> | https://en.wikipedia.org/wiki/Big_Ben |
️ Note:
Images are not scaled to fit in the tooltip. Scale down large images to ensure visibility in the tooltip.
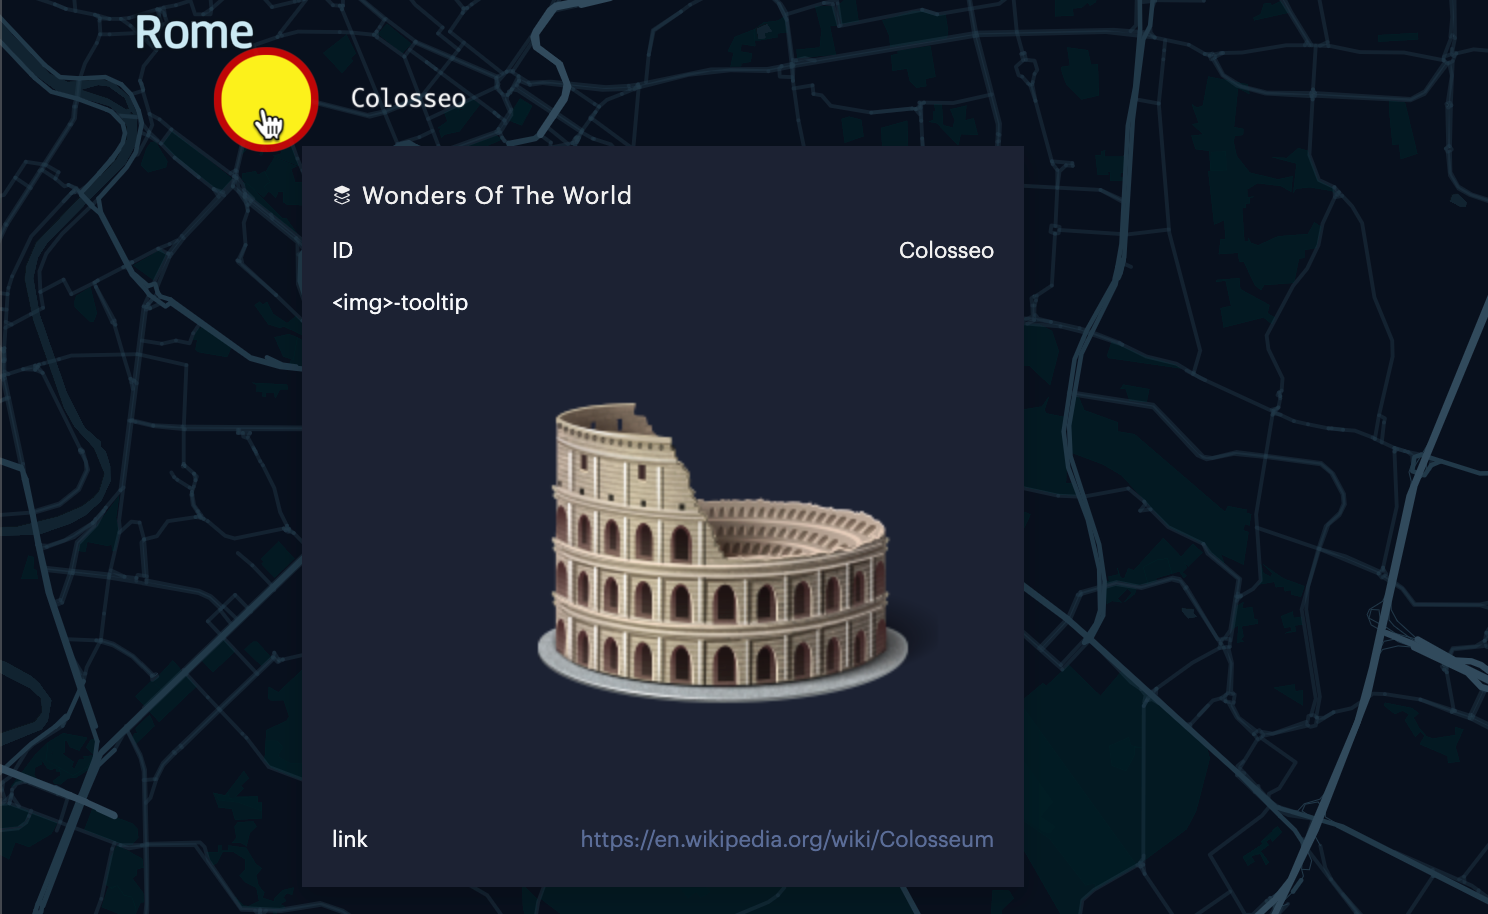
An example tooltip with both an image and a web link.
Legend
Toggle the Legend to display the legend on the map. Within the legend's settings, enable/disable datasets from appearing in the legend. You can also rename legend labels.
Geocoder
Toggle Geocoder to place a search box on your map, allowing users to search and jump to specific addresses or places of interest.
Brush
Toggle Brush visually explore large datasets by restricting the visualization to areas surrounding the cursor, allowing you to focus on trends in a specific area.
The Brush tool works particularly well with Arc Layers, allowing users to focus on localized trends in crowded datasets.
Display Coordinates
Toggle Display Coordinates to show the current coordinates and zoom level at the mouse cursor.
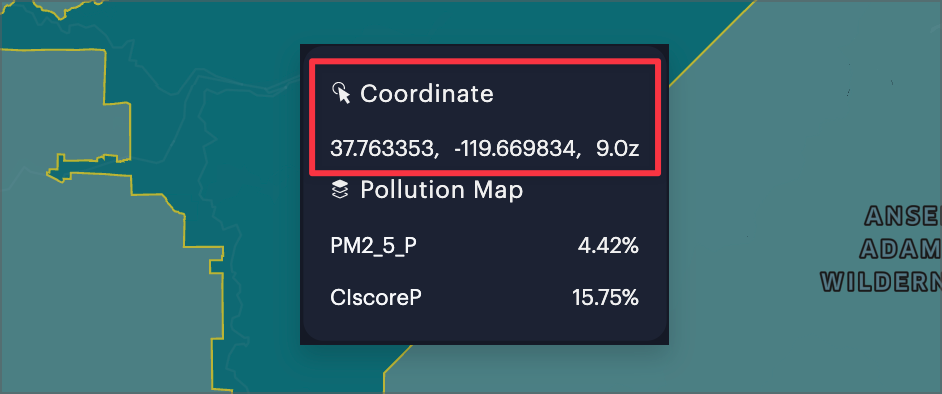
Displaying coordinates in the mouse-over tooltip.
Annotations
Toggle annotations on your map, allowing users to get a better view of the data.
Updated 3 months ago