
Overview
Displaying Chart Panel
Click on the Show Charts button to open the chart panel.
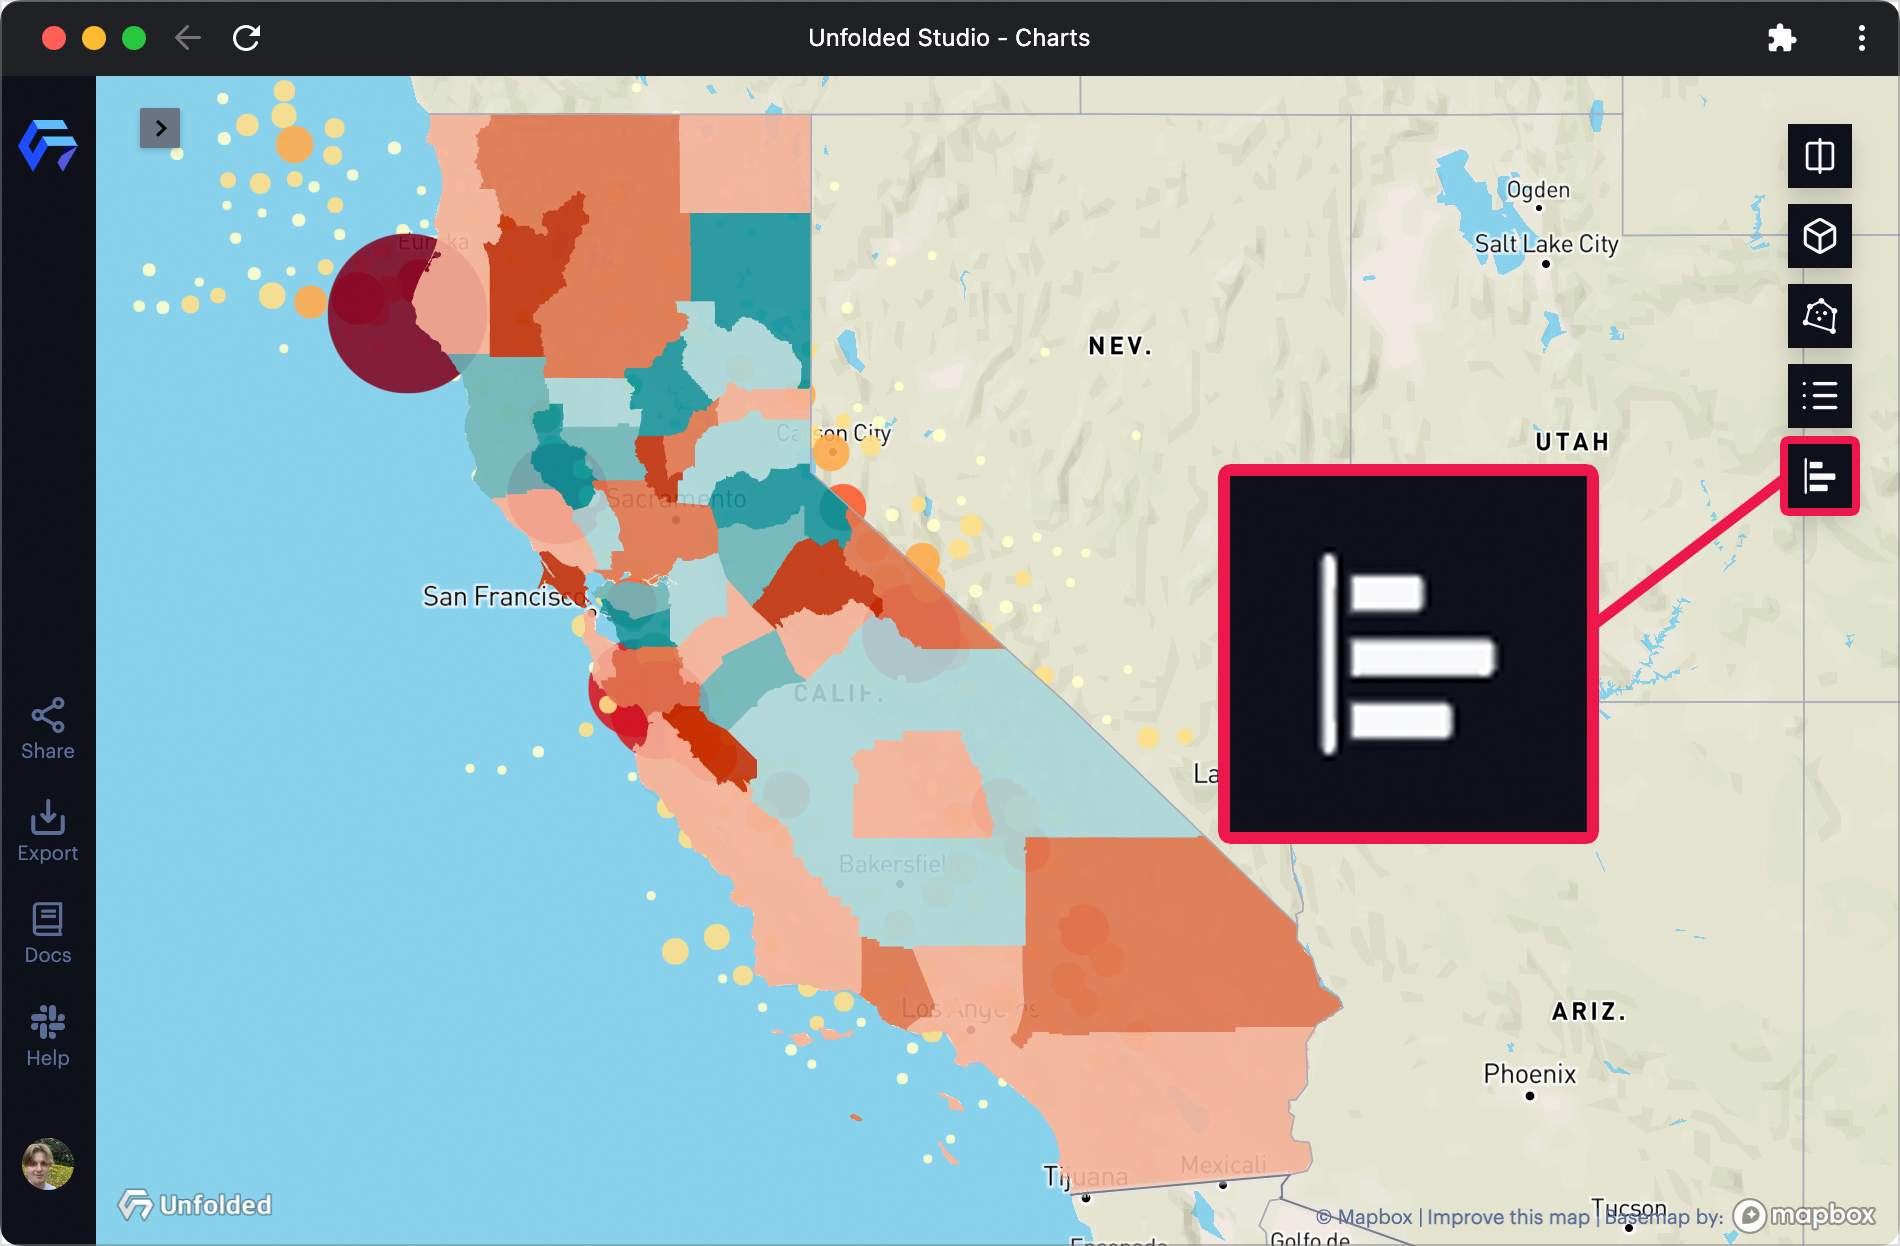
The Show Charts button in Studio.
All charts previously created will be shown in the chart tab on the right side of the map.
To create a new chart, click Add Chart then select a chart type.
After selecting chart type, a new settings panel appears.
Note: As chart settings differ between chart types, please visit the individual chart's documentation page.
You can toggle settings panel by click on the Chart Settings button. To delete a chart, click on Remove Chart button.
Vertically reorganize charts by dragging and dropping them in the desired position.
Toggle Filters
By default, a chart displays filtered data. When filters are changed, related charts will automatically update.
On supported charts, toggle Use Filtered Data to display data from the entire dataset or only filtered data.
Chart Hints
You can add hints in the form of short descriptions teaching users how to read your chart. These hints are displayed when the user hovers the mouse over the ⓘ button on the top of a chart.
Currently, chart hints are available for only the Line chart and Bar chart.
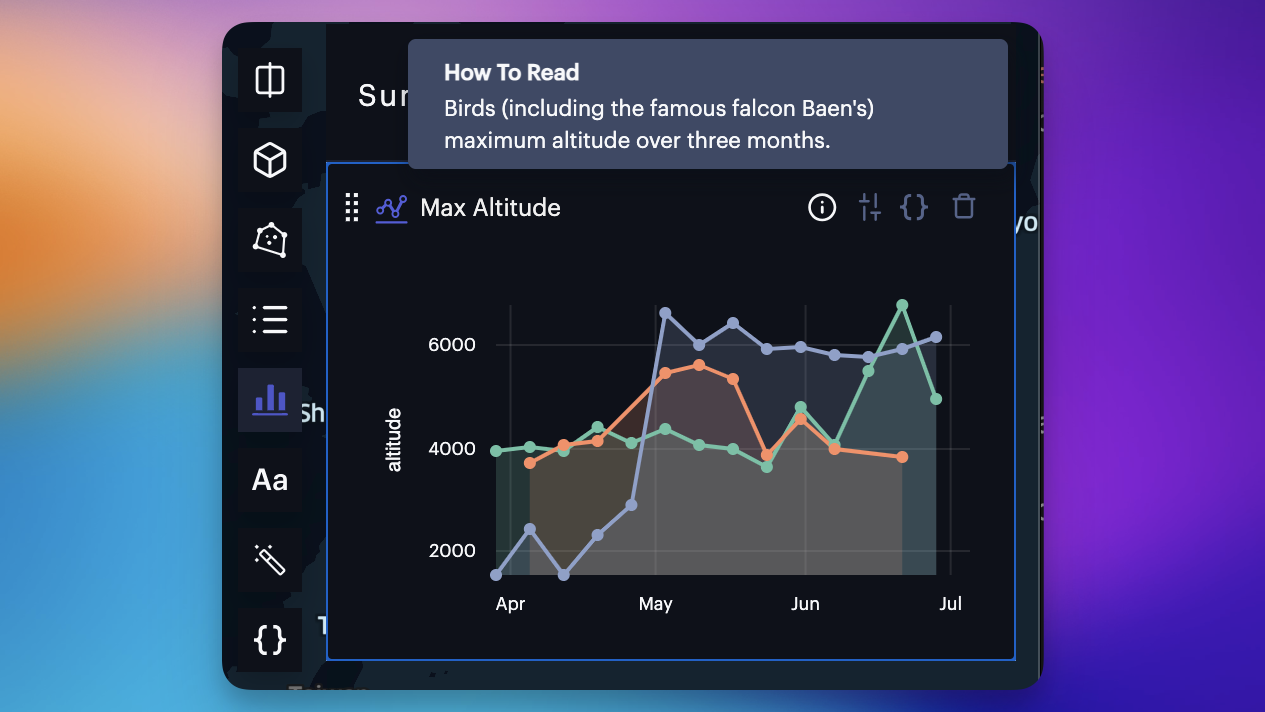
A chart hint displays when hovering over the ⓘ button.
Chart hints must be provided in a format using Expression formatting, which can be used to access chart elements.
'Birds maximum altitude over three months, starting from ' + lineData[0].time
Available Parameters
| Chart | Parameter |
|---|---|
| Line | groupByLabel |
| Line | lineData[0].time |
| Line | lineData[0].value |
| Bar | barValue |
| Bar | groupByLabel |
| Bar | xAxisLabel |
Updated 3 months ago