Foursquare is pleased to introduce Vector tile generation within Foursquare Studio. Enabling new workflows for users that want to map very large datasets, this new capability generates tilesets that allow enormous datasets to be visualized instantly.
A tool for working with Big Data
The new vector tile generation feature is yet another tool in Foursquare Studio’s arsenal for handling big data.
The geospatial industry has long relied on tiling as a way to deal with the massive size of geospatial datasets. The basic idea is to use the spatial distribution of the data to break it into increasingly finer tiles covering smaller and smaller geospatial subsets of the data.
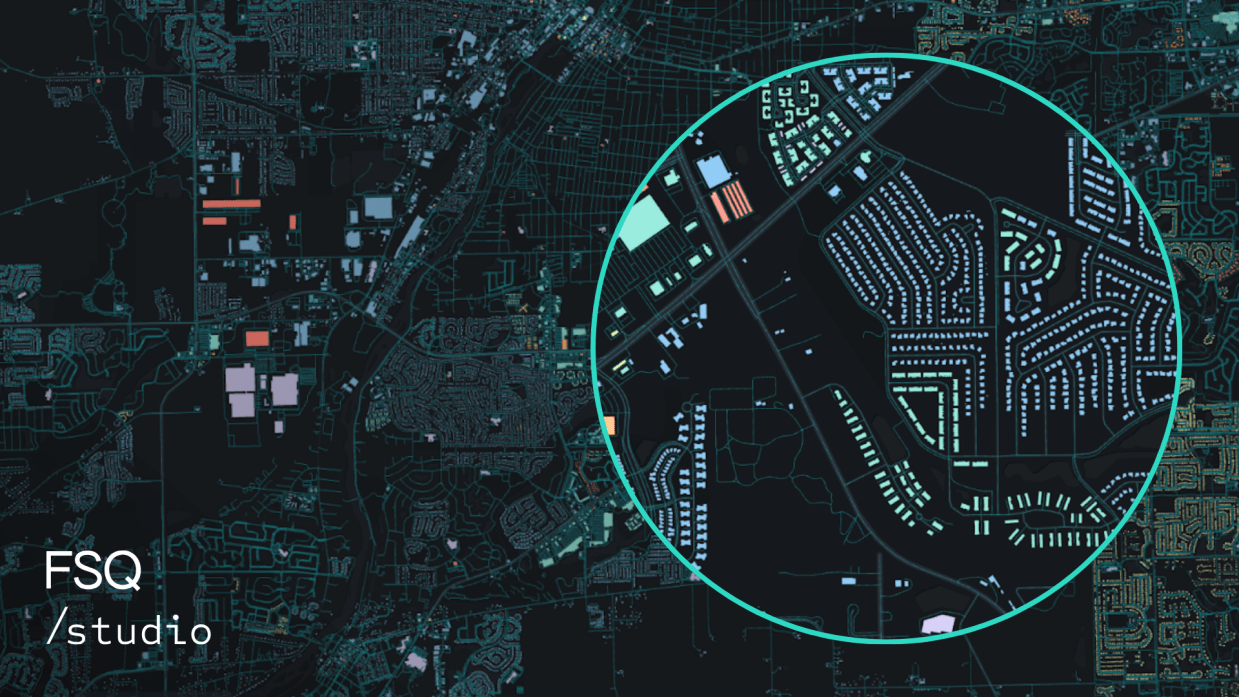
A well-tiled vector tile dataset is visually very similar to the visualization generated by loading the full data table. Even the most observant users won’t realize that the data is not loaded in full, but is instead streamed to the map in optimized chunks.
The application (in this case Foursquare Studio) loads the vector tiles dynamically to match the user’s experience. As the user zooms and pans around the map, the server delivers the appropriate chunk of information from the dataset.
Benefits of Vector Tiles with Studio
Big datasets – When working with geometry-equipped datasets of a substantial size (~250MB-1GB), loading them fully into Studio or any other geospatial platform can be problematic. Vector Tiles provide a lossless way around that.
Performance – Maps with Vector Tiles are typically significantly faster to load than maps referencing the original datasets. Those viewing your published map will not be waiting around for the map to load.
Time savings – Users no longer need to leave the platform or play with third-party tools to create vector tiles from their tabular datasets. They can now create vector tiles in just a couple clicks, or use our developer tools to integrate vector tiling into your team’s workflow.
Secure Data Hosting – By default, the generated tilesets are securely hosted by Foursquare and integrates with Foursquare’s existing authentication system, which can integrate with your company’s single sign-on solution.
Publishing – Vector tiles are a great choice for published maps, which can be shared with others directly or embedded in blogs and websites. With snappy loading and minimal impact to performance, maps created using Studio can stay immersed in your website without waiting for maps to load or being sent to a new tab/application.
Working With Vector Tiles In Foursquare Studio
Our approach with vector tiles is simple: we want to give you the tools to transform your massive datasets into optimized tiles without any headache. It’s only a couple clicks away in your browser, and only a couple lines of code via Studio’s Data API.
Generating Vector Tiles
In Studio’s Workspace, simply select a supported dataset and click the Vector Tile button.
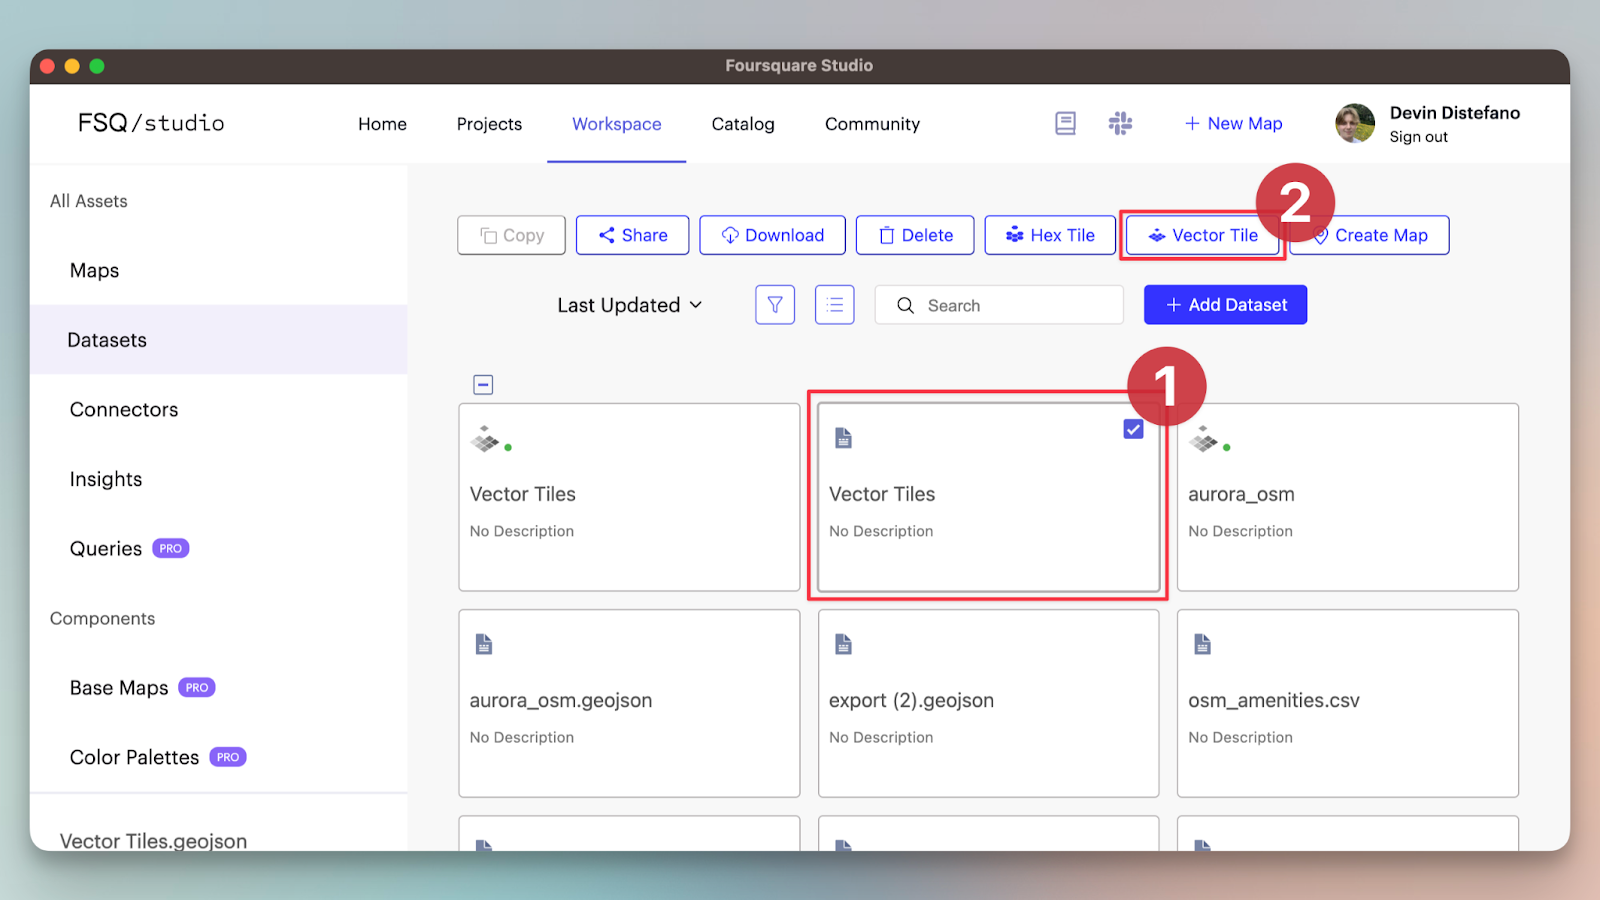
Studio will automatically read GeoJSON geometry, and upon confirmation, initiate the vector tiling process. If your dataset is a CSV, you will only be asked to select the geometry column.
Upon completion, a new vector tile dataset will appear in your Studio workspace.
Visualizing Vector Tiles
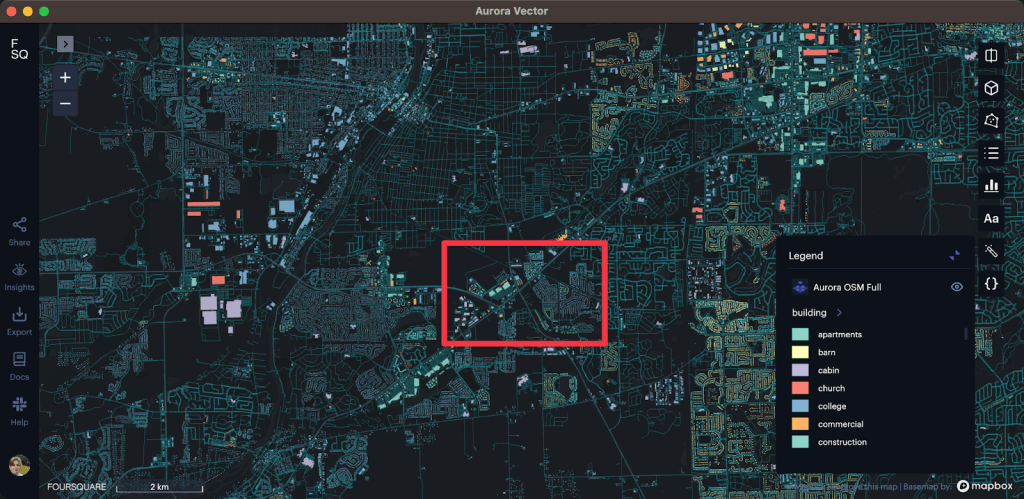
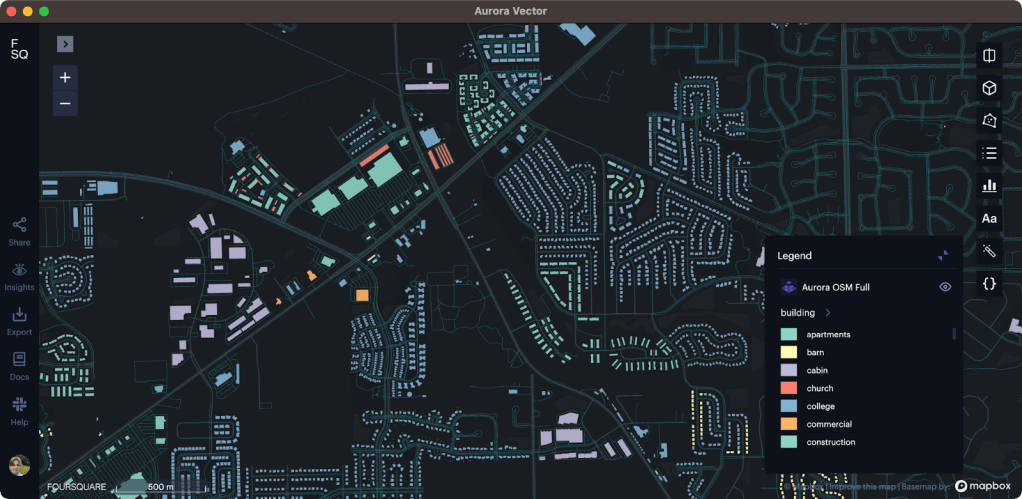
Visualization of generated vector tiles improves on Studio’s already extensive support for visualizing vector tile datasets, notably adding support for categorical color scales.
There are certain limitations when visualizing tiled datasets because only a small part of the dataset is loaded at any given time, meaning that calculations requiring a view of all the data in a table column are not possible.
However, vector tiles generated in Foursquare Studio always come equipped with metadata, allowing us to support additional features.
| Color Scale | No Metadata | With metadata | Metadata Requirements |
|---|---|---|---|
| Custom Breaks | ✅ | ✅ | None (the user specifies the ranges). |
| Quantize | ❌ | ✅ | Needs the global min and max value of each column. This metadata is stored during vector tile generation. |
| Quantile | ❌ | ❌ | Would need all values in a column to create equal-size bins. This is too much data to save as metadata. |
| Jenks natural breaks | ❌ | ❌ | Would need all values in a column to enable clustering. This is too much data to save as metadata. |
| Categorical | ❌ | ✅ | Needs a range of all discrete values for a column. This is saved in metadata for columns with less than 1000 discrete values. |
| Dynamic | ✅ | ✅ | Works on data in viewport. No metadata needed. |
external vector tile dataset may not provide sufficient metadata.
Dynamic colors
Foursquare Studio also offers Dynamic Color Scales for all tiled dataset types. Dynamic color scales are continuously recalculated to match the data that is available in the current view.
The global color scales remain unchanged as the view changes, but will typically look “flatter” and won’t highlight local data variations as well.
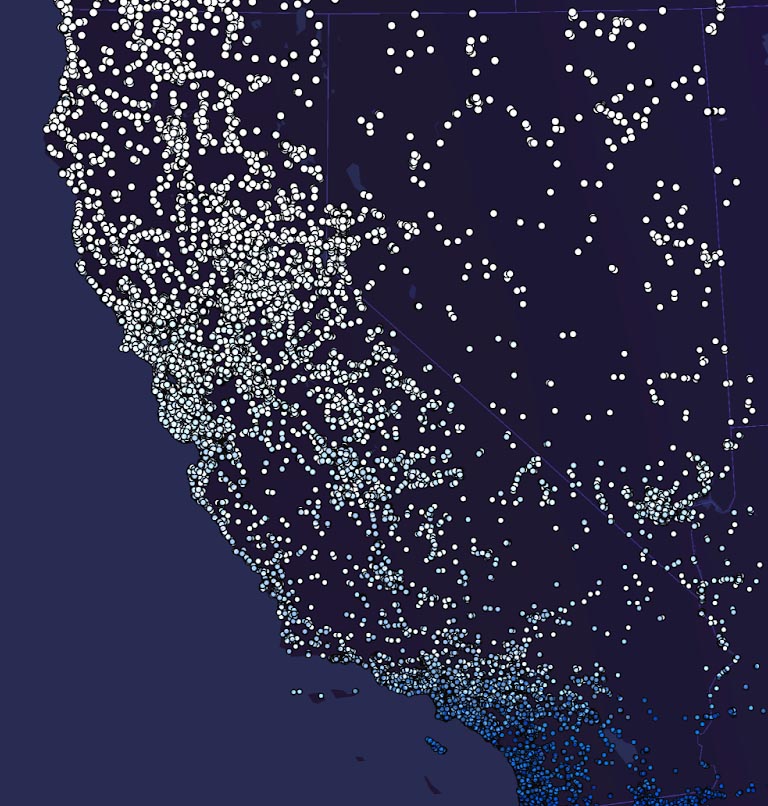
For example, take a look at this vector tile map displaying census tract populations for the State of California, studying San Francisco.
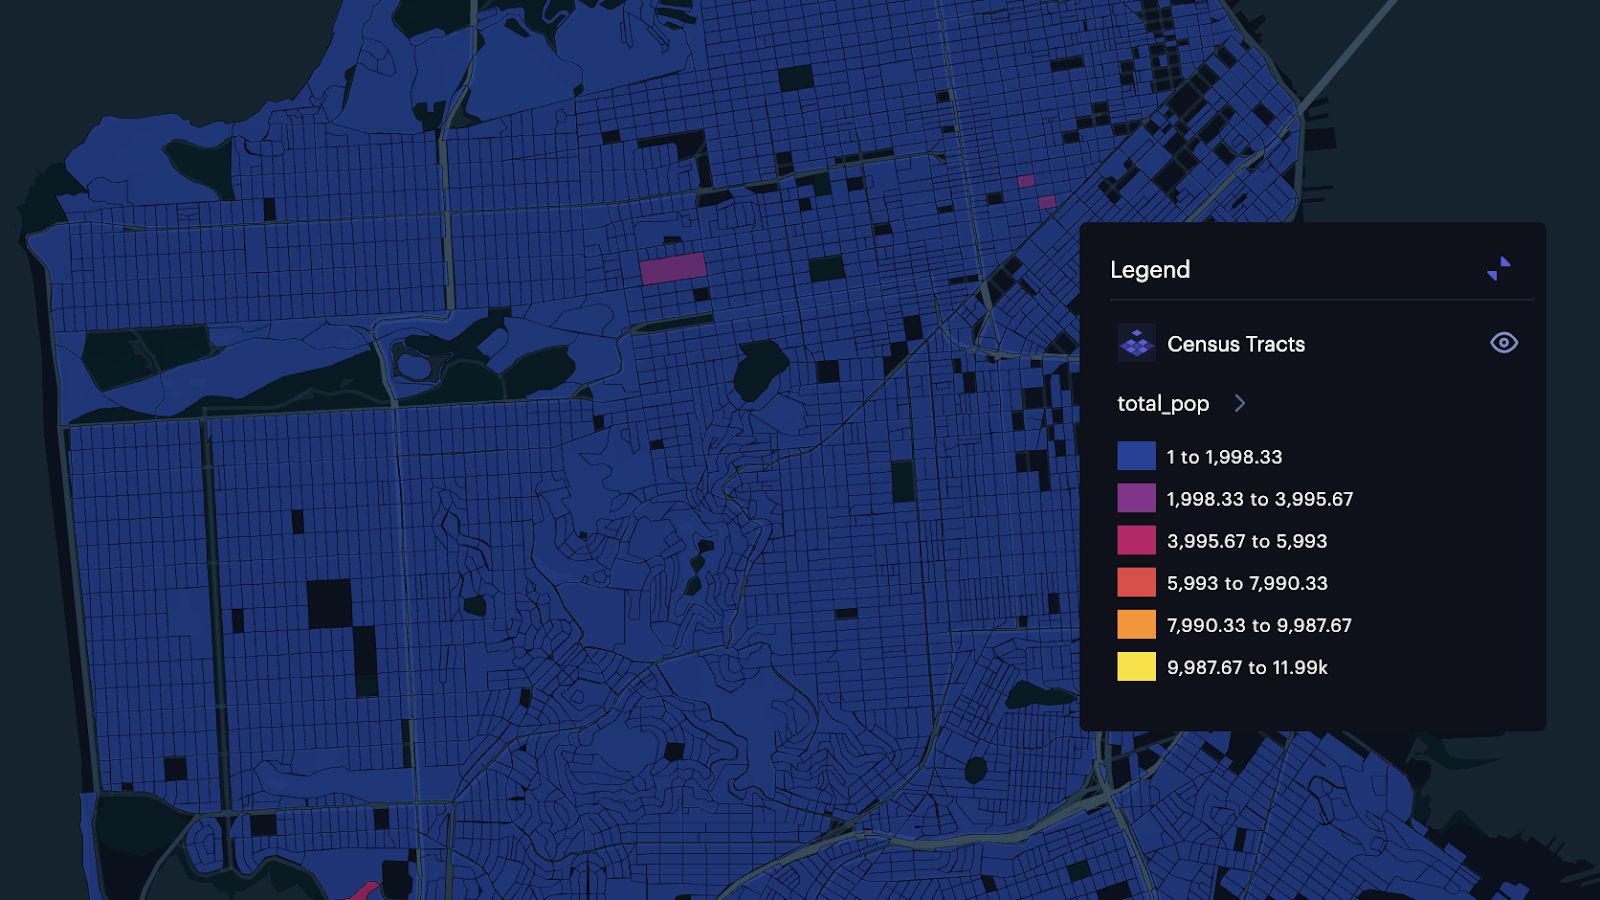
While this dataset has metadata that lists the min and max population per tract for the entire state, it is not particularly useful for seeing census tract population in San Francisco. The few tracts with outlier population counts have flattened the color scale.
Dynamic color scales avoid the need to have access to the global dataset, and they maximize visual contrast for the current view, highlighting local data variations.
Let’s revisit the above example, but with Dynamic Color Scale enabled.
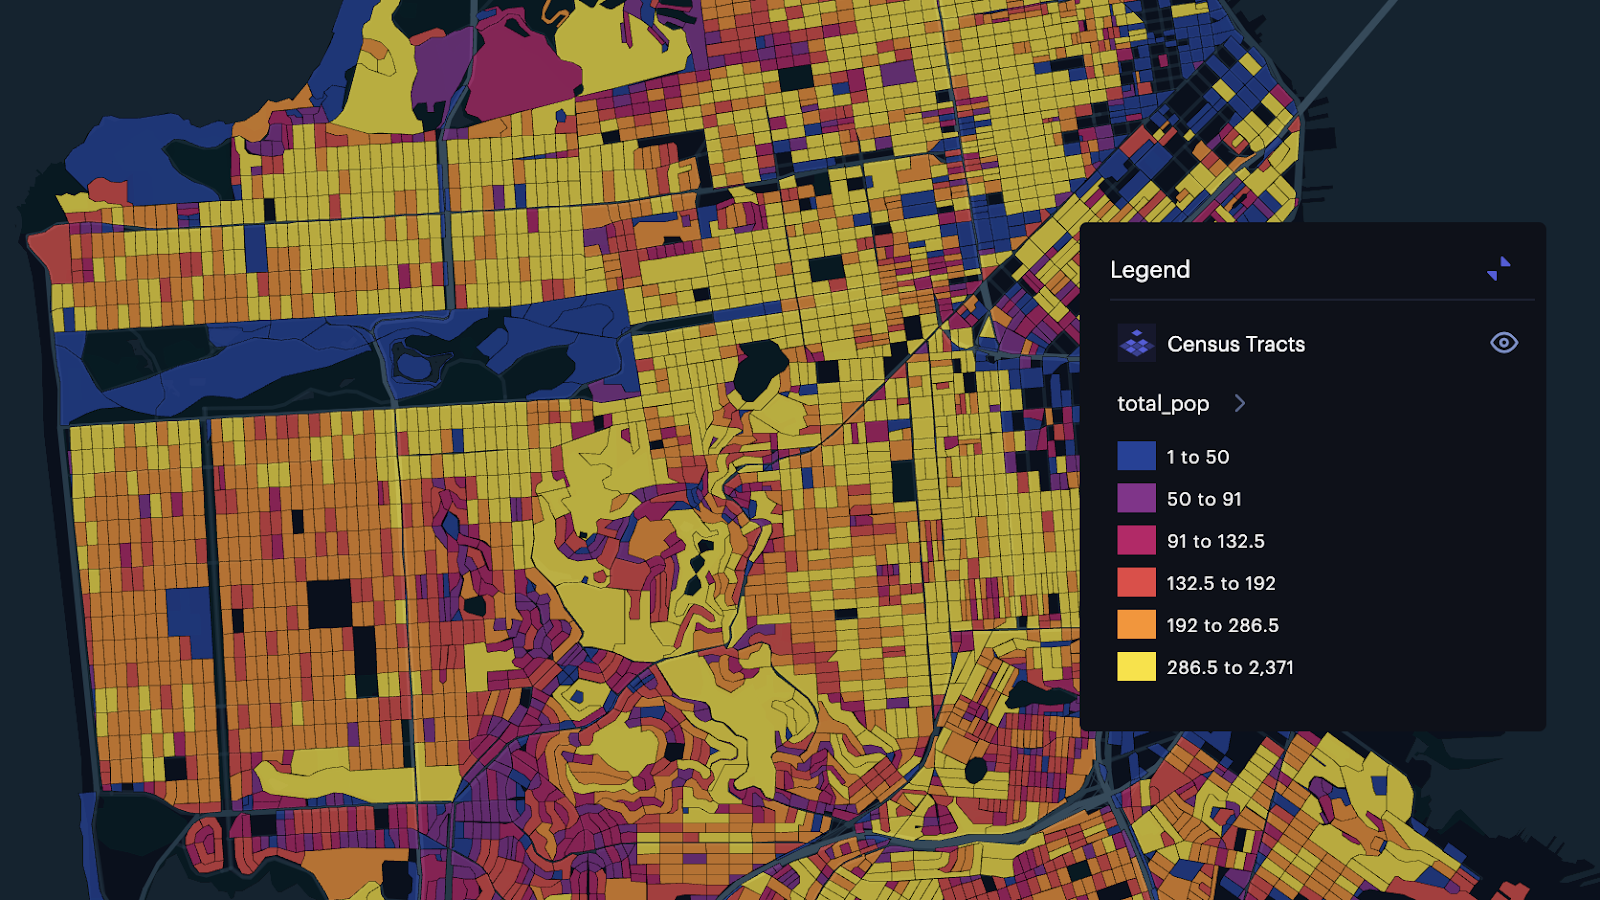
This approach does a much better job explaining population distributions throughout San Francisco’s census tracts. Even better, we did not need any metadata to produce this visualization – Studio computed the color scale by evaluating the data composition in the viewport.
Serving Vector Tiles
As for all types of datasets, generated vector tiles are served securely for private and shared maps, and via high-performance, reliable CDN for published maps.
Vector Tiling via API
Naturally, it is also possible to access the new vector tiling capability through the Studio Data API create-vector-tiles endpoint.
For Python users, the Data SDK package provides convenient bindings to process your dataset into vector tiles:
from unfolded.data_sdk import DataSDK
data_sdk = DataSDK(refresh_token='v1.ABC...')

data_sdk.generate_vectortile(
    source="[Dataset UUID]"
    target=None  # or replace with your target dataset UUID
)
Where Vector Tiles Fall Short…
Studio picks up the slack with more tiling options.
Hex Tiles
Since vector tiles dynamically load and unload data behind the scenes, Studio’s analytic features are naturally unavailable. As the prime objective of vector tiles is large-scale data visualization, the only analytic features available are related to the color scale.
Foursquare’s Hex Tiles are designed for analytic use cases. Instead of delivering lines, points, and polygons, Hex Tiles deliver data-rich hexagons on the H3 hierarchical grid system. Hex Tiles can be used alongside Studio’s analytic features, such as:
- Big number, line, and bar charts
- Custom column creation via analytic expressions
- Temporal playback
- Tile-to-tile, spatial joins
And much more. Read more about Hex Tiles.
Raster Tiles
Studio supports the other popular tiled format, Raster Tiles. Raster Tiles are designed to deliver satellite, aerial, and spectral imagery to your maps.
Learn more about Raster Tiles.
Best Tiles for the Job
While there is some crossover, we suggest the following tiling methods based on your goals and uses cases:
| Goal | Best choice | Description |
|---|---|---|
| Visual Fidelity | Vector Tiles | Vector Tiles will directly encode the vector geometries in the source dataset (though top-level tiles will simplify and sometimes join geometries to keep tile size in check). |
| Flexible and Performant Analytics | Hex Tiles | H3 / Hex Tiles are easy to join, enrich, and perform analytics on. H3 datasets are always compatible with one another. Vector Tiles are computationally harder to work with, especially if two datasets are not organized using the same geometries. |
| Aggregation | Vector Tiles | Hex Tiles require aggregation choices to be made. Data that is provided in vector format mostly does not require further aggregation, though top-level tiles may need it to control tile size. |
| Satellite, Aerial, and Spectral Analysis | Raster Tiles | Raster Tiles are the only practical choice for analyzing high-quality imagery from satellites. With a number of image presets available (fire burn, infrared, etc), single-band mode, and STAC searching, Studio offers robust support for raster tiles. |
Tradeoffs When Vector Tiling
There are other tradeoffs and decisions that the user sometimes must make to get the best results when vector tiling datasets. Refer to the Foursquare Studio documentation for more information.
Open Source
Foursquare Studio is built on a core of open core, and Foursquare is constantly adding new geospatial capabilities to our open source projects. This is a natural part of Foursquare’s commitment to promoting geospatial industry interoperability.
To that end, we have contributed our implementation of the PMTiles format support into the loaders.gl open source framework, as a first step towards extending PMTiles support to other geospatial frameworks like deck.gl and kepler.gl.
Next Steps
- Sign up for Foursquare Studio
- Try out vector tiling in Studio
- Join the Foursquare Studio community


