
Trip Layer
The Trip Layer can animate an object as it traverses space and time. Both the object's model and its path can be highly configured, allowing for detailed visualizations.
The Trip Layer can be used for a variety of use-cases, including fleet visualization.
GeoJSON Input
GeoJSON data must contain LineString in its features' geometry. LineString must contain [longitude, latitude, altitude, timestamp]. Valid timestamp formats include unix in seconds such as 1564184363 or in milliseconds such as 1564184363000.
Example GeoJSON Input
{
  "type": "FeatureCollection",
  "features": [
    {
      "type": "Feature",
      "properties": {
        "vendor": "A"
      },
      "geometry": {
        "type": "LineString",
        "coordinates": [
          [-74.20986, 40.81773, 0, 1564184363],
          [-74.20987, 40.81765, 0, 1564184396],
          [-74.20998, 40.81746, 0, 1564184409]
        ]
      }
    }
  ]
}
CSV Input
Columnar datasets (typically loaded from a CSV file) you must contain an id, latitude, longitude, timestamp column (an altitude column is optional). A path will be created by grouping the id column and sorting by the timestamp columns.
Example CSV Input
| id | latitude | longitude | timestamp |
|---|---|---|---|
| A | 40.81773 | -74.20986 | 1564184363 |
| A | 40.81765 | -74.20987 | 1564184396 |
| A | 40.81746 | -74.20998 | 1564184409 |
| B | 40.64375 | -74.33242 | 1565578213 |
| B | 40.64353 | -74.20987 | 1565578217 |
| B | 40.64222 | -74.33001 | 1565578243 |
Settings
The following sections detail every setting available in the Trip Layer.
Basic
Core settings for the Trip Layer.
| Setting | Description |
|---|---|
| Type | Must be "Trip" to use the Trip Layer. |
| Dataset | The dataset containing data for the trip layer. Either a GeoJSON dataset or a columnar dataset. |
| Columns | The columns of the selected dataset from which the Trip Layer's data is derived. Either a GeoJSON column or table columns containing IDs, coordinates, timestamps, and optional altitude data. |
Color
| Setting | Description |
|---|---|
| Color Based On | A field to be used to calculate the color of the objects' trails. If no field is selected, you may choose a color to represent object trails. |
| Color Scale | The color scale and palette of the layer. |
| Opacity | The opacity/transparency of the layer. |
Stroke Width
Stroke settings for the Trip Layer.
| Setting | Description |
|---|---|
| Stroke Width | The width of the moving objects' trails. |
| Billboard | Orients the stroke's geometry toward the viewport. |
| Stroke Based On | A field to base stroke width on. |
| Stroke Scale | The scale by which to grow strokes based on the attribute column. Choose from linear, sqrt, and log. |
Trail Length
Settings related to the trails of the moving objects.
| Setting | Description |
|---|---|
| Trail Length | The length of the moving objects' trails. |
| Fade Trail | When enabled, fade the objects' trails as time passes. |
Label Settings
Label settings for the Trip Layer. Labels appear affixed to the Trip Layer's moving objects.
| Setting | Description |
|---|---|
| Label Field | Select a field to display on the label. |
| Font Size | The size of the font to use on the label. |
| Font Color | The color of the label font. |
| Outline Width | The width of the outline in pixels. Set to 0 to disable the outline. |
| Outline Color | The color for the outline label. |
| Background Color | Toggle to enable a background color for the label. Choose a color with the color selector. |
| Text Anchor | Where, relative to the trip object, to anchor the text. Choose from start, middle, or end. |
| Alignment | How to align the text. Choose from top, middle, or bottom. |
| + Add More Labels | Add another label to the trip objects. |
3D Model Settings
The following sections reiterate the 3D models documentation, which also contains 3D model properties and settings.
| Field | Description |
|---|---|
| 3D Model | An optional 3D model displayed for each moving object. Select from our library of 3D models or select Custom, then point to a link containing a .glb or .glTF file. |
| Apply Color | Apply a color of your choice or apply the trail's color to the 3D model. |
| Size Scale | Size is scaled by a factor of 2^x where x is the slider value. |
| Roll Based On | Set the model's roll (rotation on the X-axis) by choosing a field from the dataset or set it with the slider. |
| Pitch Based On | Set the model's pitch (rotation on the Y-axis) by choosing a field from the dataset or set it with the slider. |
| Yaw Based On | Set the model's yaw (rotation on the Z-axis) by choosing a field from the dataset or set it with the slider. |
Custom 3D Models
To use your own 3D model, you can provide a link to a glTF file with either a .gltf (JSON/ASCII) or .glb (binary) extension.
If you need to render many models on the map, please consider the number of polygons of your model. A model that is too detailed (containing a high number of polygons) may result in significant slowdowns of your visualization.
Note: Cross Origin Resource Sharing (CORS) must be enabled on the remote server hosting the 3D model. This allows Studio to retrieve the 3D model for your visualization.
JSON config editor for trip layer
Programmatically control your trip layer animations in our JSON code editor, or copy the configuration and paste it in other maps.
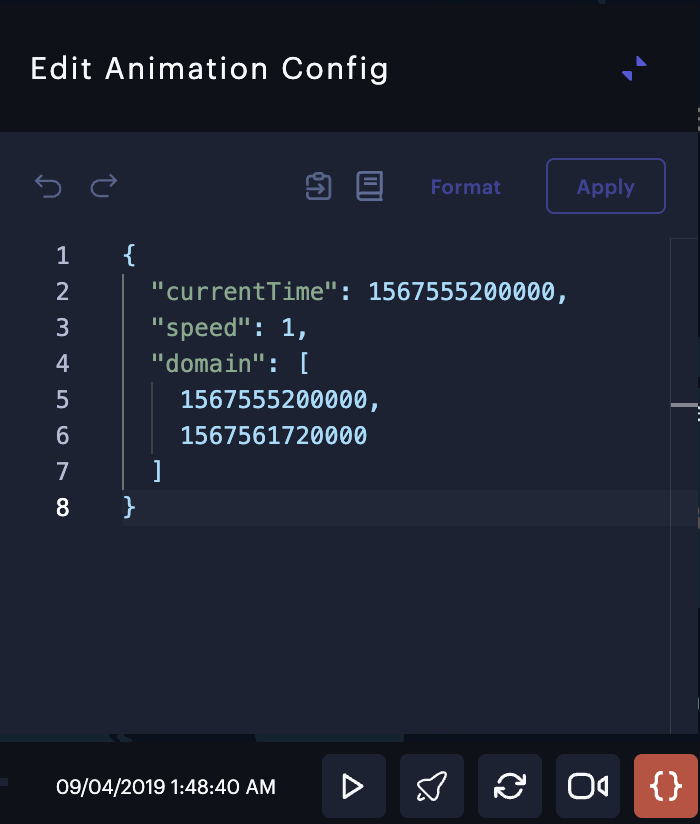
JSON config editor for trip layer
Export as Video
To export an animated map, you can use Export Video feature.
Multiple Trip Layers
Consider the following when overlaying several trip layers:
- When you add multiple trip layers, the time range from each layers is combined. The animation control will span the entire time range for each layer.
- When hiding the trip layer, its animation control can be found in the filter panel.
JSON Schema
For details on how to programmatically specify layer properties, refer to the Layer Configuration specification.
Updated about 19 hours ago