
Create a Layer
On this page, we are going to quickly create and configure a layer. This page also contains other information about layer creation
- Navigate to the Layers tab on the left sidebar.
The layer panel displays a list of all existing layers. If you created your map with a dataset, you may notice some layers have been automatically populated.
- Click the Add Layer button in the upper right corner.
- If your map contains multiple datasets, select the data source for your new layer.
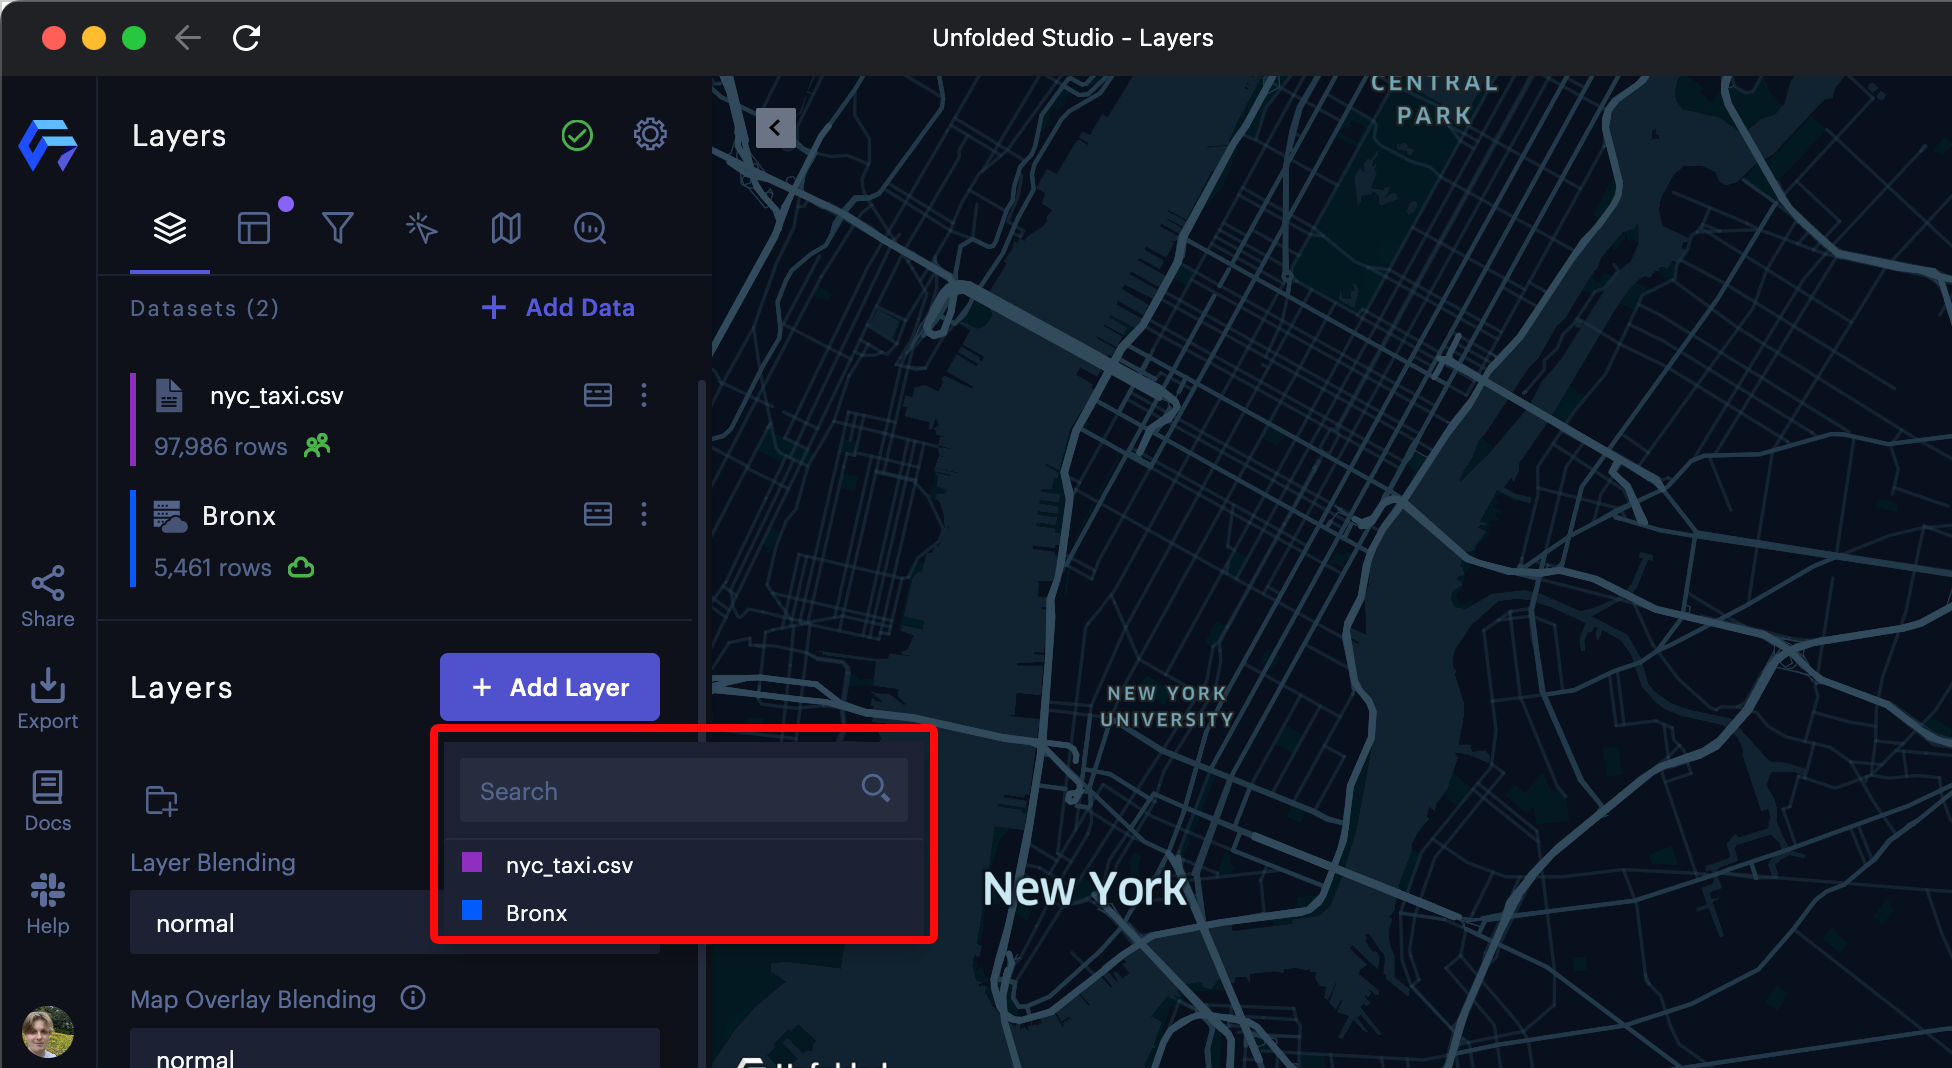
Selecting a data source for the layer
- Select a layer type.
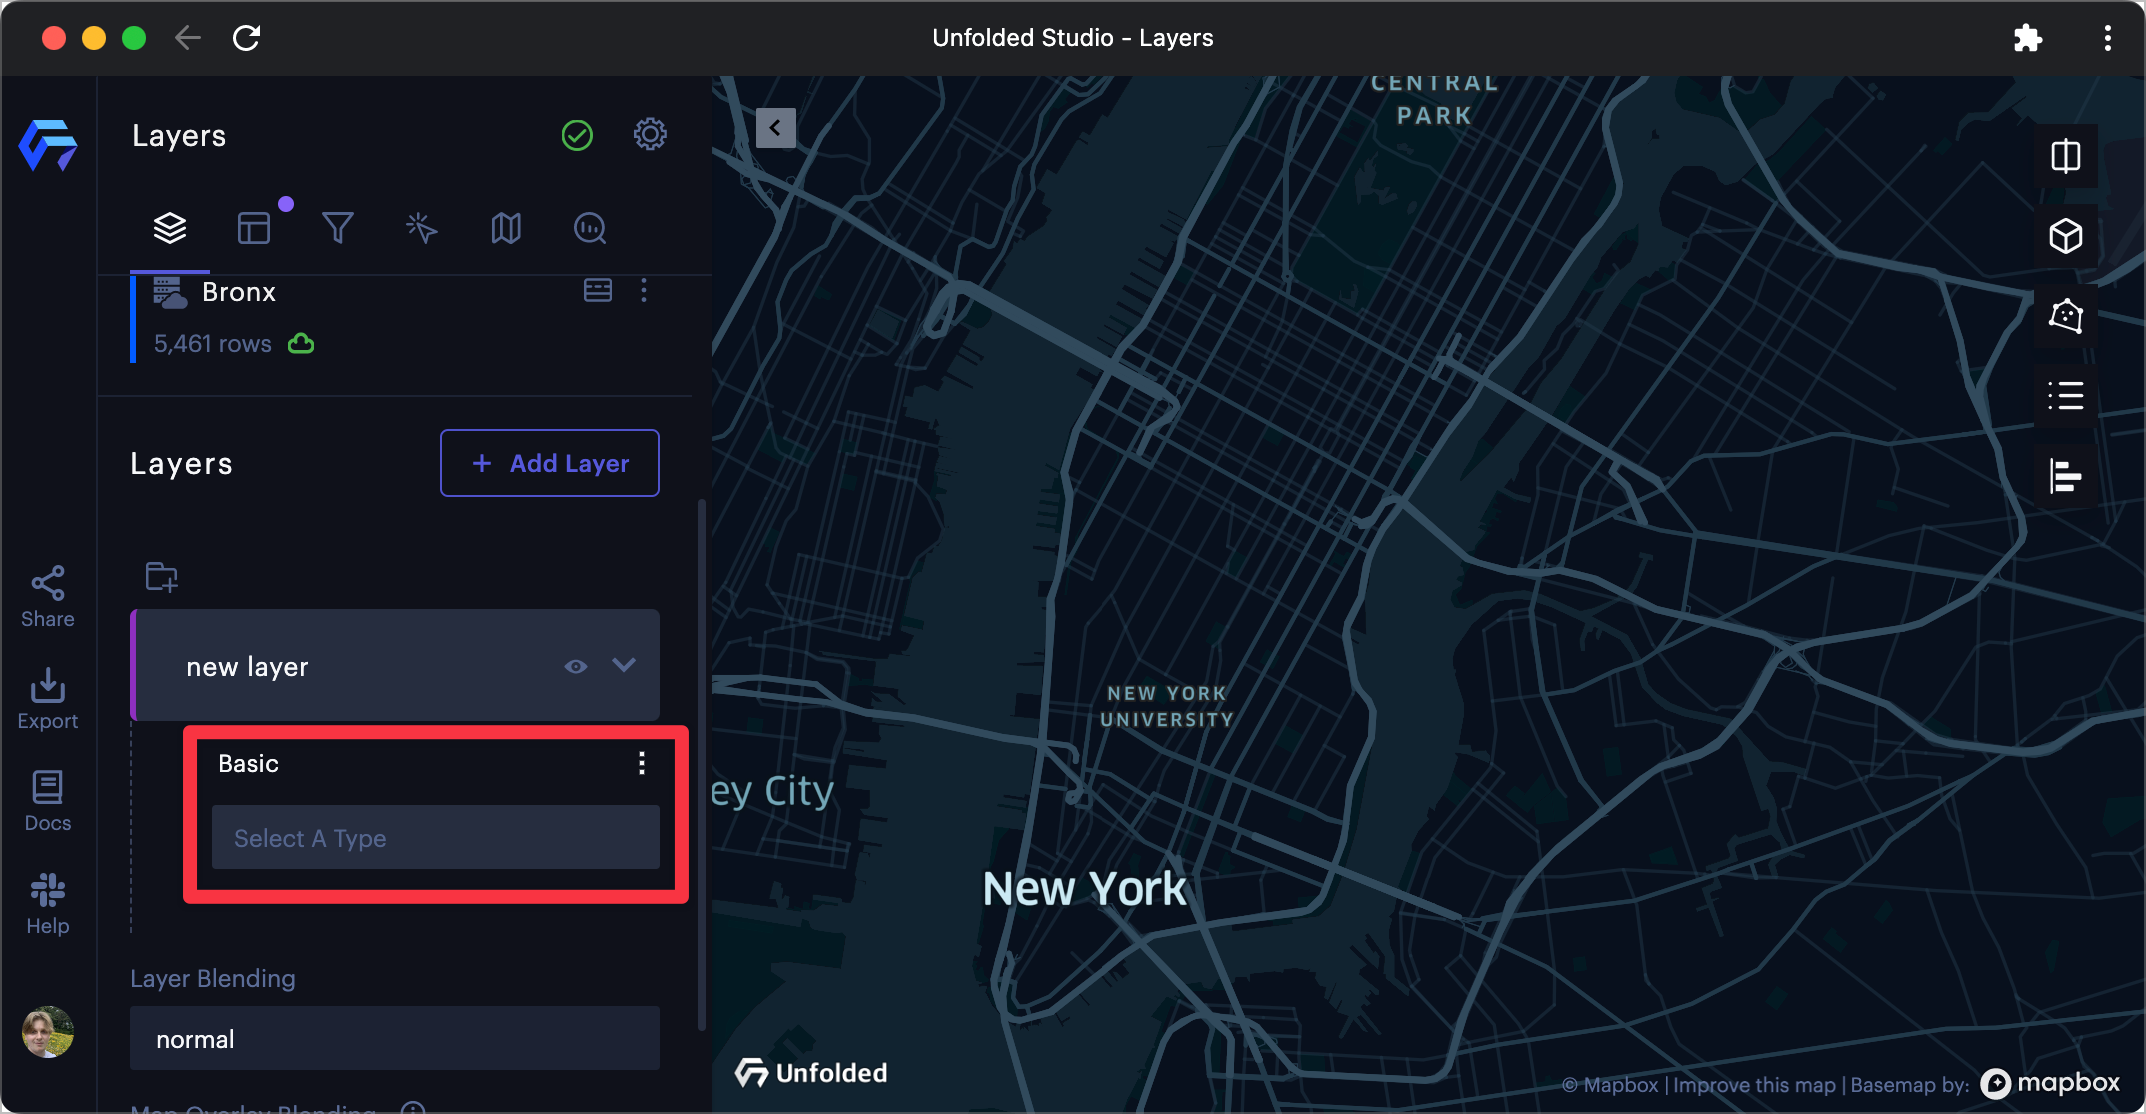
The select layer type field.
The color to the left of a layer matches the dataset the layer is representing.
- Fill in the required columns and adjust the optional settings if desired.
Studio will allows you to select any layer available on your account. Certain layers may require data not available in your dataset. If you encounter a problem with your layer, go to its dedicated documentation page to learn about every field required by the layer. You can find a list of available layers in the layer reference table.
Note: Some layers (such as the Flow Layer) may be unavailable users on free accounts.
Layer Groups
Once you start creating layers, you may want to organize them into groups.
To create a Layer Group, simply click the folder icon in the layer tab. Create a name for the Layer Group, then drag and drop any layers into the group.
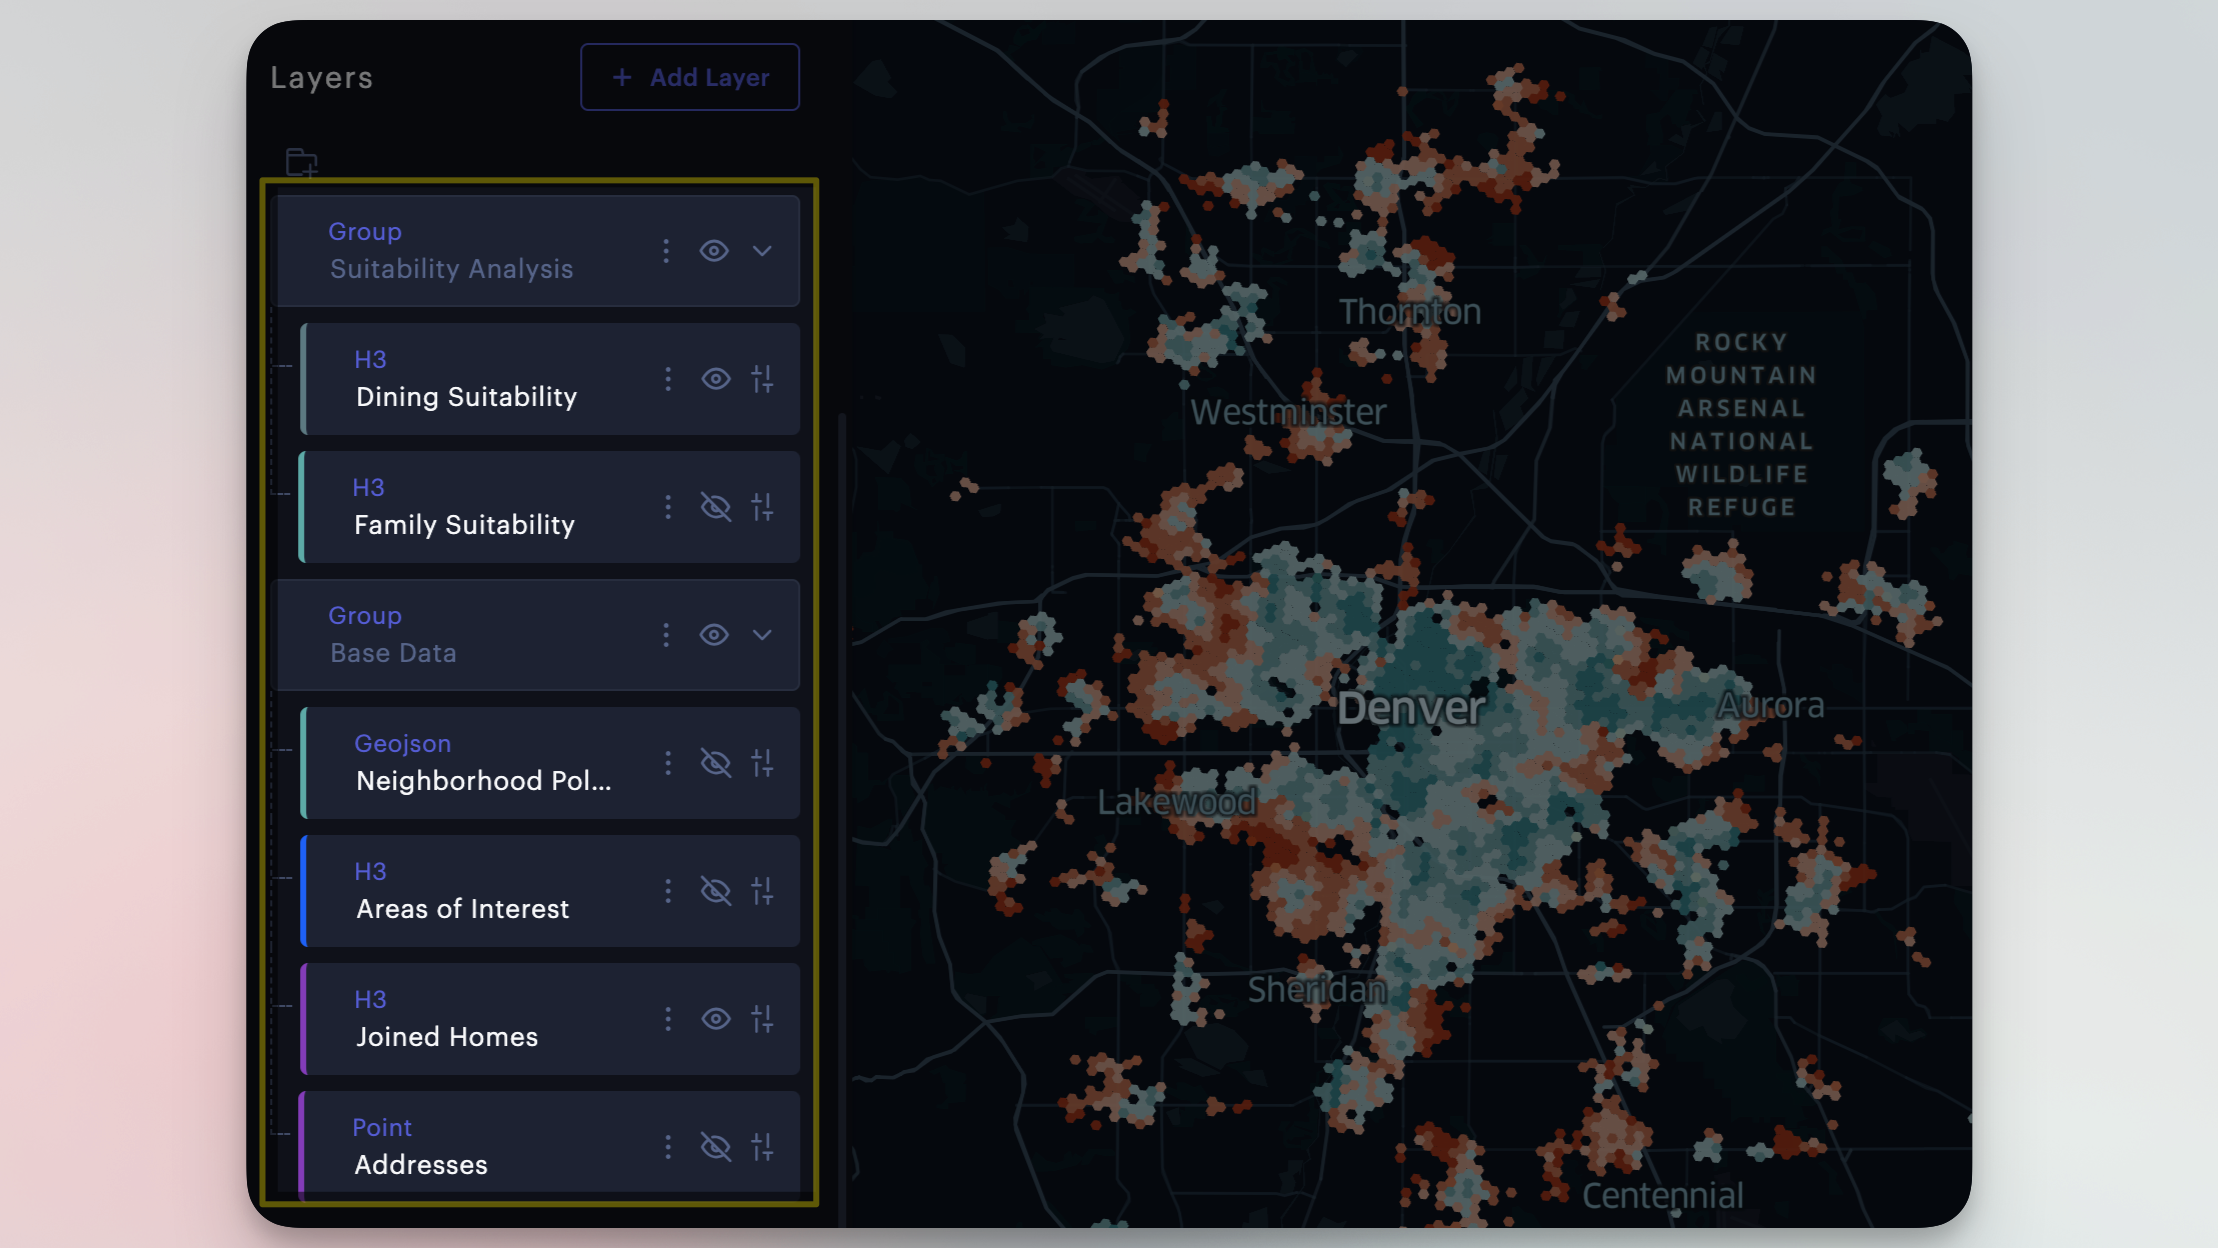
Layer group in Studio, highlighted.
Hide/display all layers in a Layer Groups by clicking the Toggle Visibility button (represented by an eye).
You can delete a Layer Group by click the trash icon. This will not delete any layers in the group.
Layer Auto Creation Based on Column Names
Studio will auto detect layers if the column names in your CSV file follow certain naming conventions. Studio creates a point layer if your CSV has columns that are named <name>_lat and <name>_lng or <name>_latitude and <name>_longitude, or <name>_lat and <name>_lon.
| layer | auto create layer from column names |
|---|---|
| Point | Point layer names have to be in pairs, and ends with <foo>lat, <foo>lng; <foo>latitude, <foo>longitude; <foo>lat, <foo>lon |
| Arc | If two points layers are detected, one arc layer will be created |
| Icon | A column named icon is present |
| H3 | A column named h3_id or hexagon_id is present |
| Polygon | A column content contains geojson data types. Acceptable formats include Well-Known Text e.g. POLYGON ((-74.158 40.835, -74.148 40.830, -74.151 40.832, -74.158 40.835)) and GeoJSON Geometry. e.g. {"type":"LineString","coordinates":[[100.0, 0.0],[101.0, 1.0]]} |
Automatic Styling for GeoJSON
Studio will read styles from the optional properties fields in GeoJSON files. If you are a GeoJSON expert, you can add style declarations to feature properties. Studio will use the declarations to automatically style your feature. The acceptable style properties are:
"properties": {
  "lineColor": [130, 154, 227],
  "lineWidth": 0.5,
  "fillColor": [255, 0, 0],
  "radius": 1 // Point
}
- See an example below:
{
  "type": "FeatureCollection",
  "features": [
    {
      "type": "Feature",
      "geometry": {
        "type": "LineString",
        "coordinates": [
          [-105.1547889, 39.9862516],
          [-105.1547167, 39.9862691]
        ]
      },
      "properties": {
        "id": "a1398a11-d1ce-421c-bf66-a456ff525de9",
        "lineColor": [130, 154, 227],
        "lineWidth": 0.1
      }
    }
  ]
}
Updated 3 months ago