
Join Hex Tiles
In Studio you can use a join operation to combine two or more Hex Tile datasets, allowing you to create new columns that draw from multiple sources. Joining Hex Tiles is a powerful way to quickly combine two datasets that would be too large or too slow in a traditional join.
Note: This page details how to join two Hex Tile datasets in a tile-to-tile join operation. To join a normal, file-based dataset to a Hex Tile dataset, visit the Enrich documentation.
Joining Hex Tiles in Studio
Ensure you have at least two Hex Tile datasets loaded on your map. If you don't have any Hex Tiles of your own, import one from our data catalog.
Follow these steps to conduct a tile-to-tile join operation in Studio:
1. Next to the Hex Tile dataset you wish to join on, click ⋮ More Options button, then click Join.
2. Select a Hex Tile dataset to join on the right.
Studio will automatically set the join type to Full Join.
3. Select/deselect any columns to include/exclude in the join operation.
Your map will be updated with a new dataset and layer visualizing the joined dataset.
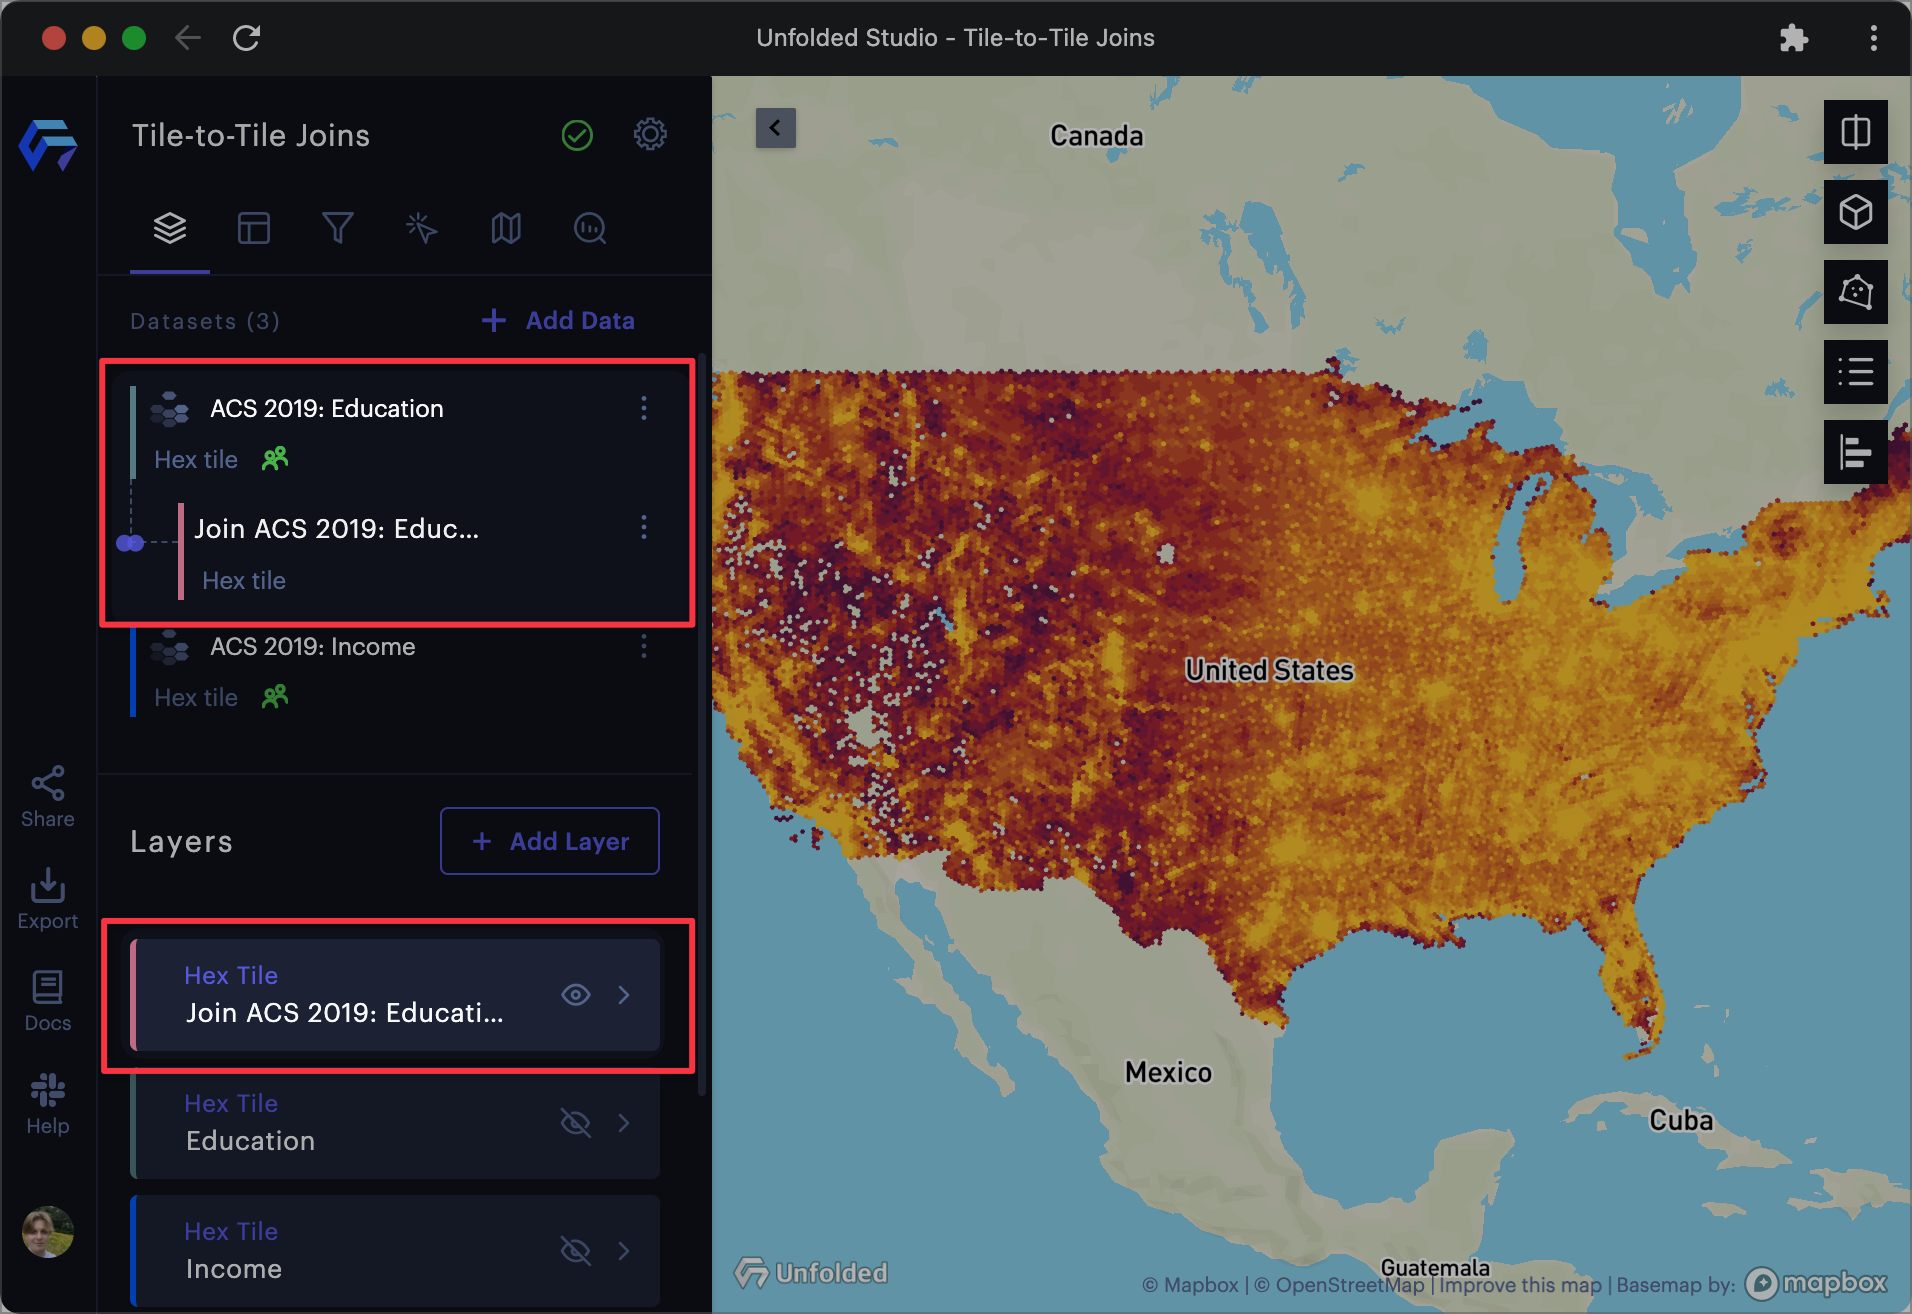
The joined dataset and its automatically generated layer in Studio.
Working with Joined Hex Tiles
With the joined Hex Tile datasets, you can now create new columns and visualizations that utilize columns from the joined dataset.
1. Navigate to the Columns tab, then click Add New Column.
2. Write an expression in the provided field, then click Update Column.
In this example, we can create an expression to calculate areas with high income but lower educational attainment.
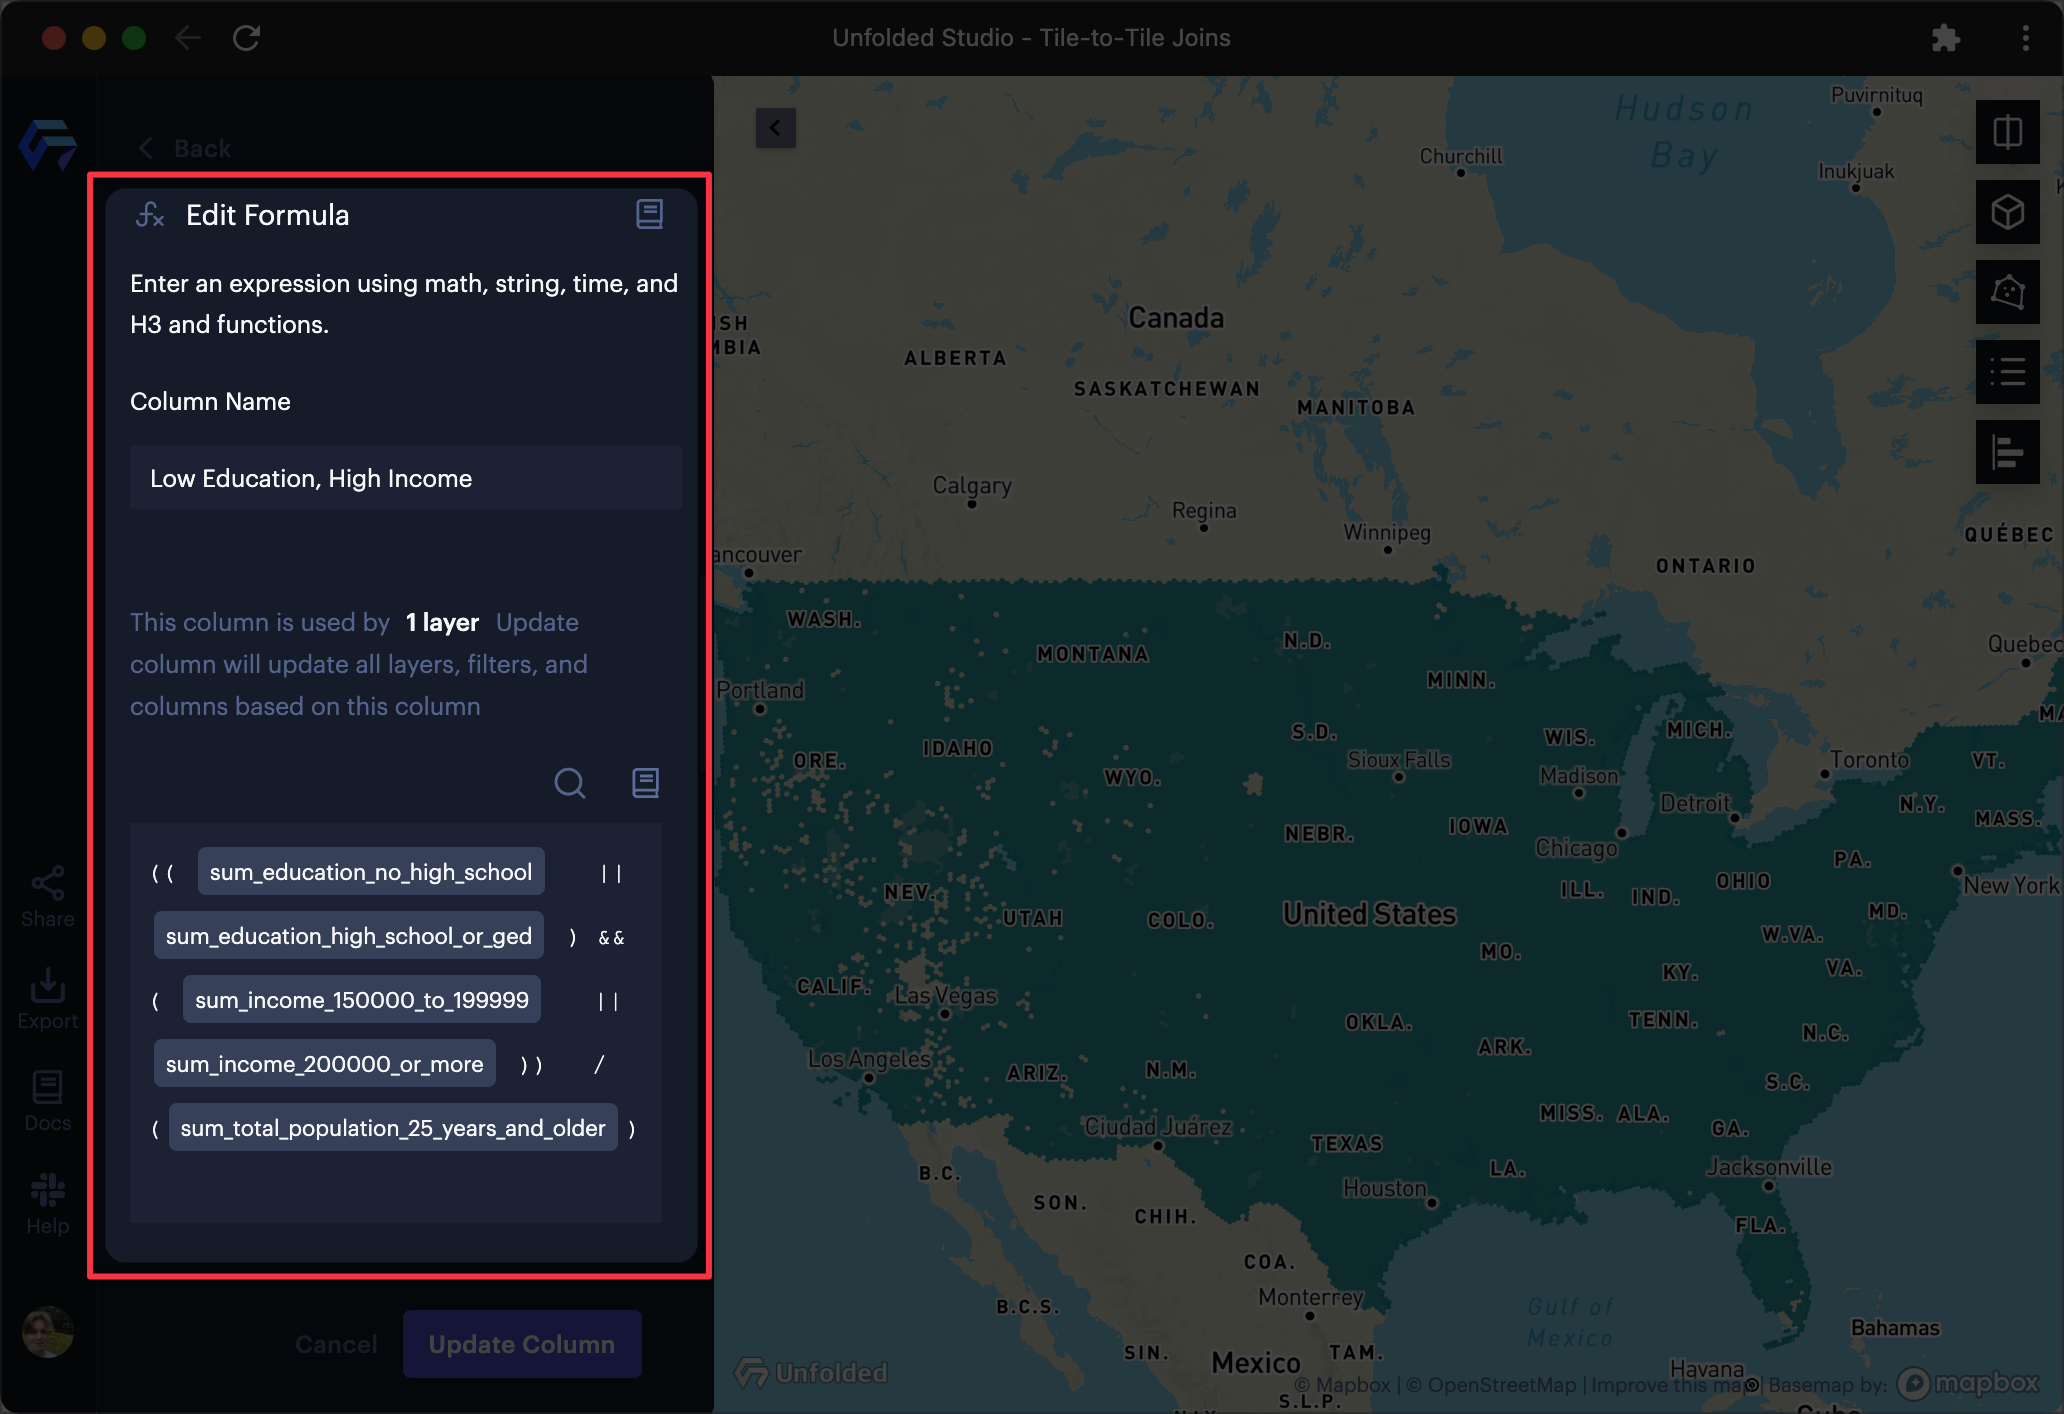
A column with expression calculating areas with high income but lower educational attainment.
The formula used above:
((sum_education_no_high_school || sum_education_high_school_or_ged) &&
(sum_income_150000_to_199999   || sum_income_200000_or_more      )) /
(sum_total_population_25_years_and_older)
The data used can be found in the data catalog:
3. Use the new column in your layer, then customize your visualization settings.
The below example contains a modified color scheme and legend.
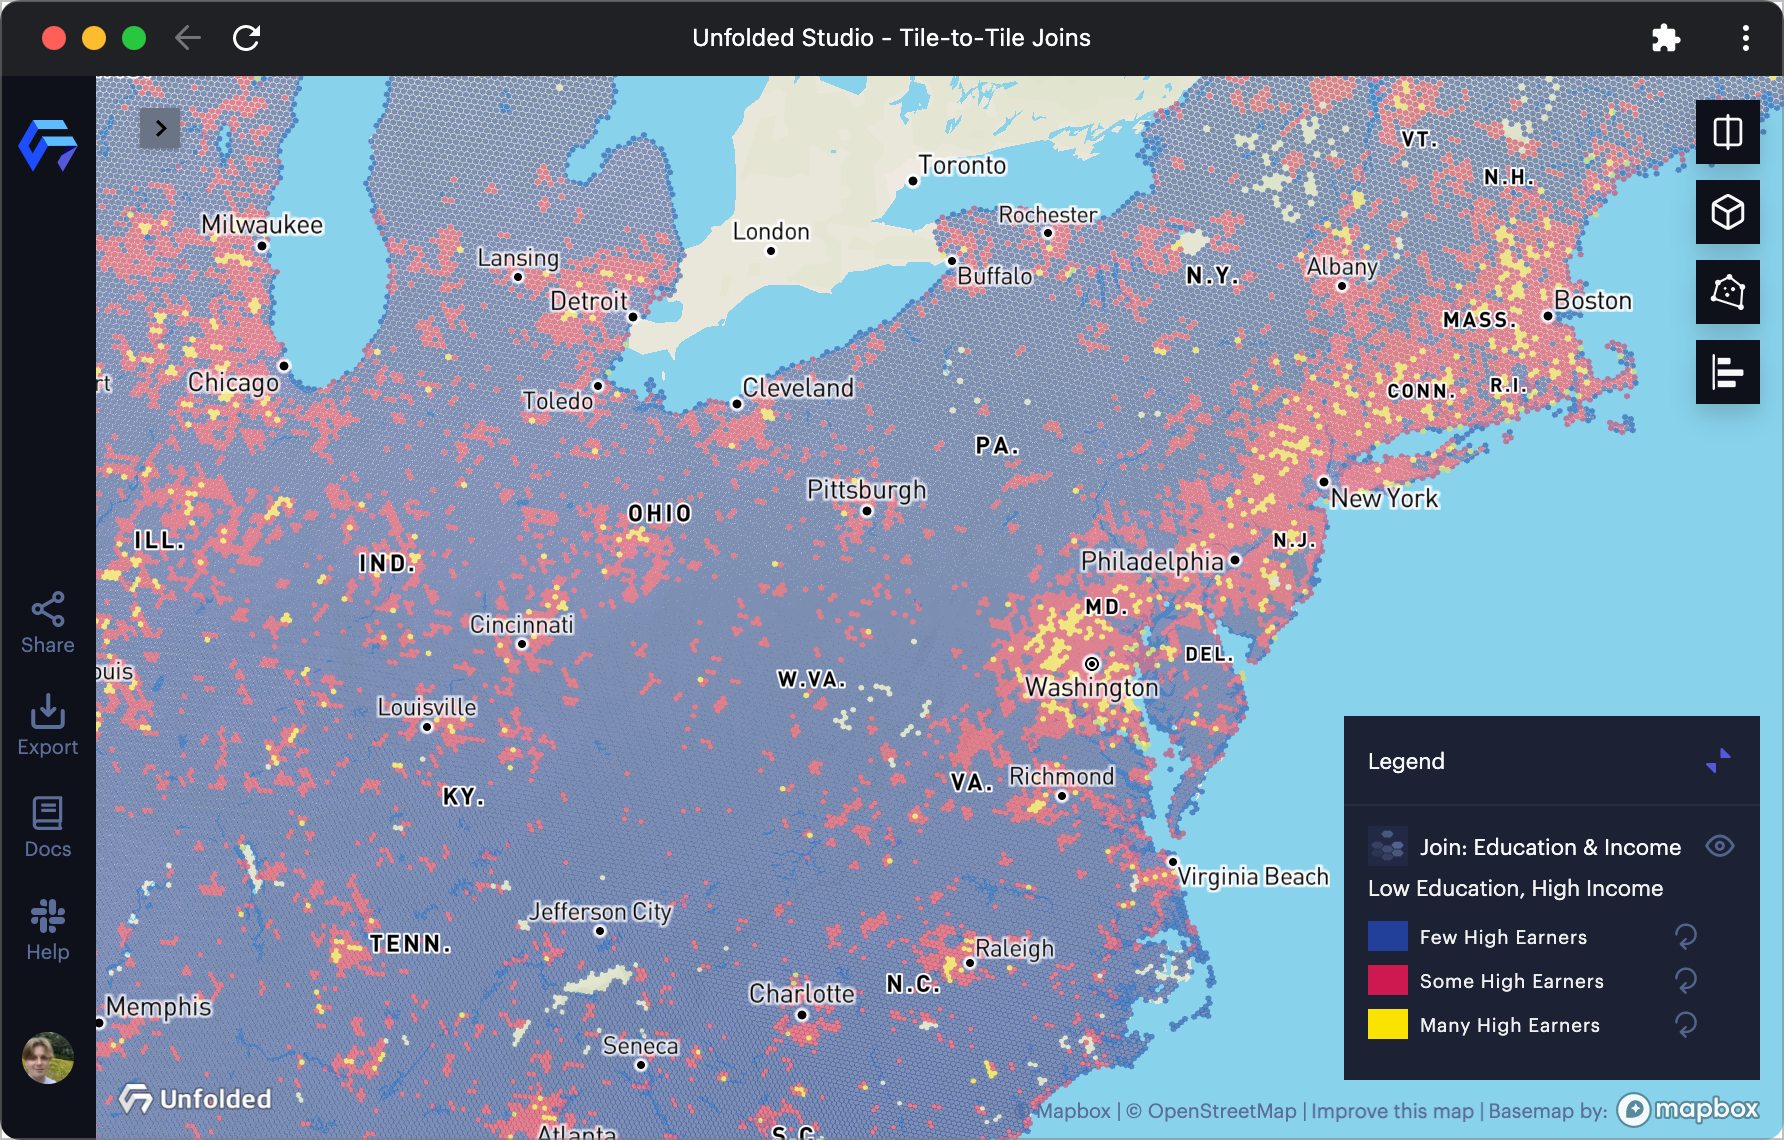
Visualizing high-earners without formal educations.
Updated over 1 year ago