When you’re involved in agriculture, environmental studies, or land-use industries, the ability to access and analyze multiple layers of surface data is an indispensable technique for making critical business decisions. Studio’s Raster Tiling system offers a comprehensive solution, empowering users with a fast, efficient, and user-friendly raster processing workflow that simplifies the task of viewing and interpreting data.
What is Raster Data?
Raster data is often obtained from remote sensors like satellites. It comprises “image” collections that encompass a multitude of light wavelengths, with each pixel housing high bit depth data that provides a wealth of information for analysis and interpretation.
Studio is equipped with the Raster Layer, a tool to explore massive, petabyte-scale image collections from your web browser.
If you are new to Raster Tiles (or are an experienced user who wants to assess Studio’s raster capabilities), the Data Catalog is the best place to start. The “Remote Sensing” section contains several invaluable resources at no cost.
| Dataset | Image | Description |
| Landsat 8 Collection 1 Level 1 | 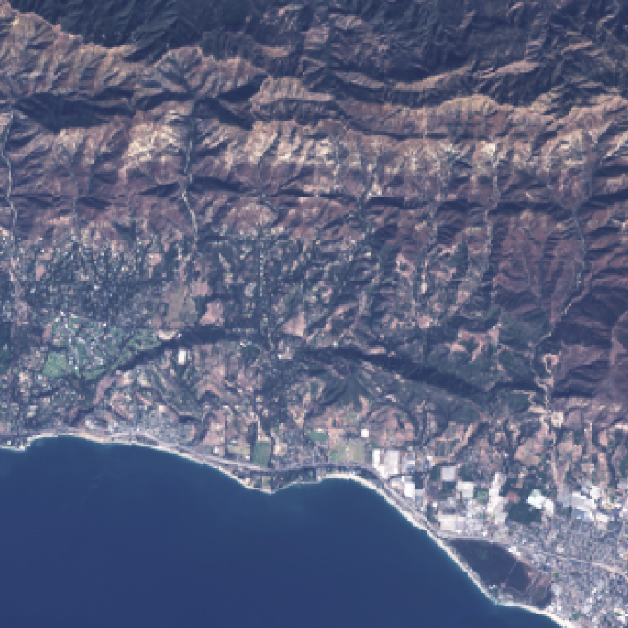 | Landsat 8 is the latest satellite in the Landsat series, launched in 2013. Its Level 1 image products contain 11 spectral bands that are processed to top-of-atmosphere reflectance. This tileset is optimal for projects that either favor or are unaffected by top-of-atmosphere reflectance, but is not suggested for projects that require accurate spectral information from features on the Earth’s surface. |
| National Agriculture Imagery Program (NAIP) | 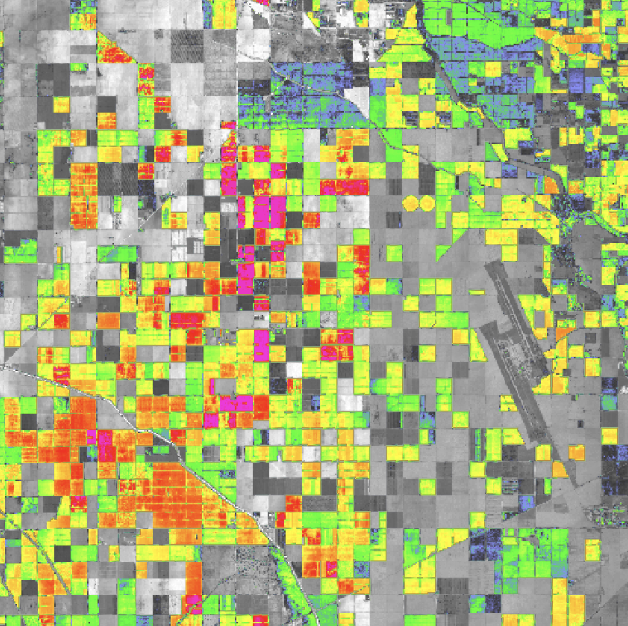 | High-resolution aerial imagery with four spectral bands (R, G, B, NIR), covering the contiguous U.S. and taken during the agricultural growing seasons. Used to maintain Common Land Unit and assist with farm programs, NAIP collects 1-meter ground sample distance imagery. Use cases include measurement assistance, government coordination, historical measurements, and disaster preparedness or response. |
| Sentinel-2 L2A | 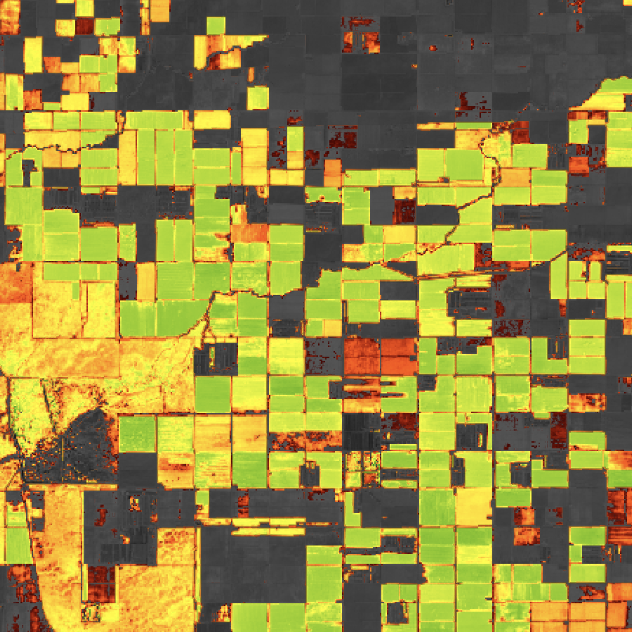 | Sentinel-2a and Sentinel-2b satellite imagery, processed to Level 2A (Surface Reflectance). This tileset is useful for projects where atmospheric correction is necessary, such as calculating changes to an area’s NDVI indicator with fertilizer use. |
| Planet NICFI | 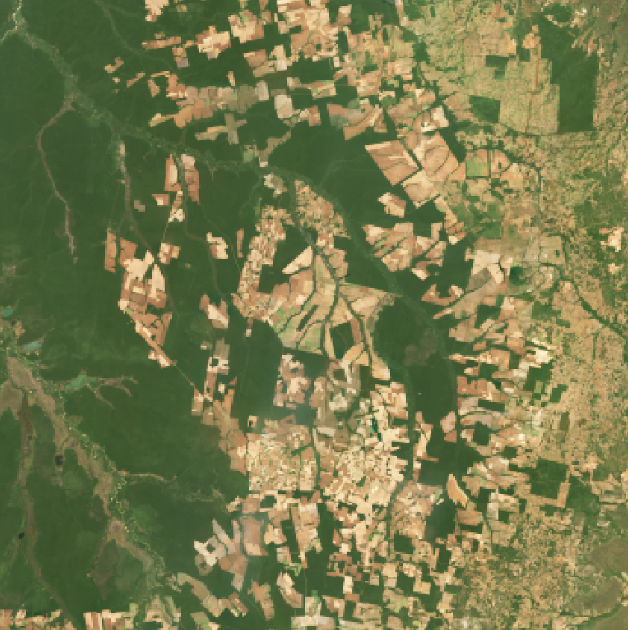 | Planet Labs is partnering with NICFI in making high-resolution, analysis-ready satellite imagery of the world’s tropics, to help reduce and reverse the loss of tropical forests, combat climate change, conserve biodiversity, and facilitate sustainable development. This tileset excels for projects that aim to measure change detection. Note that, while free for non-commercial use, Planet requires users to have an account and API key, which can be added via our data connector. |
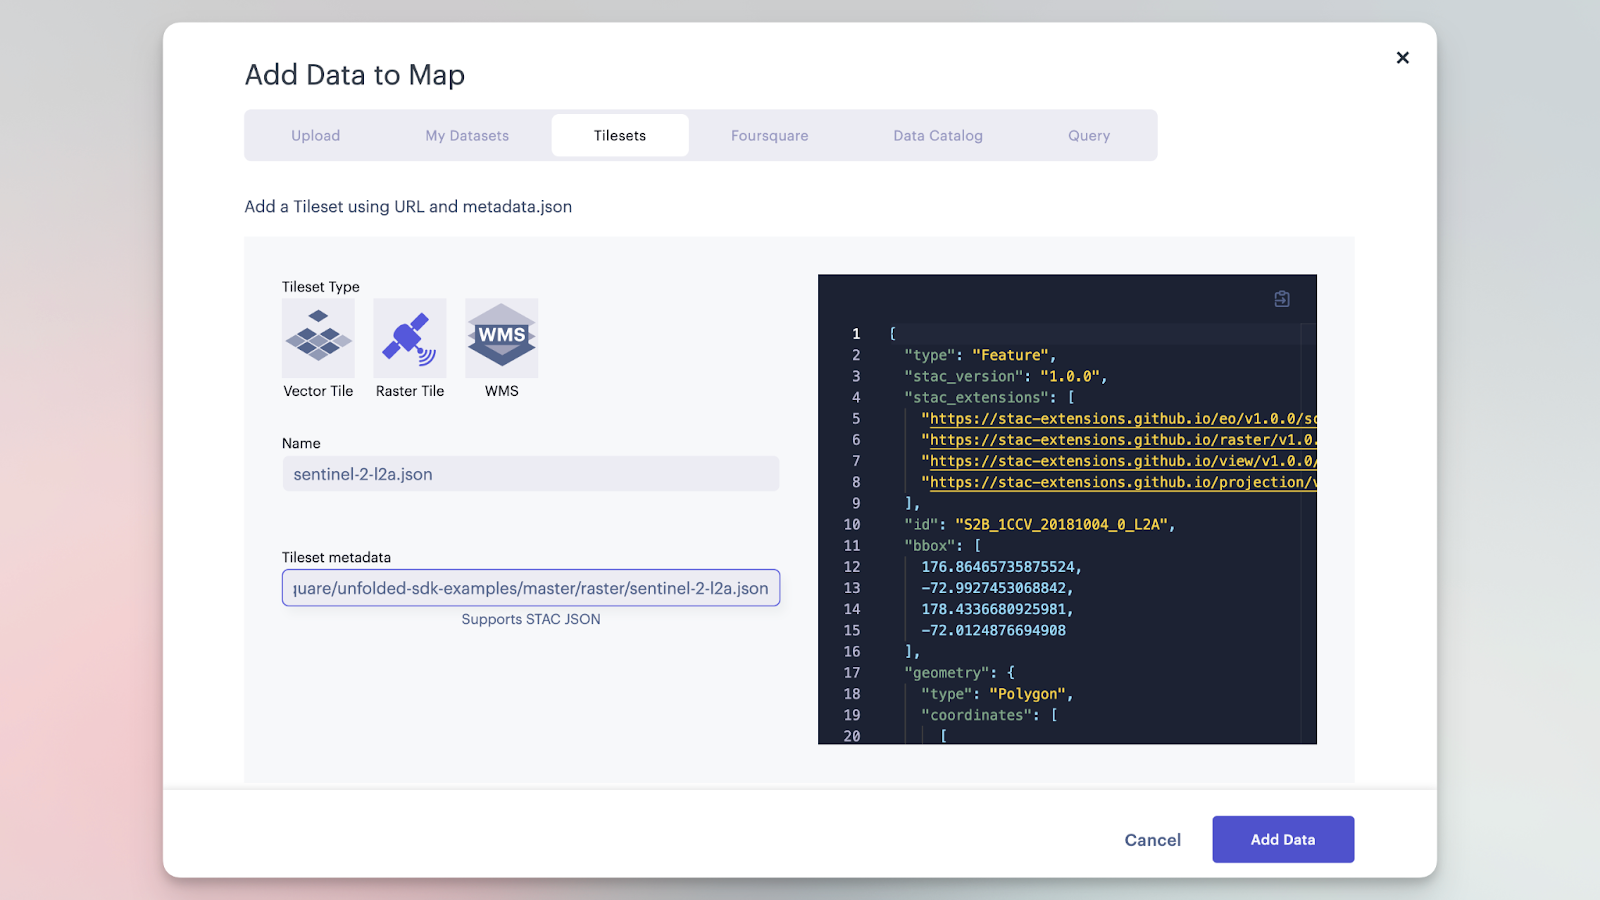
You may also reference custom Cloud-Optimized GeoTIFFs (COG) by providing standardized Spatio-Temporal Asset Catalog (STAC) metadata.
- Open Add Data to Map dialog, navigate the Tilesets tab, then select Raster Tile.
- Enter a URL to a STAC metadata file into the Tileset Metadata field then click Add Data.
Color Rescaling
When working with a Raster Layer, you might encounter limitations in visualizing specific areas of the Earth’s surface effectively. This can be attributed to factors such as image quality, the nature of the terrain being studied, and the timing and season when the image was acquired. To enhance your viewing experience, you can opt for the Dynamic Color feature, which dynamically adjusts the color scale of the map based on the data visible within the viewport, ensuring optimal visibility and clarity.
Panning the map with Dynamic Color enabled.Studio also allows for full control of color rescaling. Simply drag the color scale sliders and instantly see results in real-time.
Rescaling the colors on the Raster Layer.Spectral Bands
Satellites like Landsat-8 and Sentinel-2 have specialized sensors that capture around a dozen different wavelengths of light reflected off the Earth. These wavelengths can reveal critical data for scientific analyses.
Switching between spectral band presets available in Studio.Many remote sensing datasets also contain a near-infrared band. Near-infrared light has a wavelength that falls outside the visible range but is valuable for vegetation analyses because near-infrared light reflects off the chlorophyll in plants. Thus, areas with denser vegetation have more near-infrared light that is captured by the satellite’s image sensor. Other wavelengths can indicate geologic information, thermal energy, etc.
If you are only interested in displaying a single spectral band, Studio can do that too.
Simply choose the Single Band preset, then select the band you wish to display.
Filtering
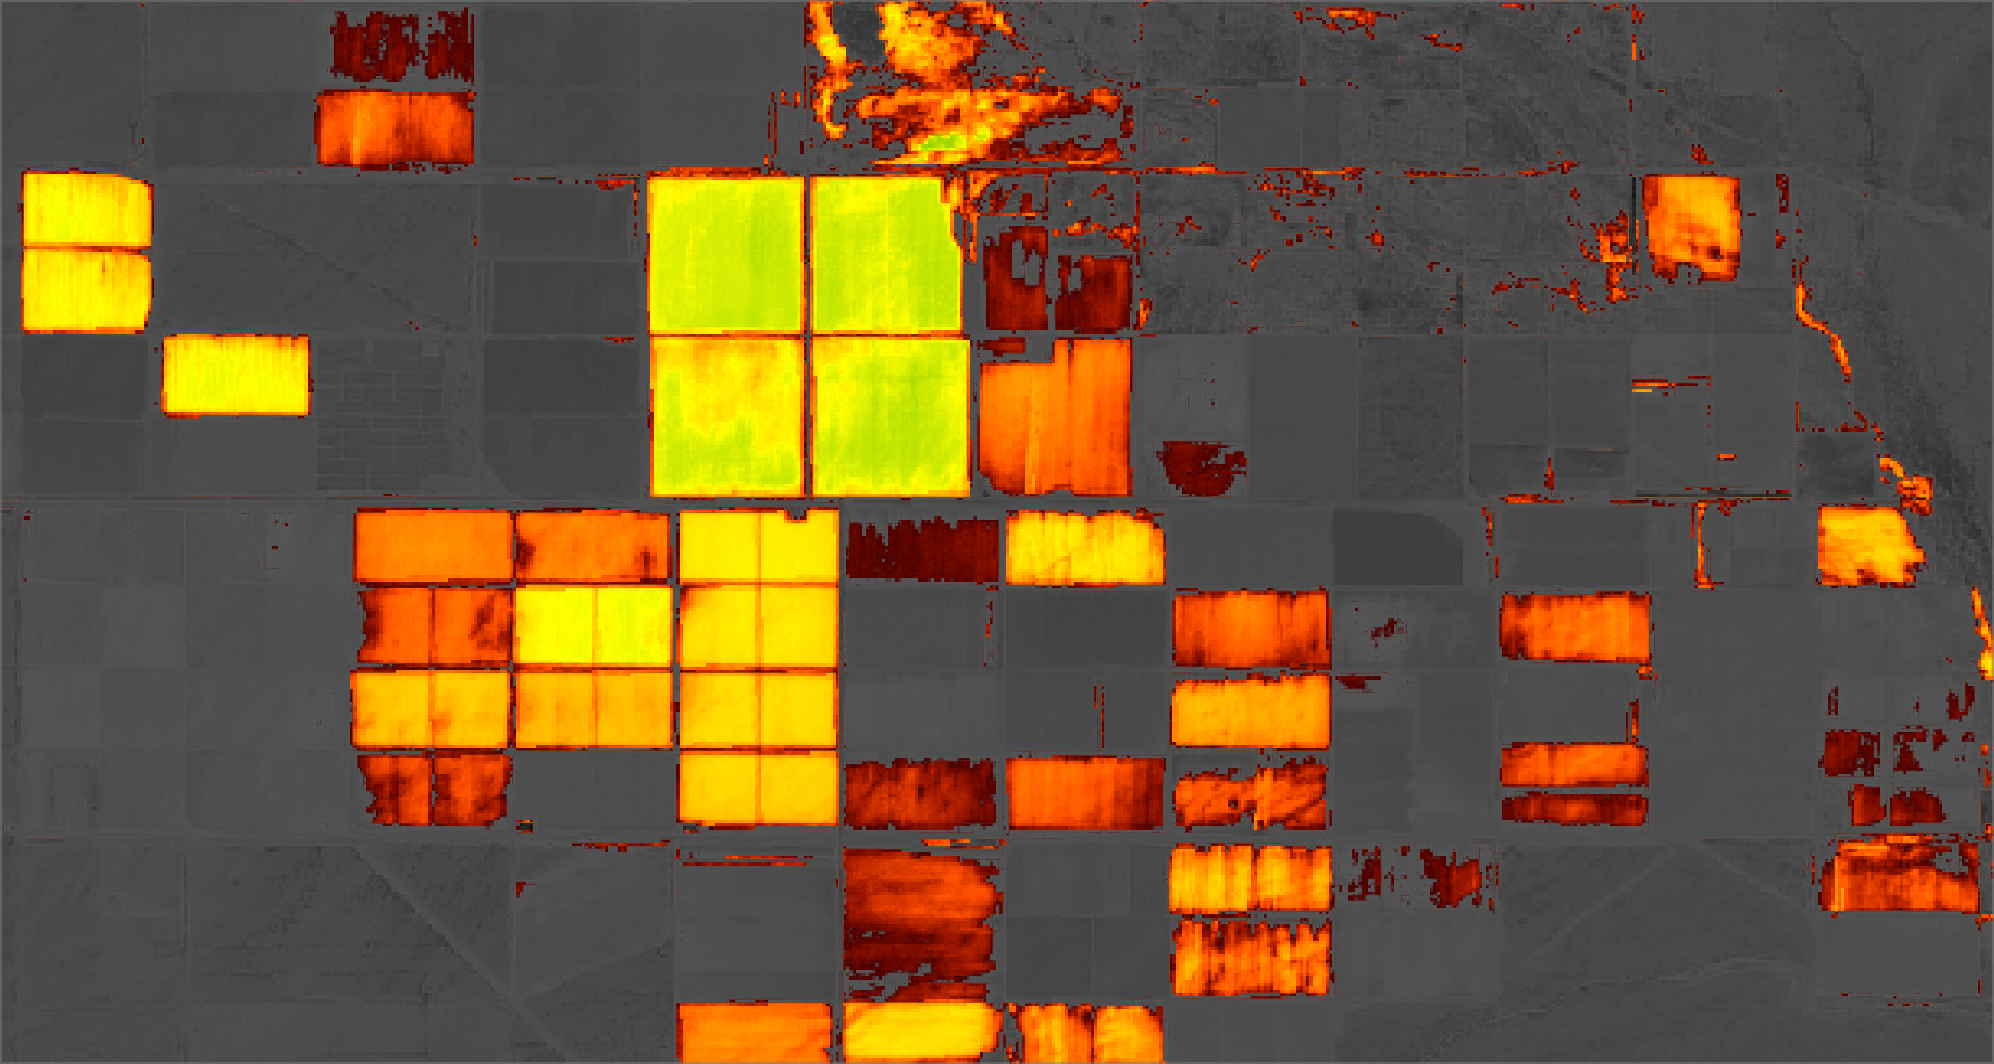
With GPU-based pixel filtering, you can hide any pixels whose index value falls outside the desired range.
This can be particularly useful for quickly identifying hot spots on the Earth’s surface. Filter vegetation indexes to only view areas with poor soil, uneven seed growth, fire-prone forest stands, and much more.
Filtering the map by NDVI, highlighting areas severely impacted by drought.Split Map Modes
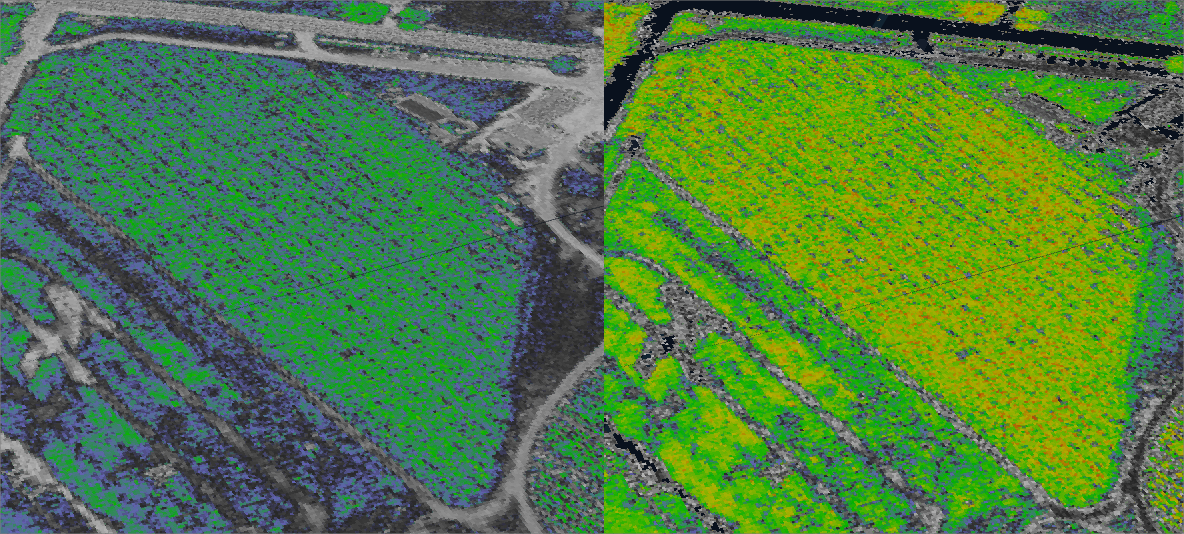
Analyzing surface data often involves drawing conclusions through comparison.
Considering the availability of both infrared and near-infrared bands, users are expected to compare two images from the same raster tileset. This is easily achieved by duplicating the layer, then using a split map mode. Dual map mode allows you to place two maps beside one another, while swipe map mode allows users to drag a sliding separator to view (often subtle) differences between the overlaid maps.
Amazon Rainforest: 2021 NDVI (left) compared to 2016 NDVI (right)Naturally, users may want to compare raster data from two entirely different tilesets, which is possible in Studio. For example, users can compare detailed elevation tilesets to vegetation tilesets, revealing how growing patterns are affected by elevation.
Raster Tiles for Agriculture
Raster data plays a critical role in agriculture, helping feed millions through data-optimized decisions. Farming and water organizations rely on remote data to understand the health of crops as they mature throughout the season, the optimal fertilizer blend for maximum biomass yield, the appropriate irrigation and rotation strategy, or the impacts of droughts, along with much more.
Disproportionate emergence, uneven heights, and other abnormalities in crop growth can stem from various factors, including differences in soil temperature, seeding depth, residue distribution, soil crusting, and more.
In cases where stunted or late-emerging crops are overshadowed by taller neighboring plants, they receive insufficient sunlight, which is crucial for optimal growth. Consequently, this uneven growth pattern ultimately leads to reduced total yield.
By utilizing Studio’s Raster Layer, we can effectively study near-infrared bands and observe the wavelengths that reflect off chlorophyll, an essential element for photosynthesis found in all plant species. When examining uneven crop growth during the initial growth cycle, a widely used index is the Modified Soil Adjusted Vegetation Index (MSAVI), which accounts for the influence of bare soil on the raster data.
Emergency Management
In the face of our rapidly evolving environment, the significance of remote sensing data has grown exponentially, particularly in the prevention and assessment of natural disasters. As an illustrative case of effective emergency management, we will delve into the Woolsey Fire, a destructive wildfire that ravaged Los Angeles and Ventura Counties in California. Originating on November 8th, 2018, the fire spread rapidly over the course of the subsequent 24 hours, only reaching full containment on November 21st, 2018.
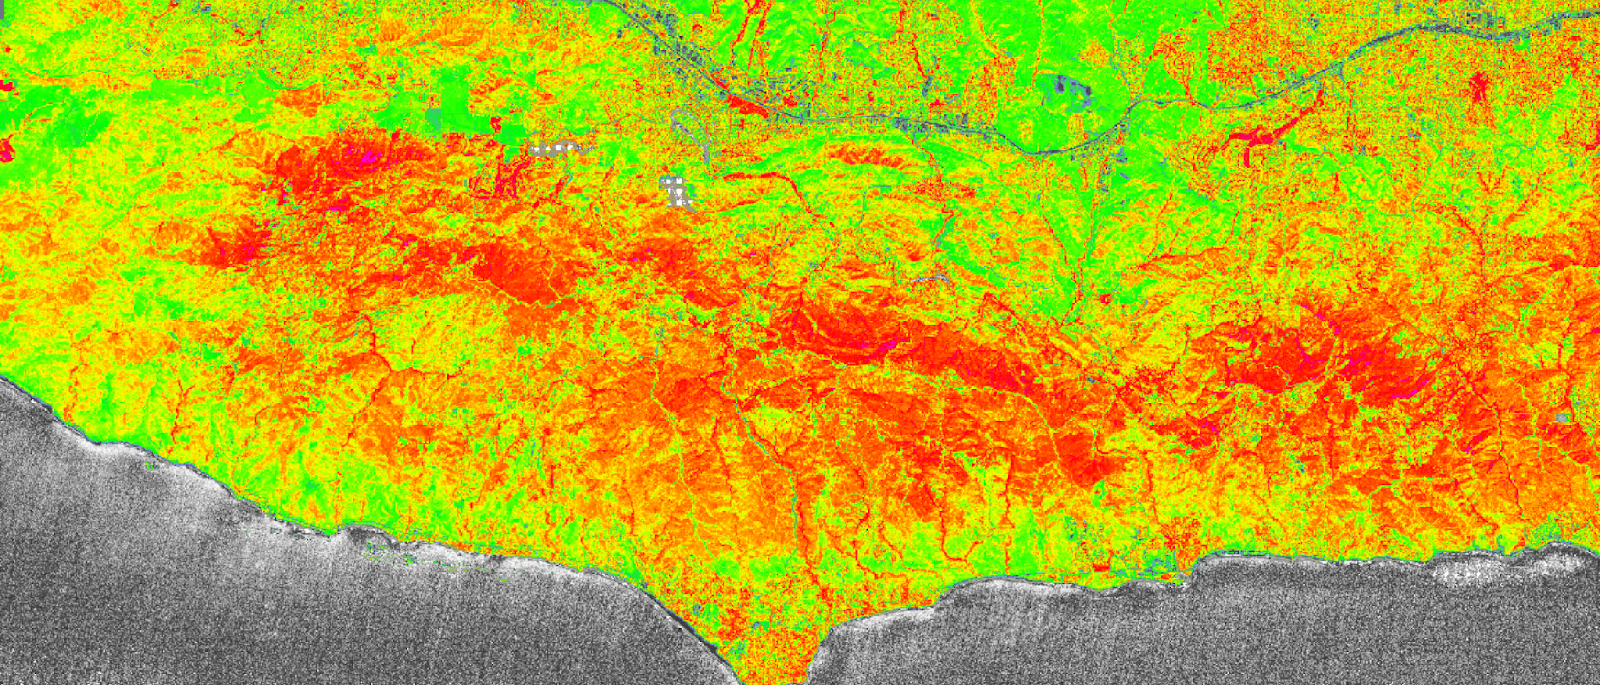
The above image was captured the week prior to the fire’s outbreak and uses an MSAVI image preset. Areas colored orange, red, and pink indicate flora experiencing extreme drought. Prior studies have determined that, due to the presence of open soil, MSAVI prevents the vegetation spectral signature from being distorted by background soil reflectance, a common effect in chaparral-covered regions (Del-Toro-Guerrero et. al, 2022).
Studio’s Raster Tiles come equipped with a forest burn preset — a false-color forest burn composite consisting of short-wave infrared 2, near-infrared, and blue mapped to RGB. The below image was captured during the second day of the fire.
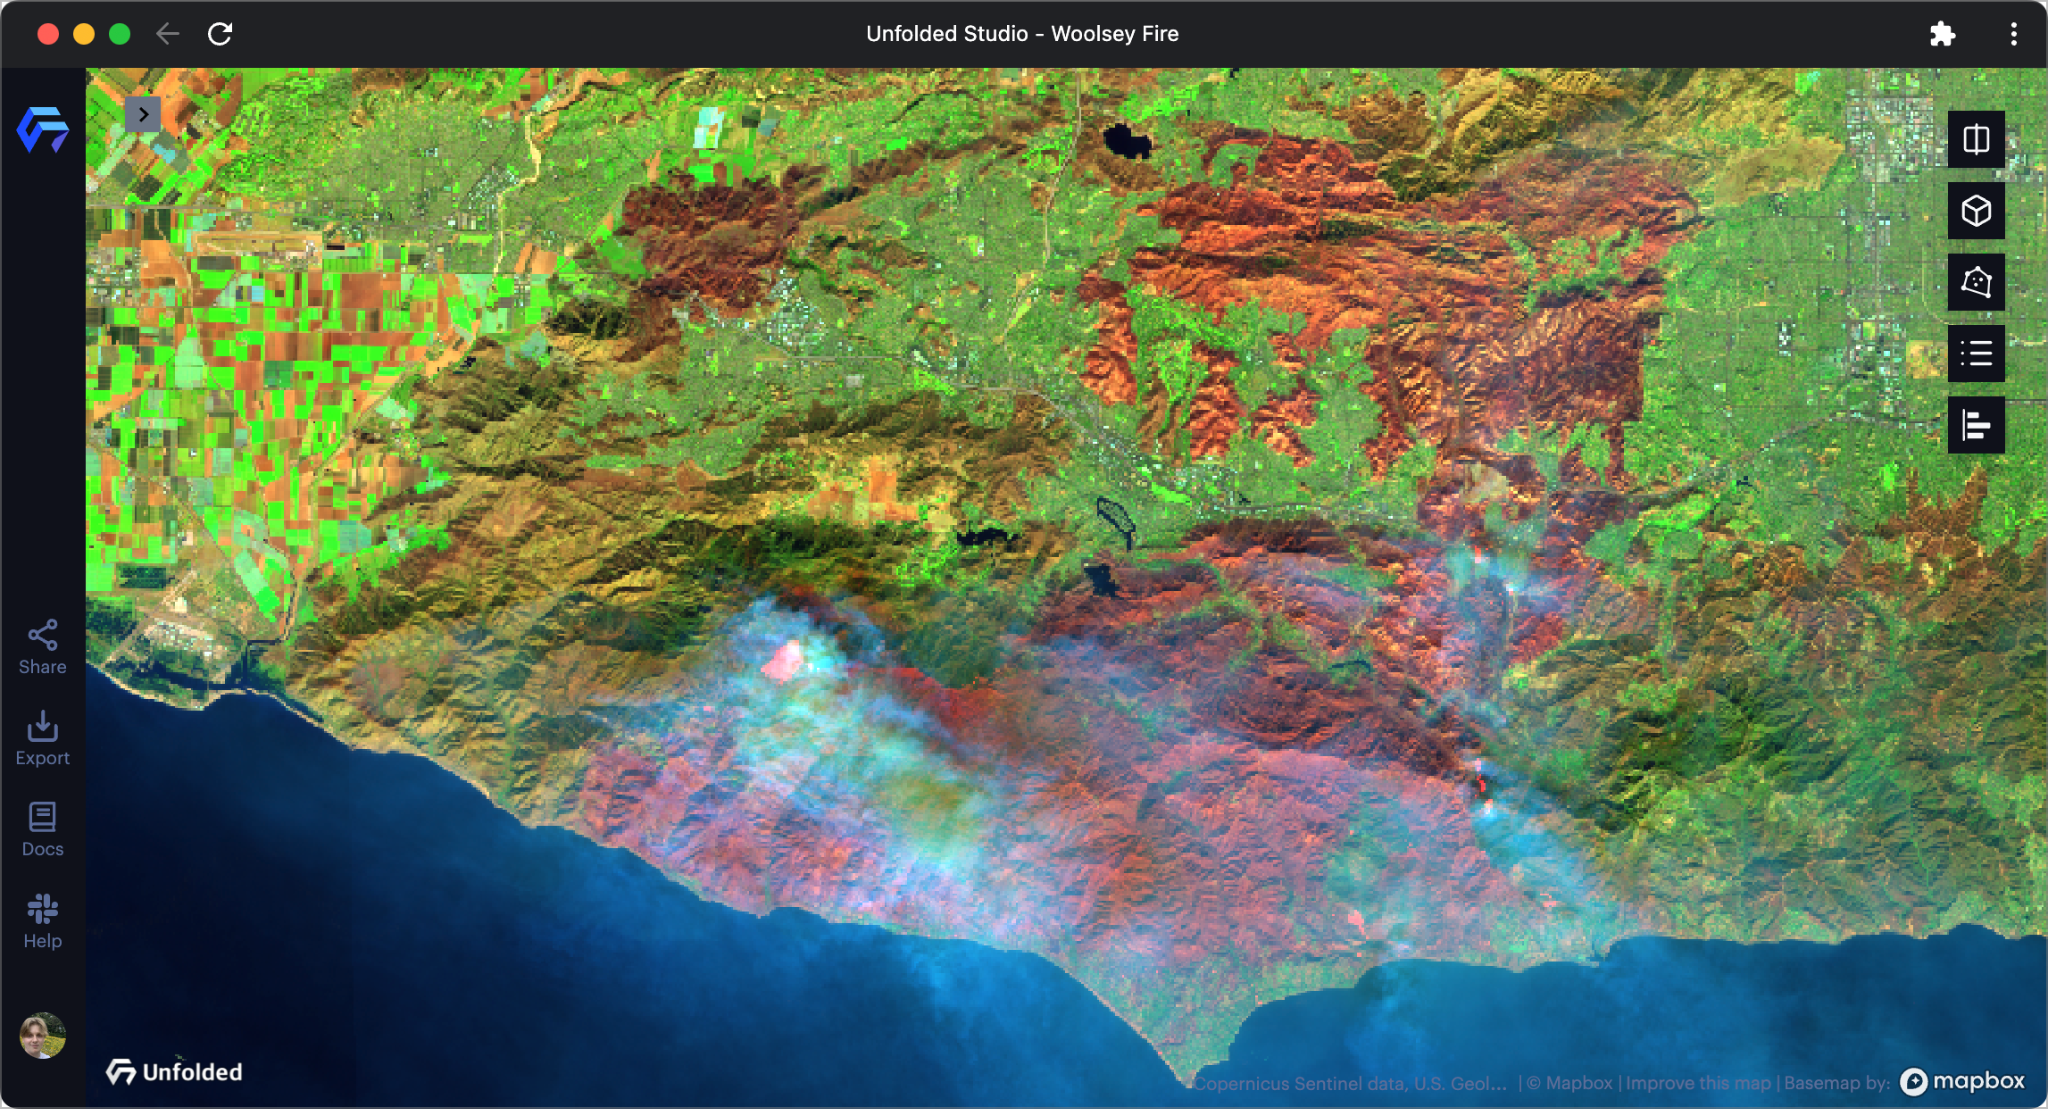
Observant viewers will readily spot the existence of smoke enveloping the scene. Despite our best efforts to adjust the color scaling of the Raster Tiles, the composite image associated with this preset remains excessively obscured by the pervasive smoke cover, making it challenging to discern any active fires represented by bright-red patches.
With the NBR2 preset, the burn area becomes distinctly visible, effortlessly cutting through both smoke and cloud cover. By utilizing available post-fire data, we can create additional Raster Layers for comparative purposes. The following example showcases the recovery process following the fire, spanning approximately two months.
It is clear that the pace of recovery varies across different areas. The reasons for the swift recovery in some regions can be easily discerned, such as the removal of charred fauna and ashes in urban or adjacent areas. However, certain areas, particularly those located in the center of the mountain range, appear to be facing challenges in their restoration efforts.
Embedded Example
Explore the embedded example below. This map was created entirely with free data available on the Data Catalog.
More Information
The above use case examples were completely constructed in Studio using no-cost data available via our growing Data Catalog.
However, a variety of tools were employed that you may be curious about. Below are a number of links to documentation pages that go over these powerful, yet easy-to-use tools.


