Whether on land or in the air, fleet visualization is the practice of studying and replaying the movement patterns of entire fleets. It is a powerful analytic tool, allowing viewers to accurately identify congestion, understand incidents, and optimize overall fleet efficiency.
The mobility, transportation, and logistics sectors are witnessing a surge in data analysis to better track the movement of various entities over time at pinpoint accuracy, spanning multiple positions. For such collections of moving entities (such as cars, people, and airplanes), it is highly valuable to study what happens during that movement — not just at the start and end points.
In Foursquare Studio, animated fleet visualization is best achieved through the Trip Layer.
With the Trip Layer, 3D models gracefully traverse maps thanks to several techniques applied to them, such as:
- Position Interpolation: A technique that continuously interpolates a vehicle’s location between known positions. This feature eliminates the choppy behavior that occurs when vehicles “jump” between known positions.
- Direction Inference: A technique that automatically calculates the orientation of the vehicle based on available data. While the Trips Layer allows direction to be controlled by the dataset, datasets with only intermediate positions will automatically have the vehicle’s direction calculated and displayed.
- Elevation: The altitude of Airplanes, VTOLs, drones, and even birds can be visualized if the dataset contains a z coordinate.
Let’s jump into some real world examples.
Aircraft Fleets
Fleet visualization plays a pivotal role in the aviation industry, serving multiple purposes that contribute to the efficient management of aircraft fleets. One key area is resource allocation, where flight schedules, routes, and distribution of resources are optimized. By utilizing fleet visualization, airlines ensure that aircraft and crew are deployed effectively, leading to cost savings and improved customer satisfaction.
Another crucial aspect is operational efficiency. Through real-time data analysis, fleet visualization enables the identification of bottlenecks and inefficiencies during operations. Airlines can pinpoint delays, optimize ground operations, and reduce fuel waste.
Fleet Visualization also plays an important role in addressing the safety and security of the aircraft and its passengers. By continuously monitoring the position and movement of aircrafts in flight, fleet managers can identify potential safety risks and detect abnormal behavior. This real-time awareness enables proactive measures to be taken, such as rerouting aircraft to avoid adverse weather conditions or promptly responding to emergencies. Fleet visualization technology enhances safety protocols and minimizes the occurrence of incidents or accidents.
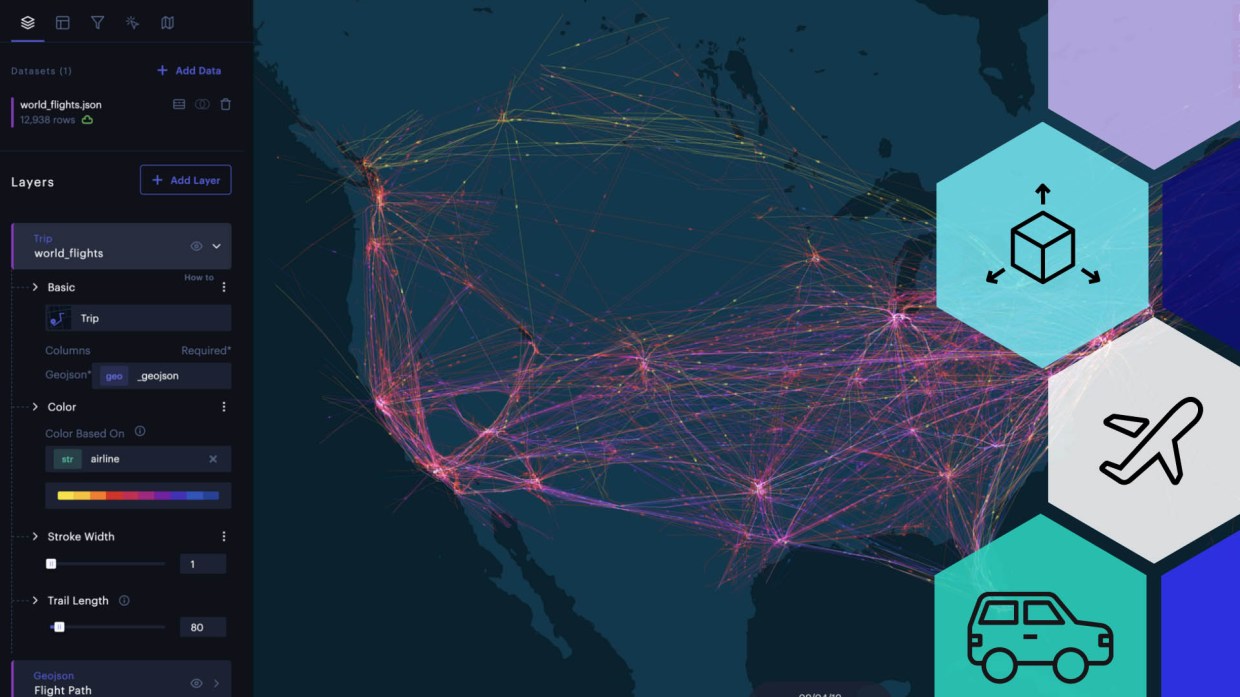
Offering a library of 3D models, the Trip Layer is built to provide context to maps. The following example showing two hours of worldwide flights blends the Trip Layer with a custom air traffic control map.
This visualization uses a simple CSV table containing rows with latitude and longitude positions, time stamps, and flight icao24 codes (a unique 24-bit aircraft identifier used as the vehicle ID).
Excerpt from the dataset used in the above example:
| icao24 | lat | lon | timestamp | remarks |
| 39840f | 42.0846 | 11.5085 | 1567555680 | Origin |
| 39840f | … | … | … | Time stamps & coordinates during flight |
| 39840f | 48.9928 | 2.5645 | 1567559880 | Destination |
| 39840e | 48.1327 | 2.3195 | 1567555200 | Origin |
| 39840e | … | … | … | Time stamps & coordinates during flight |
| 39840e | 42.0914 | 2.985 | 1567557960 | Destination |
Rideshare/Courier Fleets
Studio also offers a powerful environment for those wishing to study rideshare activity. Studio can be applied to the following rideshare examples:
- Animating rideshare paths over time, visualizing passenger hotspots and trouble areas.
- Accessing real-time analytics for route efficiency.
- Analyzing courier delivery performance and batch efficiency.
Below, find an example tracking a massive fleet of vehicles navigating through Dubai over the course of a full day of travel. The trails have been customized to show a unique color for each vehicle and every vehicle is also identified with a unique label.
The Trip Layer displaying taxis in Dubai.Like all Studio maps, fleet visualizations can be published and shared via URL, either openly or under password protection.
Additionally, the Export Video feature allows for capture of highlights from a fleet visualization and to share them in whatever forum is preferrable.
In closing, placing a visual element to complex traffic patterns will unlock understanding for an organization as a whole, and not just those that sit in data science roles. Embracing sophisticated fleet visualization tools, like the Trip Layer in Foursquare Studio, will empower businesses to make data-driven decisions, collaborate effectively, and shape a strategic process for managing mass mobility.
To explore the full potential of fleet visualization and its advanced capabilities, click here.


