The world of fashion is as vast and varied as any natural landscape. Trends emerge and recede, much like the peaks and troughs of mountainous terrain. And just as explorers once relied on maps to navigate unfamiliar lands, today’s clothing & fashion entrepreneurs can harness the power of Foursquare to chart their course in the fashion capitals of the world. In this exercise, we will use Foursquare Studio to map the landscape of clothing retail in New York City and explore areas ripe for new ventures, like second-hand clothing stores.
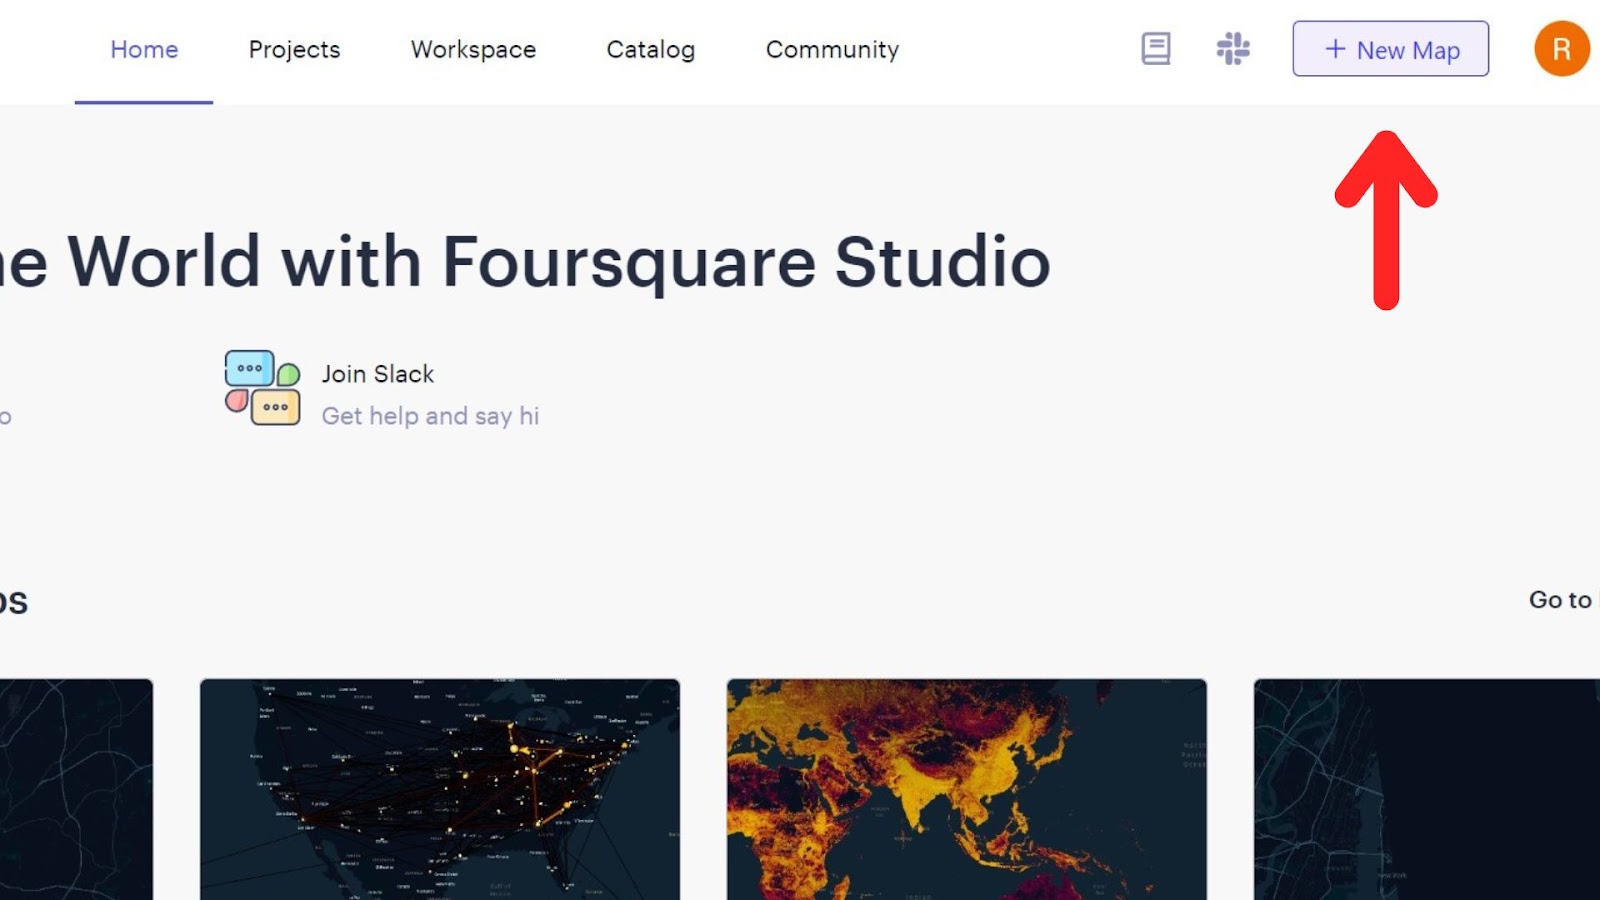
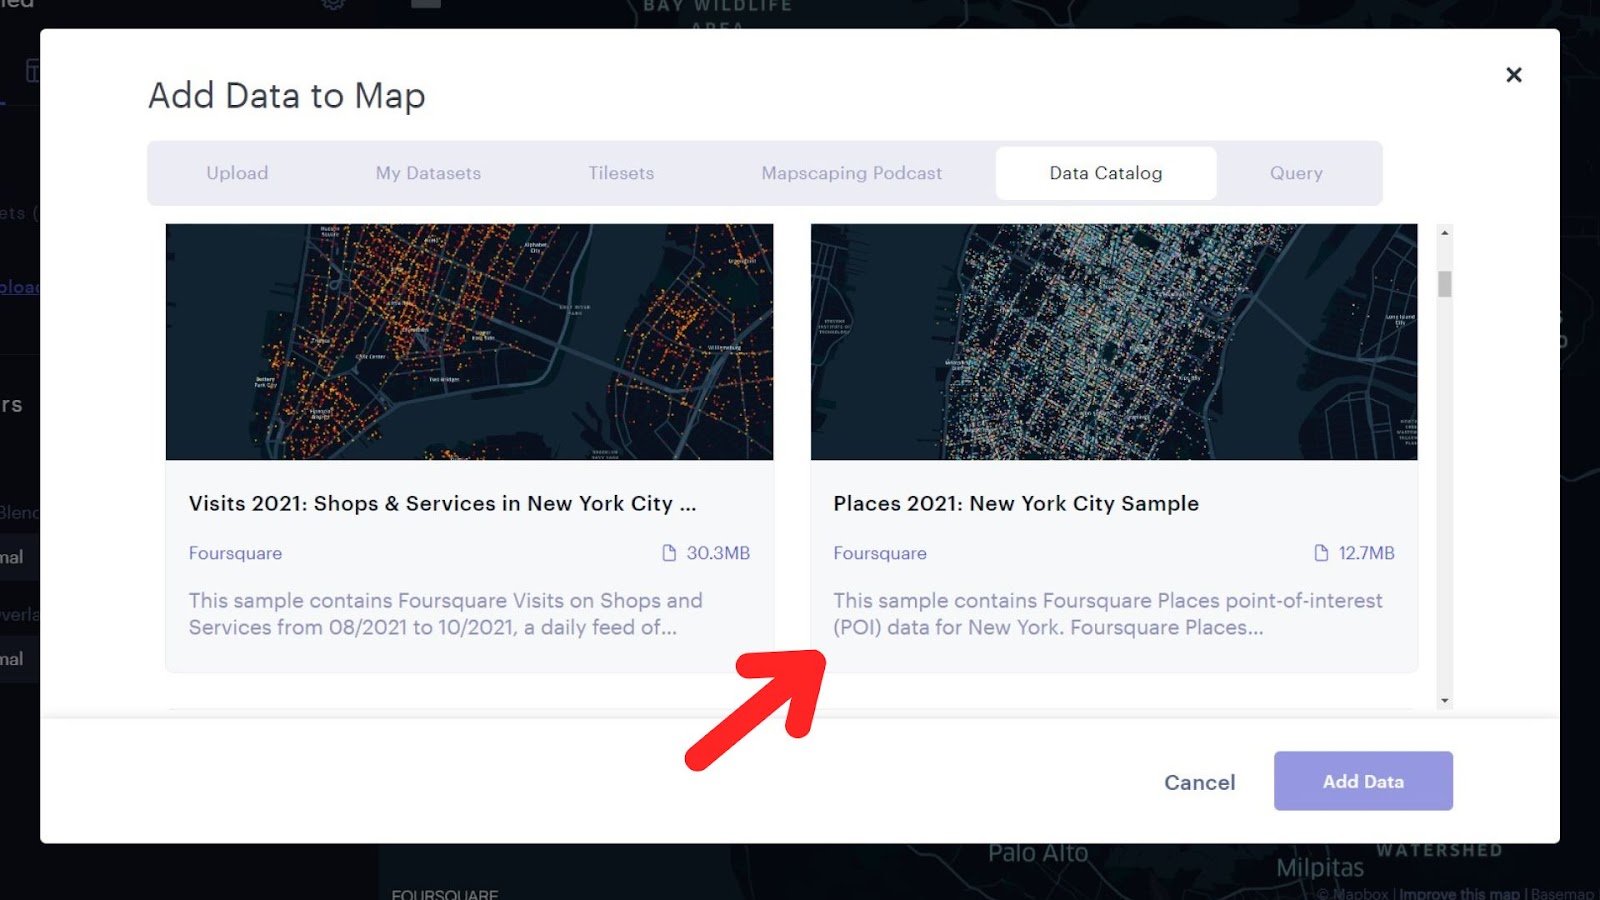
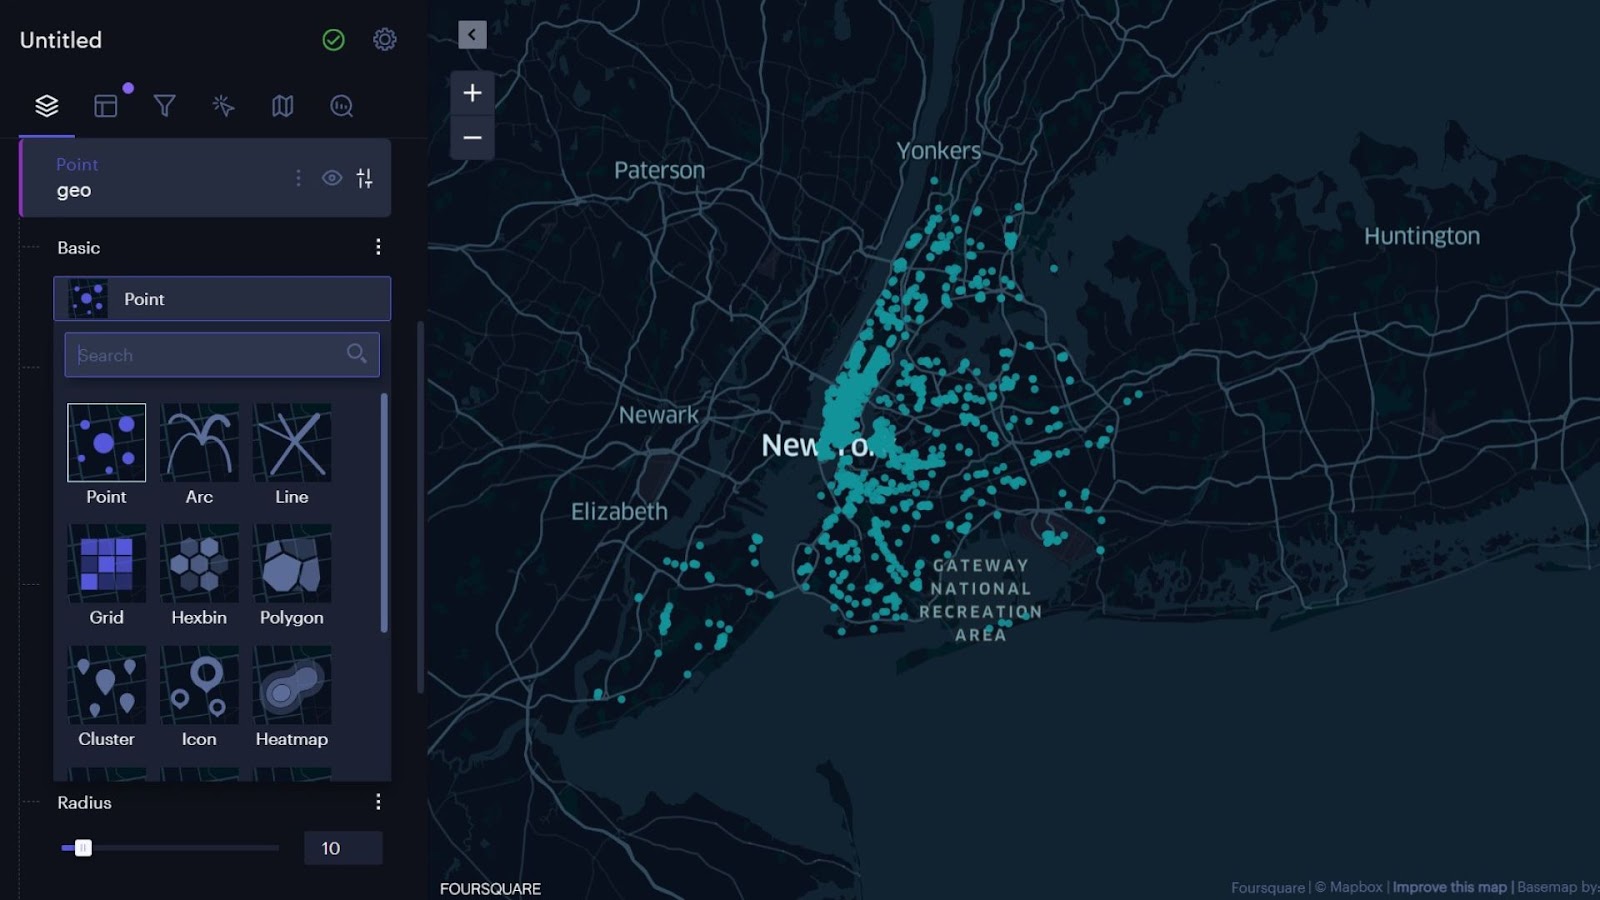
Identifying a market opportunity for clothing retail starts with pinpointing the locations of current shops. Foursquare POI data, encompassing details on a wide range of businesses, including luxury brands, chain retailers, thrist stores and second-hand outlets, is well equipped for this challenge. The first step is to create a new map in Foursquare Studio and then add the POI data. For this exercise, we are using the New York City POI sample from the Data Catlog.
.
Once the data is loaded, navigate to the “Filter” panel. Click “Add Filter,” set the field to “category_name_level2,” and select “Clothing Stores, Department Stores, and Thrift/Vintage Stores for the “Values In” option.
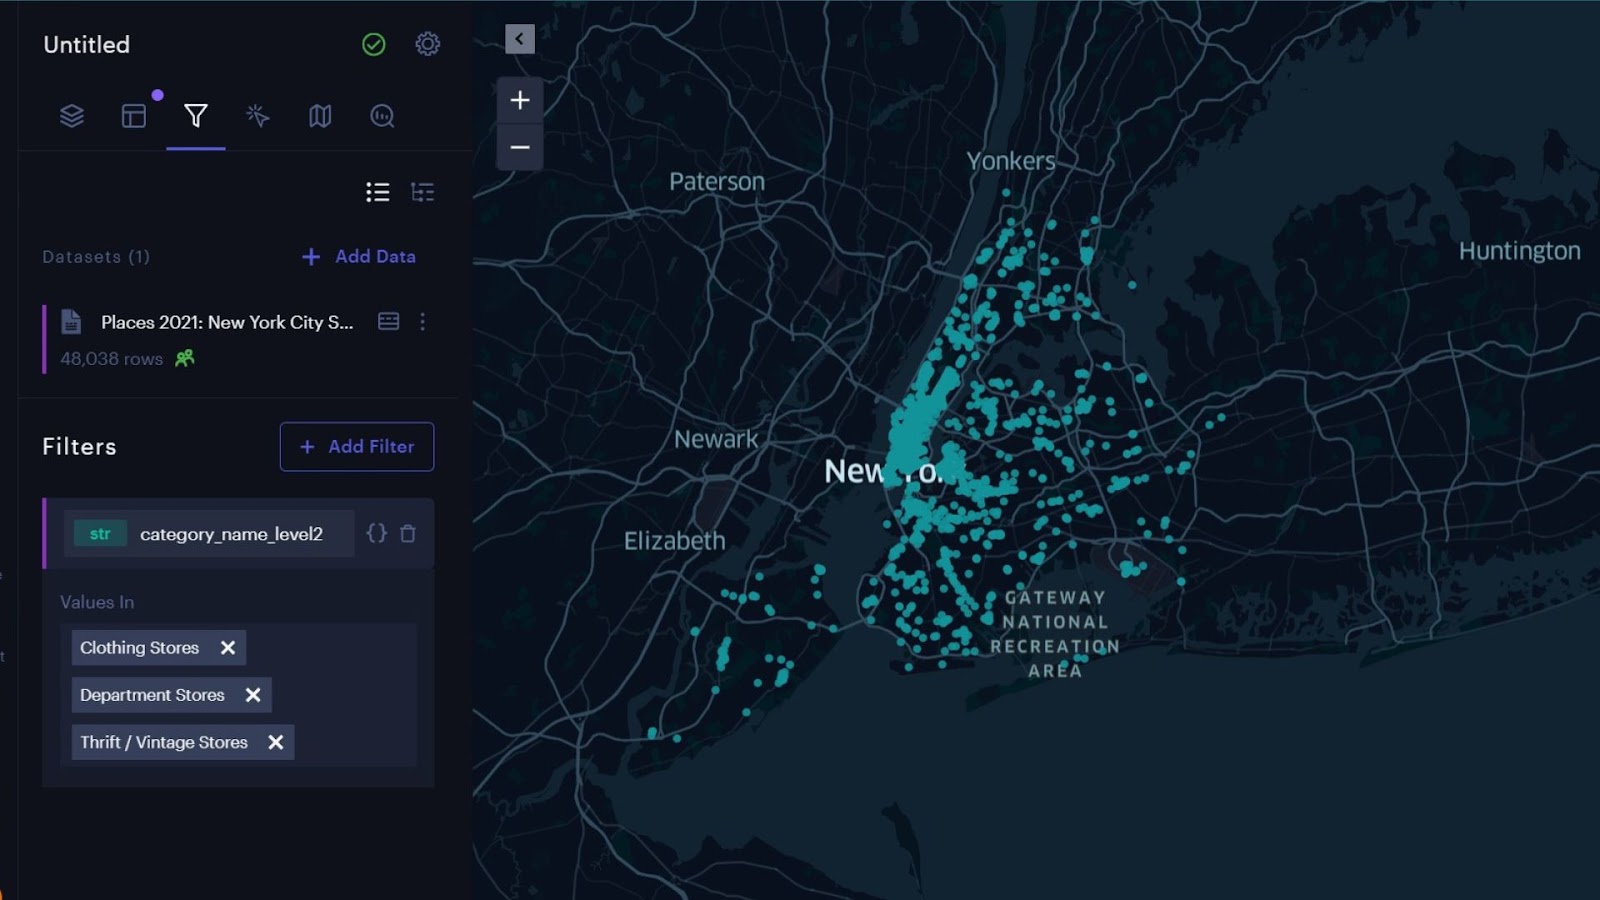
Visually, you can get a general idea of where there are clusters of clothing shops. We can take this analysis further with layer aggregation features in Foursquare Studio and identify the areas with a high concentration of fashion outlets. These areas are the “mountain peaks” in the landscape – areas where fashion is well established and has a strong presence. We will also look for “valleys” or areas with fewer fashion outlets. These could be underserved markets with potential demand for fashion.
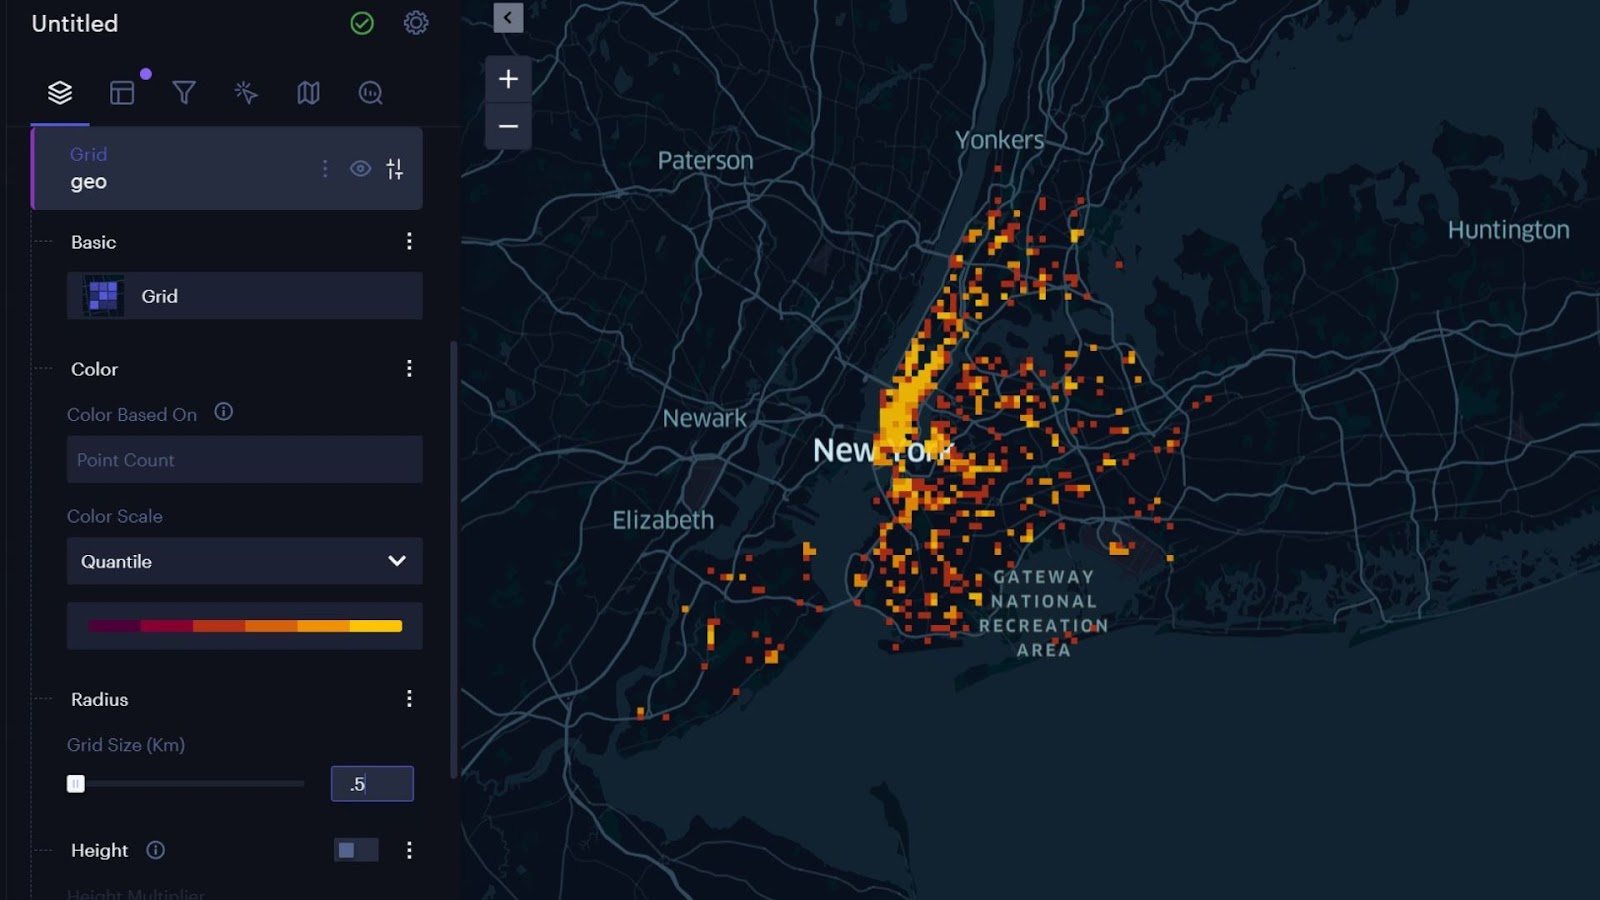
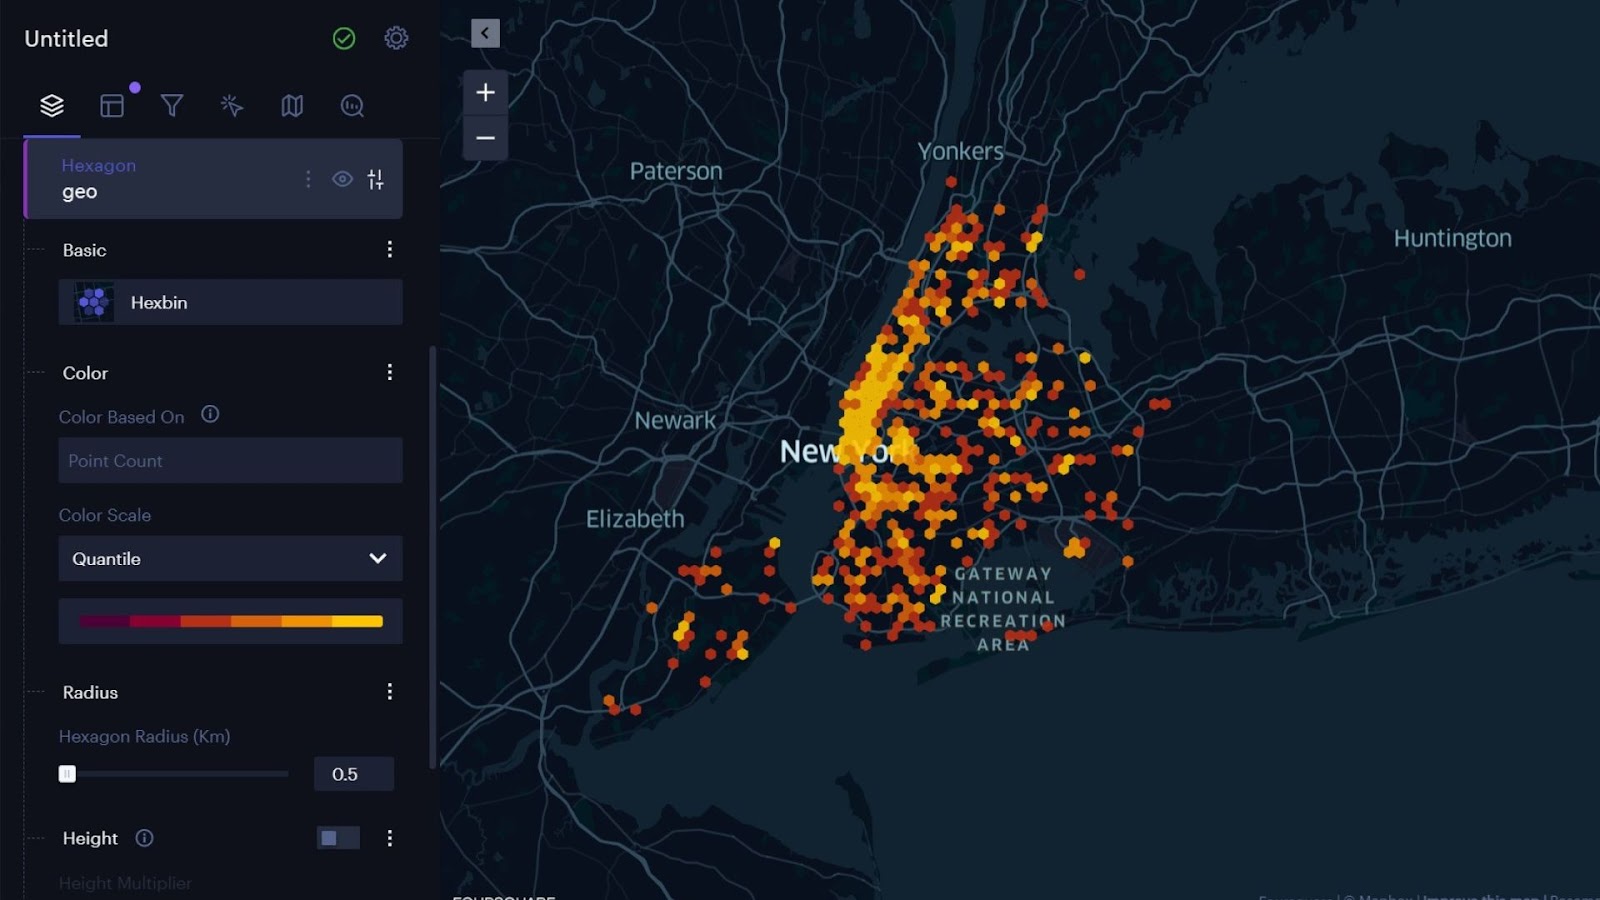
In the “Layers” panel, click on the “geo” layer to open the settings, and under “Basic,” click on the “Point” selection to expand options for visualizing the points. Select “Grid” and change the Grid Size (km) to .5 using the text box under “Radius.” The squares with the most points in that ½ km area are now clearly visible, as are the valleys–areas with fewer shops (or even no shops). Instead of a grid, you can also use the “Hexbin” option, which emphasizes neighboring areas.
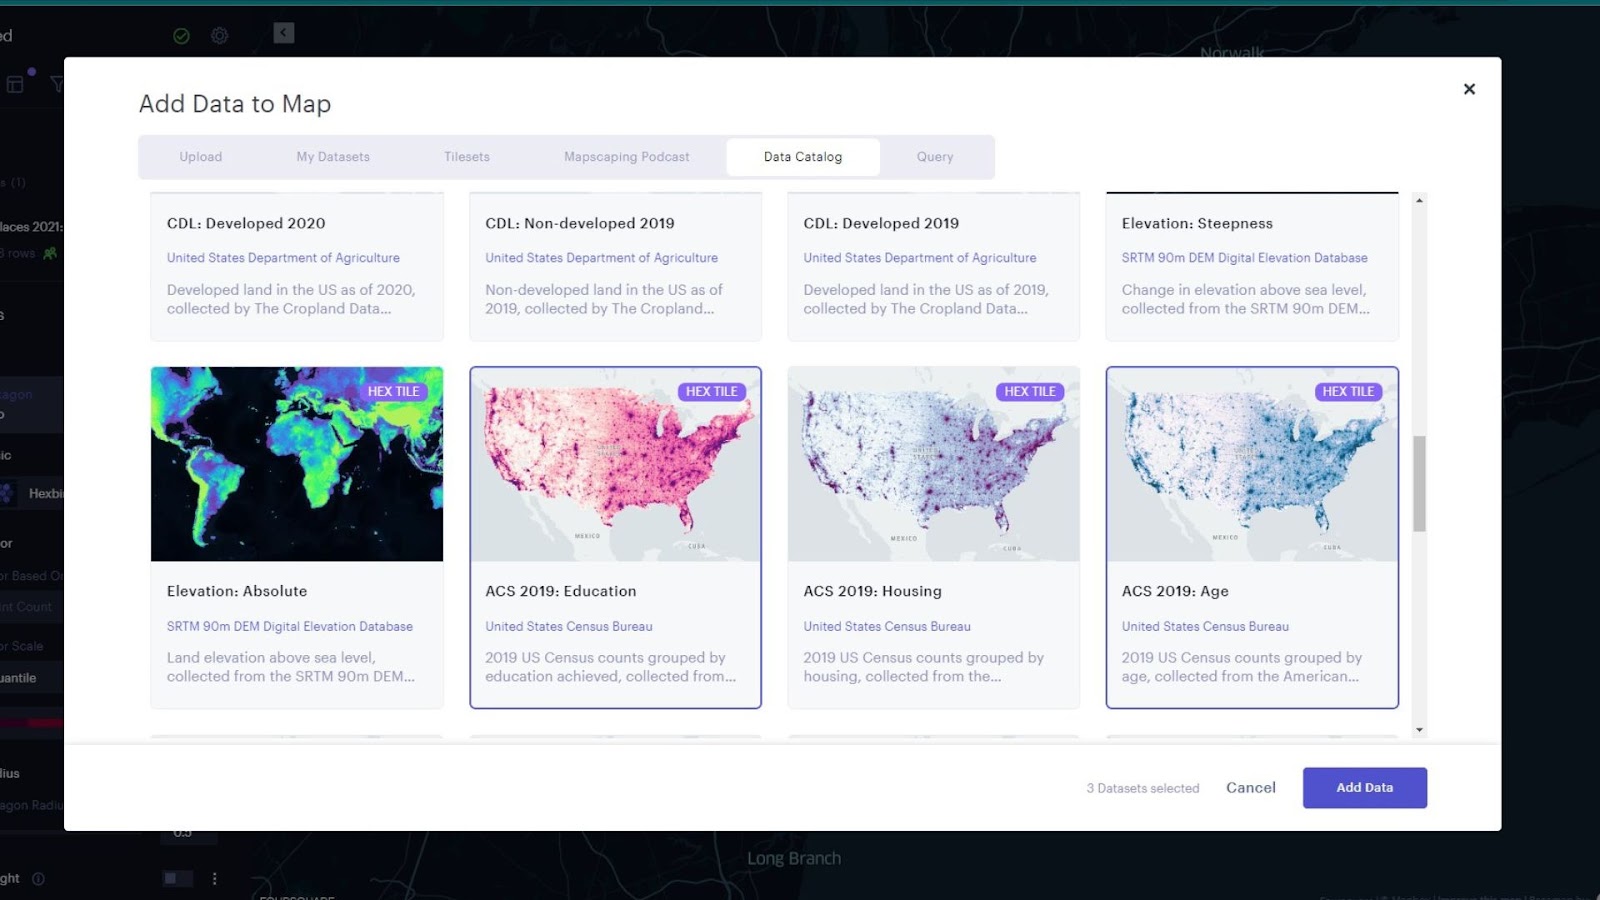
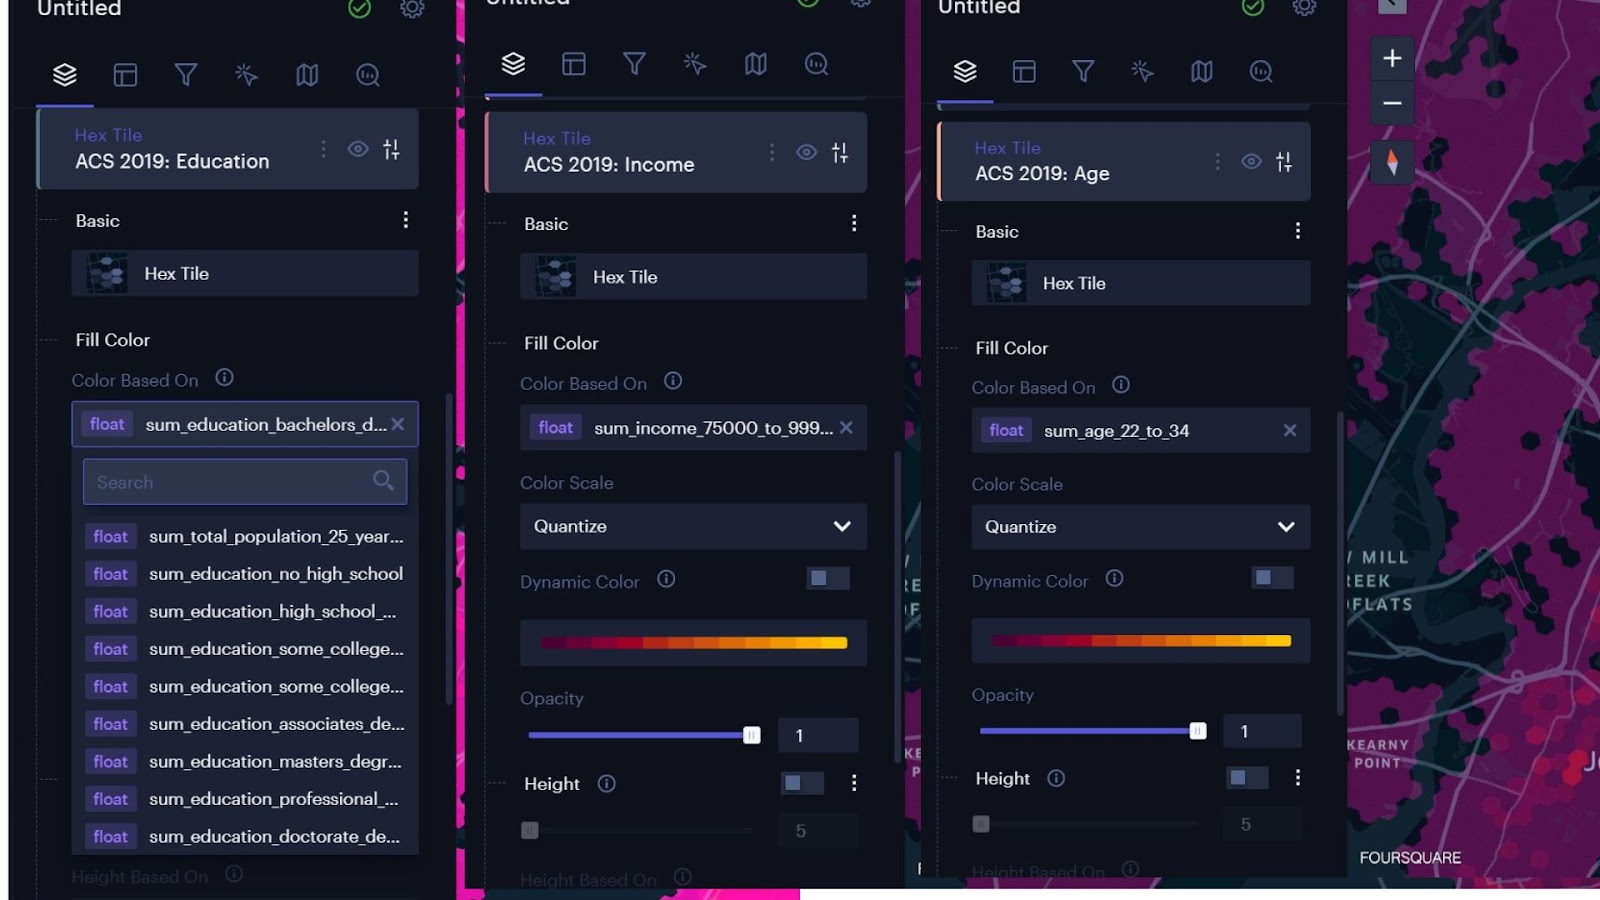
Next, we need to look at the customer landscape. We’ll add three more data layers from the Foursquare Studio data catalog: ACS 2019: Education, ACS 2019: Age, and ACS 2019: Income. On the “Layers” panel, select “Add Data” and navigate to the “Data Catalog” tab. Select all three layers and click “Add Data.”
Under the settings for each layer, select the same color ramp, set the “Color Scale” to “Quantize,” and select the following variables for the “Fill Color” of the corresponding layer. We are choosing these variables to identify where we might find an eco-conscious shopper for a second-hand clothing store. Typically, younger college-educated demographics are more likely to be climate-conscious, so that is who we will target with our variables.
| Layer | “Color Based On” Variable |
| ACS 2019: Income | sum_income_75000_99999 |
| ACS 2019: Age | sum_age_22_to_34 |
| ACS 2019: Education | sum_education_bachelors |
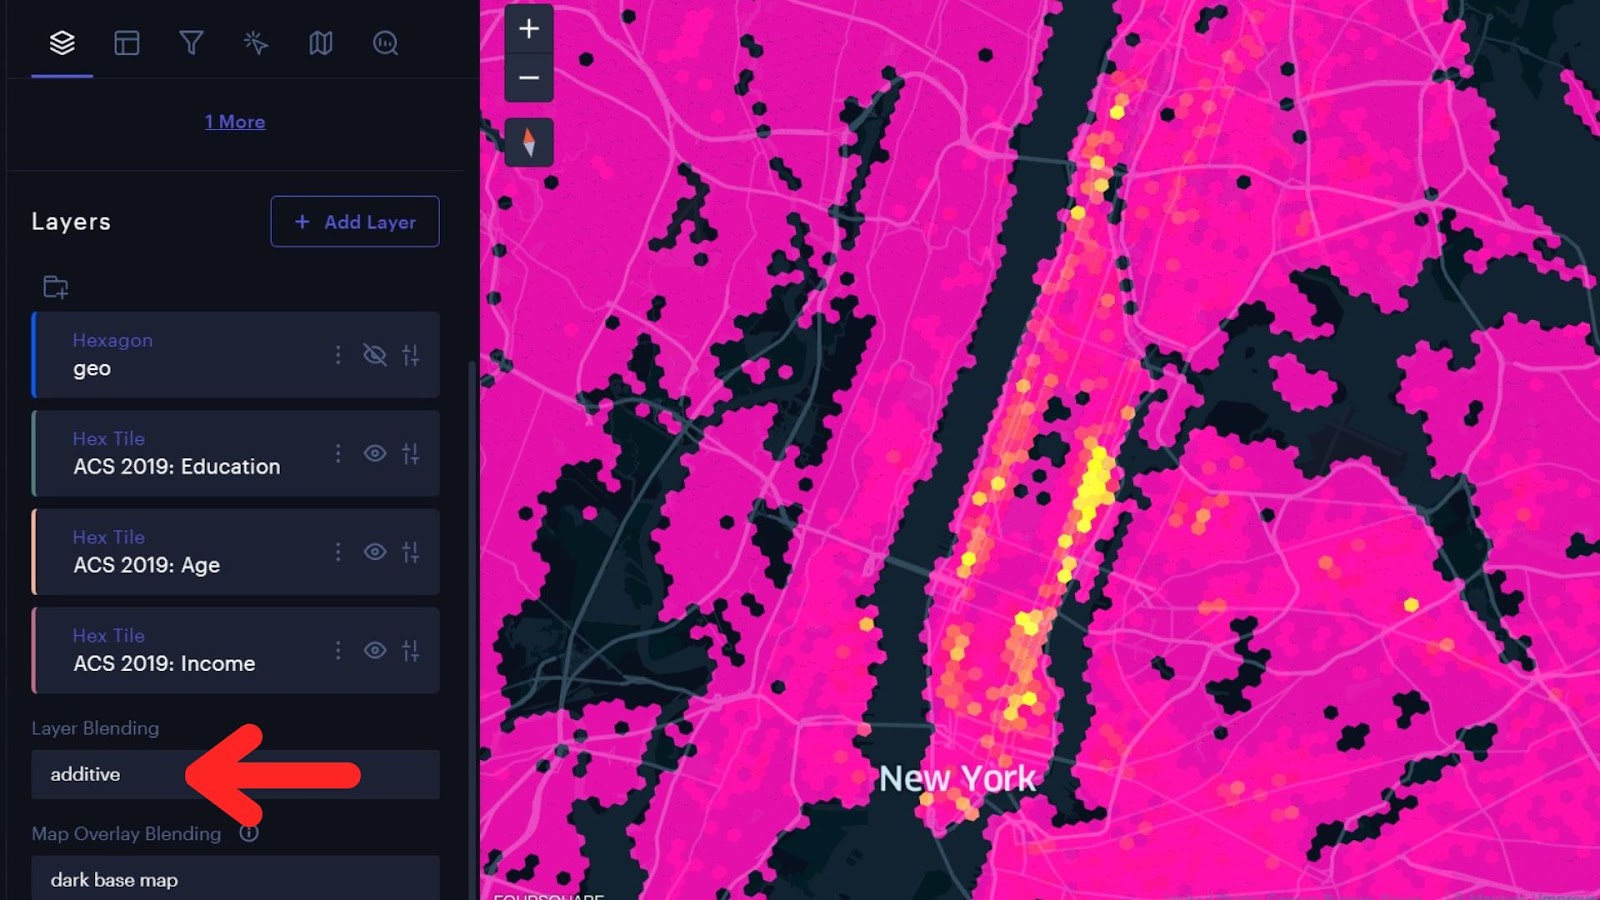
Finally, turn on all three demographic layers at once. Then at the bottom of the layers panel, set “Layer Blending” to additive. Because of the “additive” blending options and the consistent color ramp, the areas where all three criteria are met appear the brightest.
Now, we’ll use the annotation tool to mark the brightest spots in our demographic landscape. Then, turn off the three demographics layers and turn the shops hexagon layer back on to compare the annotations to the “fashion valleys.” With the additive blend mode, you can even turn on all four layers at once.
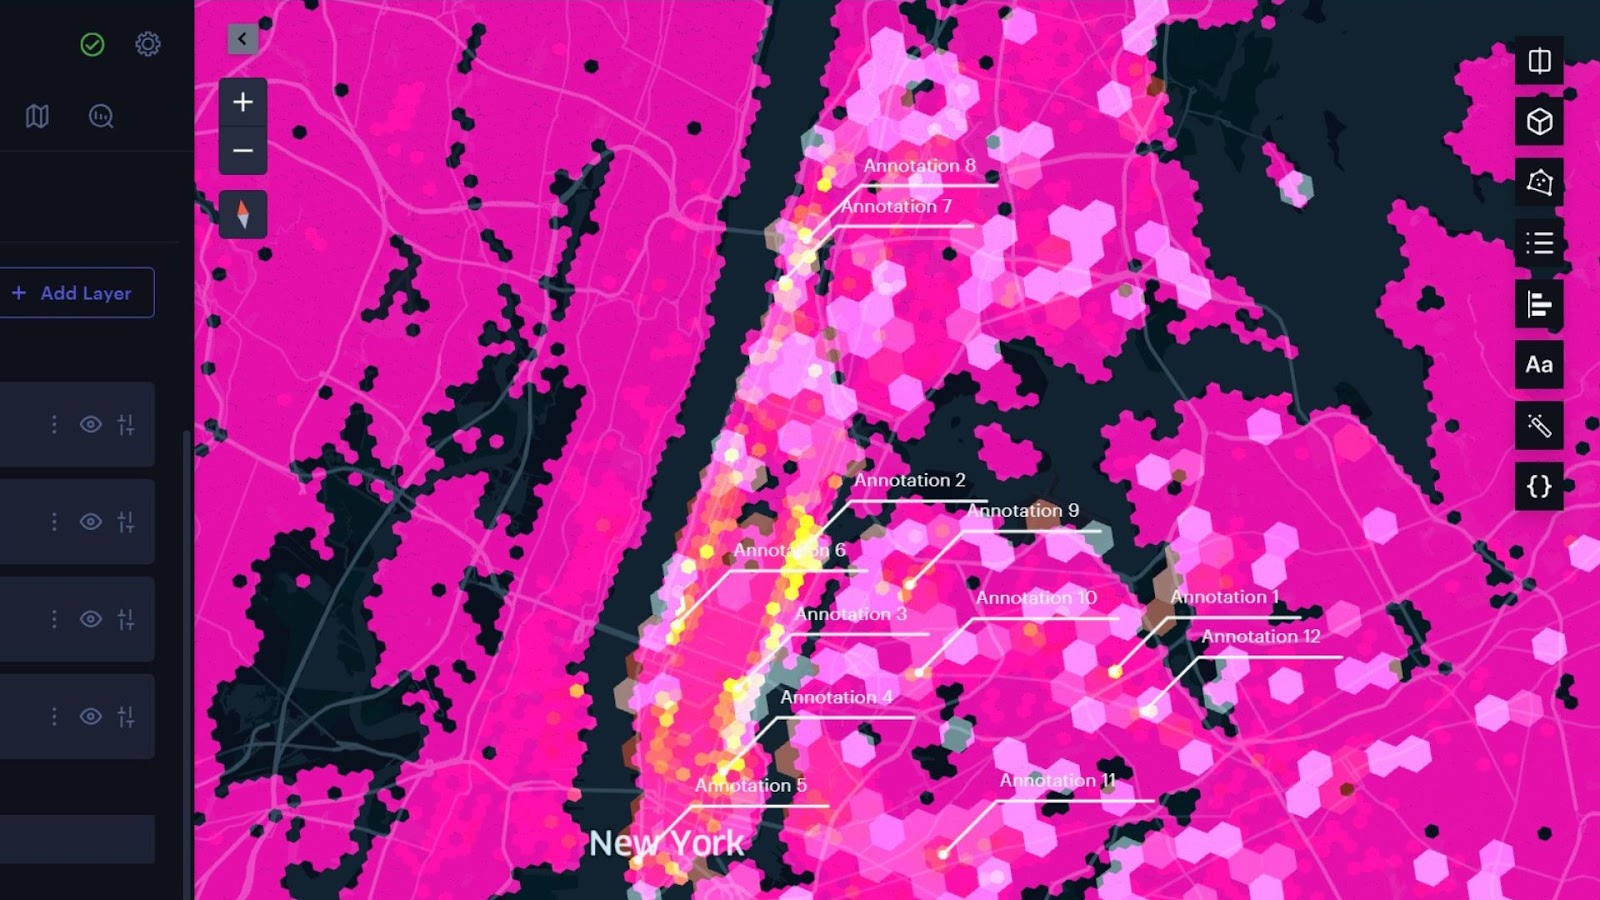
With just a few data layers, we now have several areas to research further to work towards identifying a final location. Further research might look beyond demographics to include other POI criteria like proximity to parking or public transportation and complementary businesses like cafes or bookstores.
For those new to Foursquare Studio, it’s worth noting that the platform offers a range of data sets and tools that are accessible to both beginners and seasoned analysts. You can start by signing up for an account and exploring their data catalog. Foursquare Studio also seamlessly integrates with AWS for enhanced data storage and processing capabilities.
Let’s recap the key steps we followed in this exercise: 1) Filter and aggregate POI data to identify high and low-concentration areas of fashion outlets (the supply), 2) add and overlay demographic data to identify potential consumer hotspots (the demand), and 3) search for areas of low supply and high demand. By combining these layers of information, you’re not just taking a shot in the dark; you’re guiding your efforts and resources to identify opportunities to enrich the fashion ecosystem of your chosen city. With this knowledge and the power of Foursquare, you’re on your way to turning your entrepreneurial dreams into reality.


