Atlanta, often dubbed the jewel of the South, boasts a travel scene as rich and diverse as its history. From the busy streets of Midtown to the serene historic neighborhoods, this city is packed with stories and experiences waiting to be discovered by curious travelers. In an age where travelers crave authentic, hyper-local experiences, the need for in-depth, granular insights into a destination’s offerings has never been more paramount.
To meet traveler expectations, I need to provide the journalists at a hypothetical travel magazine with leads on locations to be featured in an article for an upcoming edition about Atlanta, GA. Foursquare’s Point of Interest (POI) data is packed with the detail needed for effective lead generation, especially when it’s housed in a cloud database like Amazon Redshift and seamlessly retrieved in Foursquare Studio via simple Structured Query Language (SQL) commands. Once they have the lead lists for their articles, the writers can start digging into each location to then select places to feature in their assigned pieces. After selecting the places they want to feature, they can return to Foursquare Studio and quickly generate a map of the locations for the article, complete with the custom color palettes for the Atlanta edition of the magazine.
If you’re new to Foursquare, here’s an overview of the products in use. Foursquare Studio is a browser-based environment for analyzing and visualizing location data. Foursquare is also in the geospatial data business and many map applications commonly used today are leveraging Foursquare POI data.
Back to the travel magazine, accessibility has been at the forefront of recent conversations in the tourism industry. To follow the trend, the three articles I will generate leads for will highlight dining options in Atlanta for three segments of travelers with accessibility needs:
- Top 10 Dining Options for the Mobility Impaired
- Sensory-Friendly Dining: 5 Venues Catering to ADHD, ASD, and HSD
- 5 Hidden Gems for Gluten-free Dining
For readers who are less tech-savvy, here’s a brief intro to Amazon Redshift and SQL. Imagine you’re in a vast library filled with countless books, each containing unique stories and information about various destinations. Now, you’re looking for specific details about a given destination, like a hidden beach in Bali or the best crêpes in Paris. Manually searching through each book would be tedious. This is where SQL and databases like Redshift can help. SQL is like a librarian that you can present questions to. The librarian then can effortlessly show you all the books and corresponding pages with information about the topic you are looking for in the library or database (i.e. Redshift).
An SQL query is just a phrase you’d use to ask the librarian for information. For example, instead of flipping through every page of every book, you can submit an SQL query to the librarian asking, “Can you show me all the cafés in Paris that have outdoor seating?” or “Which beaches in Bali are least crowded in December?” Redshift, on the other hand, is the library itself. It stores and organizes large amounts of data in a way that’s easy to explore.
Now, let’s bring this back to travel writing. Say you’re working on an article about dining options in Atlanta. With SQL, you can ask Redshift specific questions about POIs like, “Which eateries in Atlanta accept MasterCard?” or “Show me restaurants that offer valet parking.” Within moments, you’ll have a curated list, allowing you to focus on crafting a narrative rather than sifting through endless data. In this exercise and many other lead generation situations, SQL and Redshift make the research process efficient, precise, and tailored to your needs. You spend less time searching and more time writing, creating, and exploring.
To use SQL to find restaurants for the three articles, I need to consider what criteria a place would need to have and then look at the data available to identify attributes that meet the criteria. Let’s break down the criteria for each story:
Top 10 Dining Options for the Mobility Impaired
Restaurant
Wheelchair accessibility
Parking accommodations
Spacious seating
Restroom accessibility
Sensory-Friendly Dining: 5 Venues Catering to ADHD, ASD, and HSD
Restaurant
Quieter ambiance
Availability of private or secluded seating
Minimal distractions (e.g., venues without live music or TV screens)
Clear and concise menu options
5 Hidden Gems for Gluten-free Dining
Restaurant
Gluten-free menu options
High cleanliness standards
Positive reviews specifically mention gluten-free offerings
Not being a widely recognized chain (to maintain the “hidden gem” aspect)
Now that I have defined the criteria, I need to see what attributes in the data match the criteria. Then, I’ll write an SQL statement in Foursquare Studio to retrieve all the POIs that meet the criteria. All the attributes for the POI data are listed here. After reviewing the list, I determined these five variables will help generate a list of mobility friendly restaurants that could be featured in the article.
- wheelchairaccessible (Boolean): This attribute denotes whether a venue is wheelchair accessible (True or False).
- valetparking (Boolean): This attribute denotes whether a venue offers valet parking (True or False).
- privatelot (Boolean): This attribute denotes whether a venue has a private parking lot (True or False).
- sitdowndining (Boolean): This attribute denotes whether a venue offers sit-down dining (True or False).
- restroom (Boolean): This attribute denotes whether a venue has restrooms (True or False).
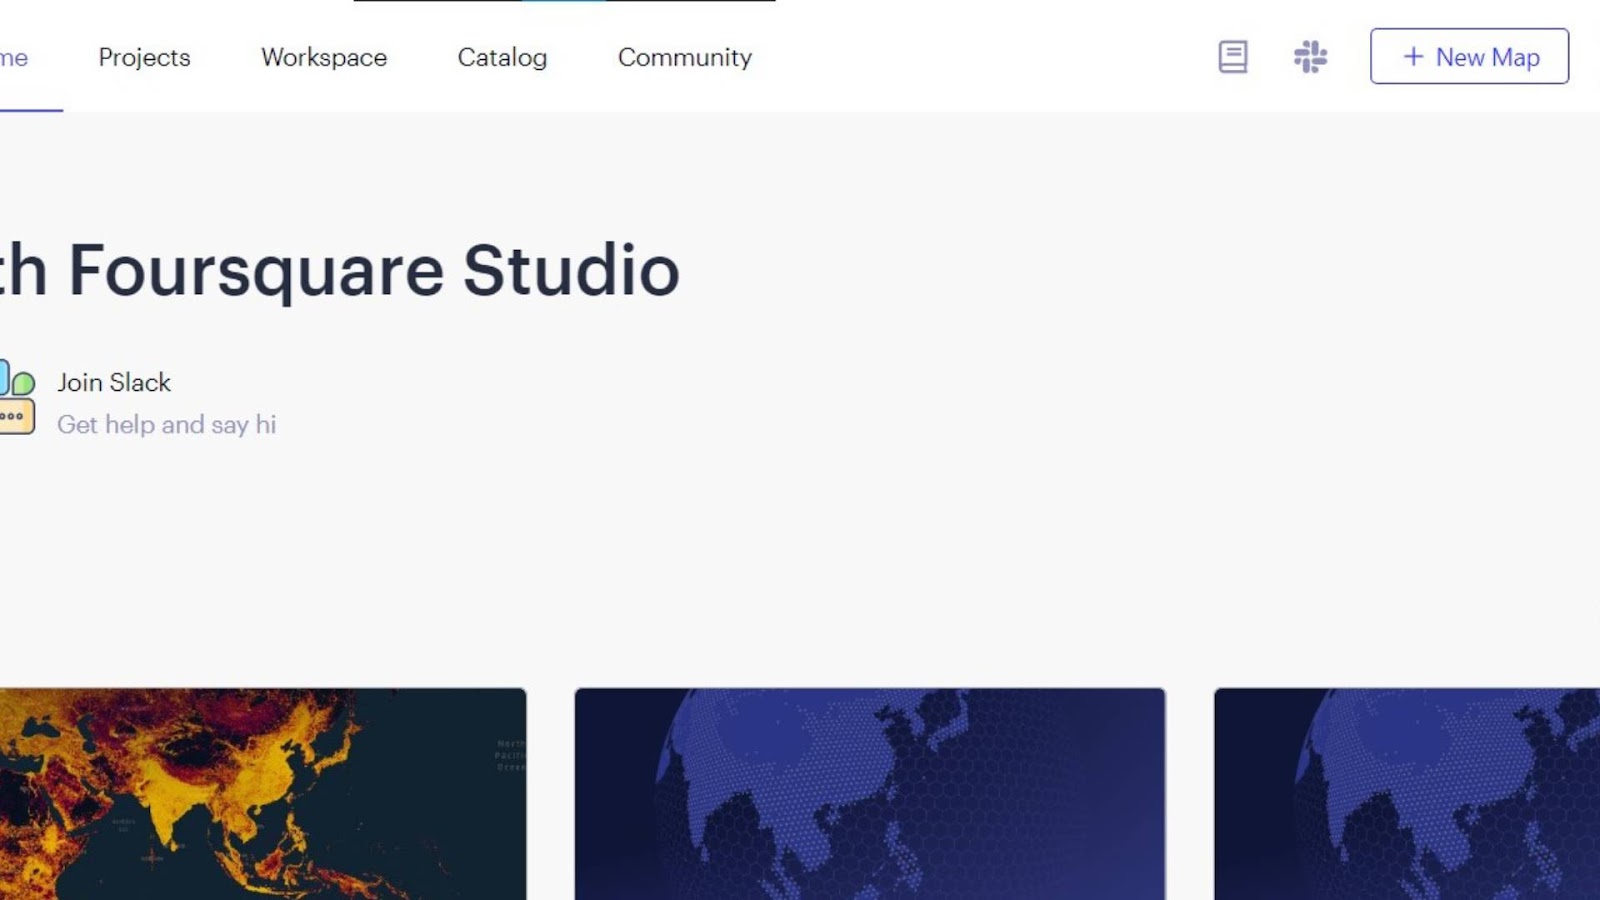
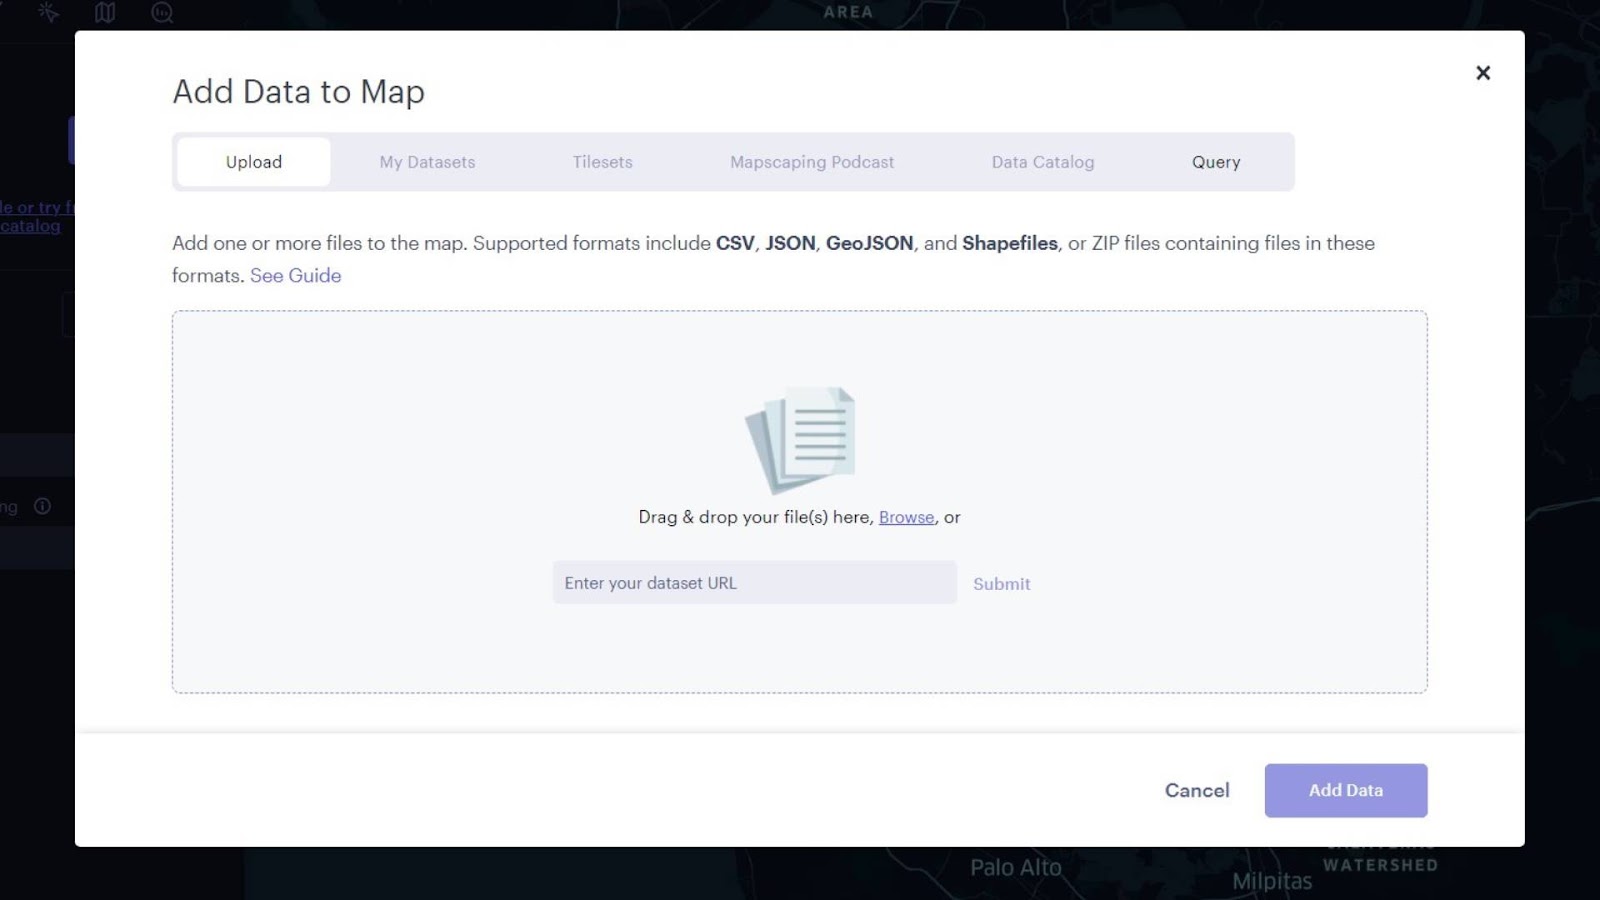
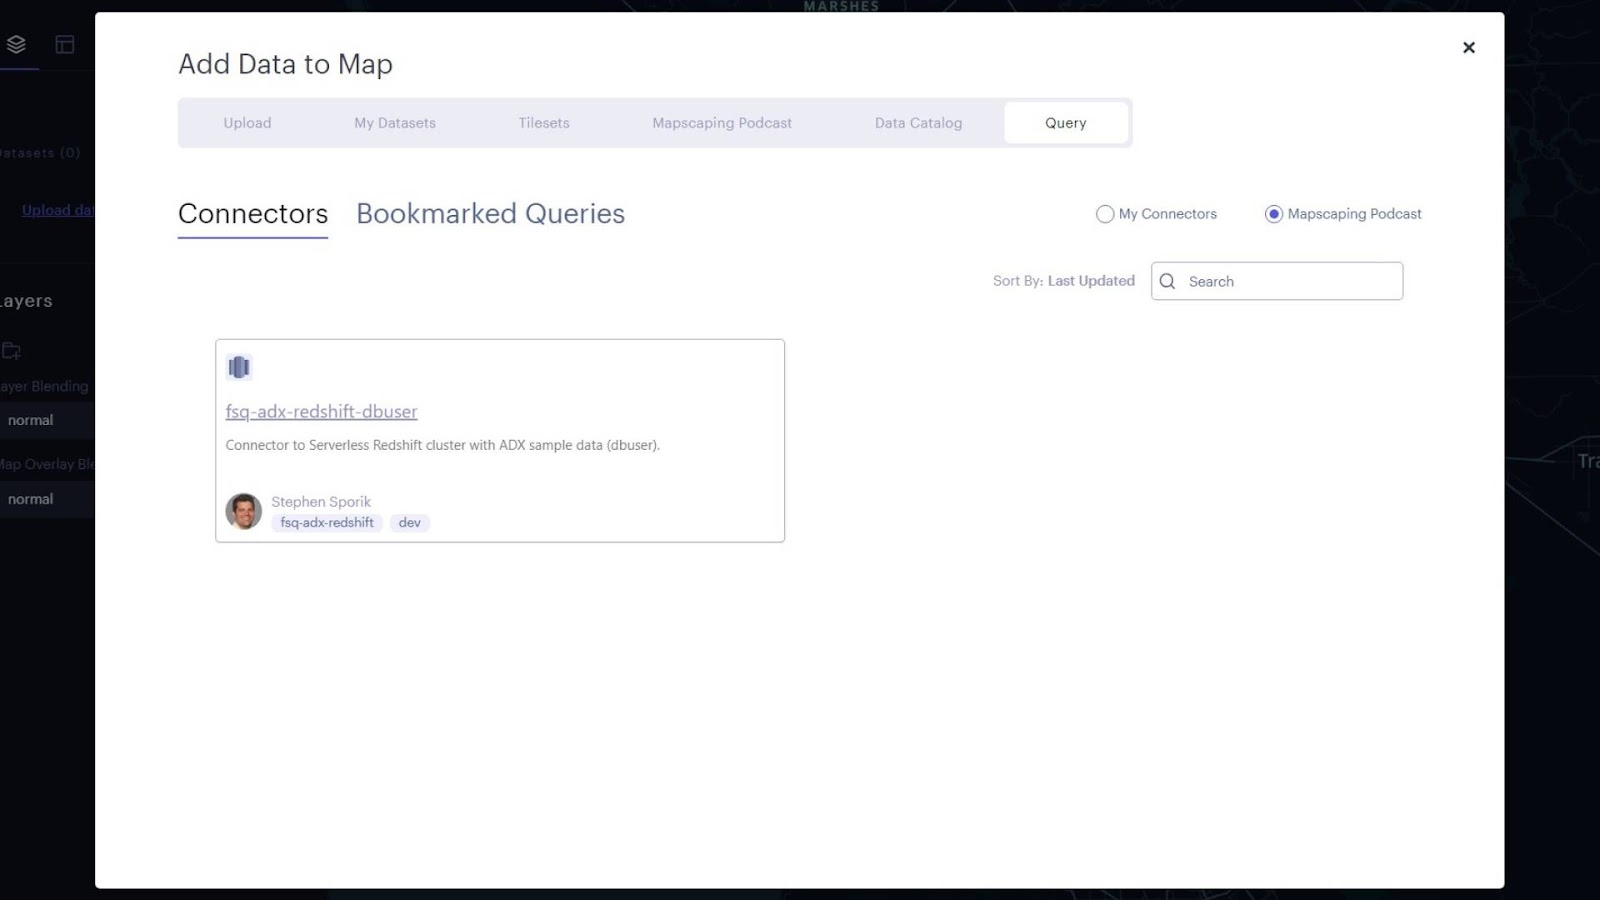
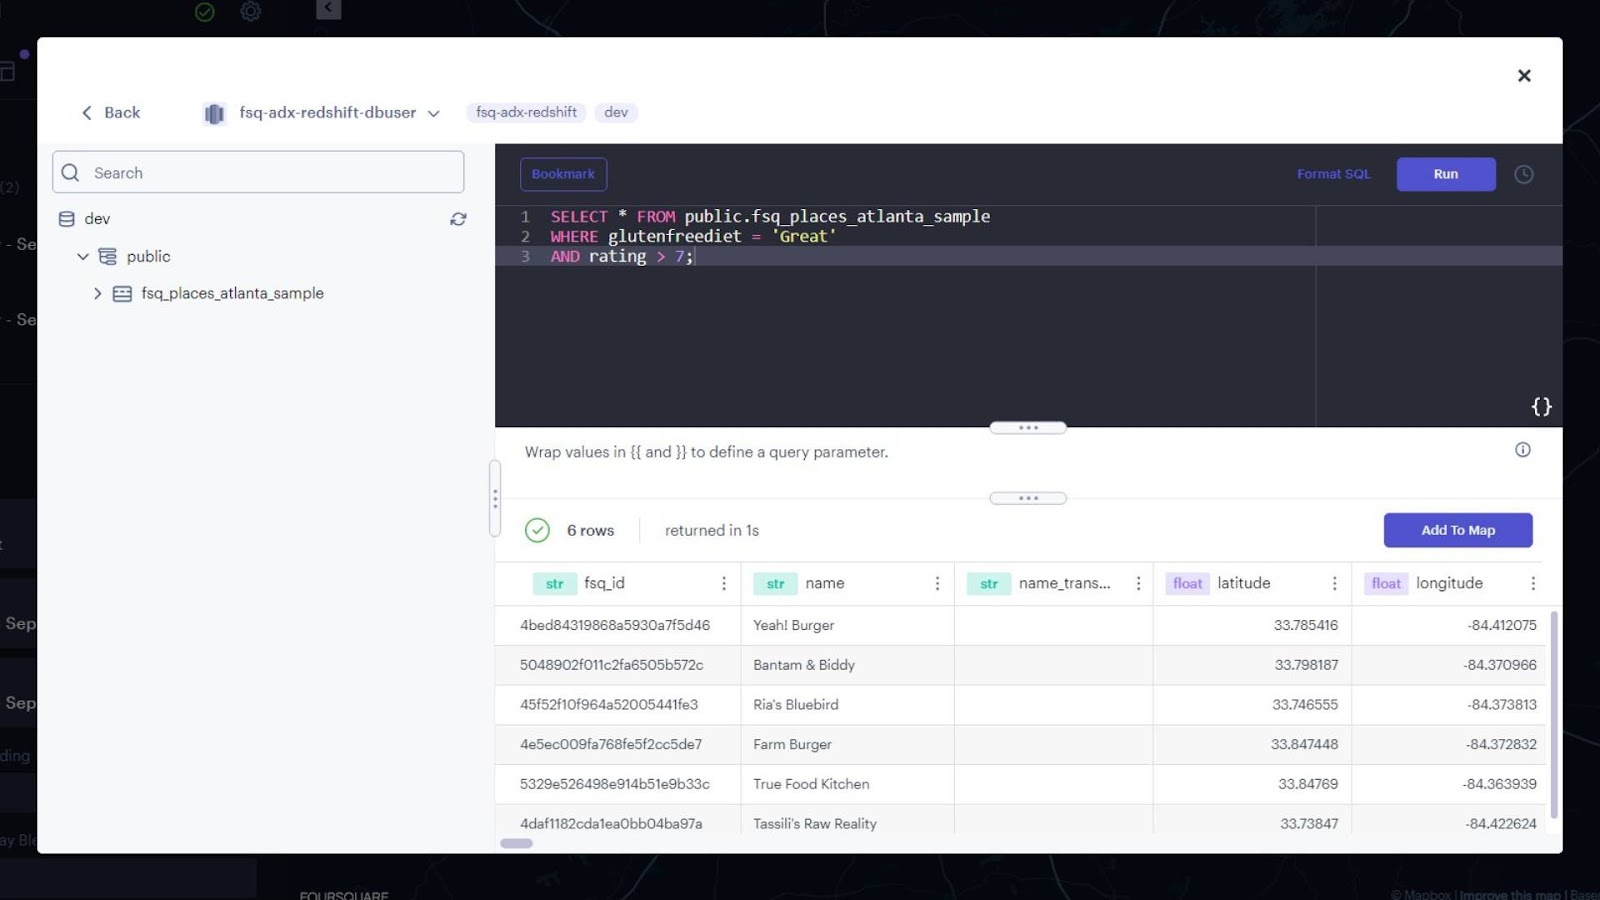
Now let’s write the SQL statement using these variables! My Redshift database is already set up as a connector in Studio; however, Foursquare has extensive documentation and support for connecting to seven different connectors, including Redshift. To access my Redshift database in Studio, I create a new map and click “Add Data.” Then I click the “Query” tab and then select the connector card which launches the SQL window to interact with it.
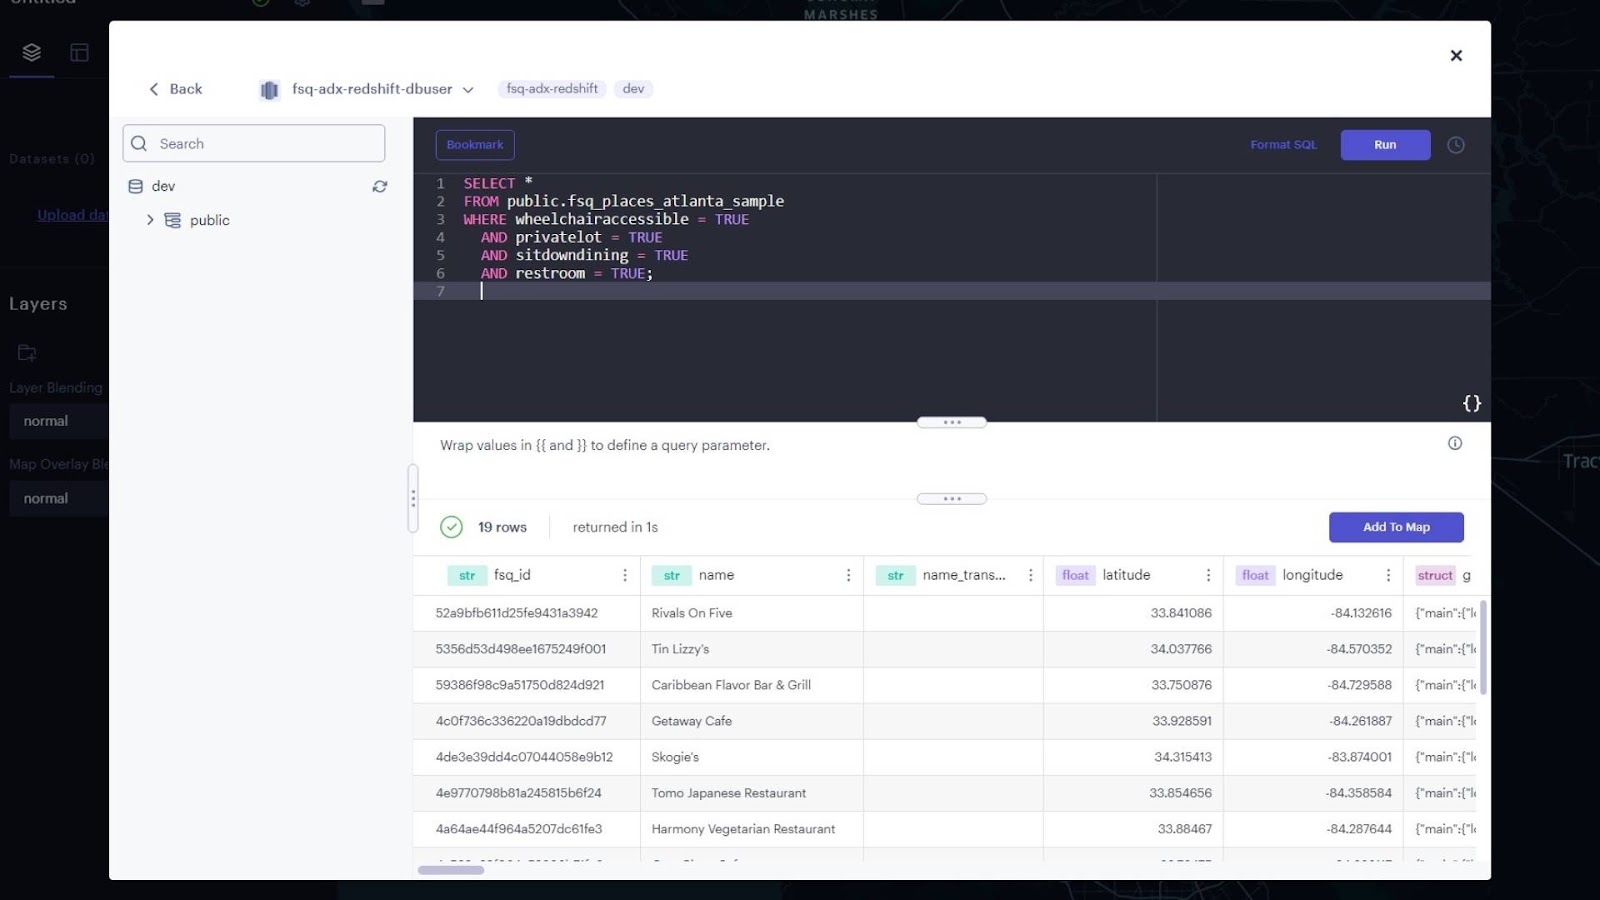
In the left panel, we see the database name is “dev,” and it’s in the “public” schema. Under “public” is the table namer: “fsq_places_atlanta_sample.” So to retrieve POIs from that table that meet the specified criteria I typed the following SQL statement into the Foursquare Studio sQL code editor and pressed “Run”:
SELECT *
FROM public.fsq_places_atlanta_sample
WHERE wheelchairaccessible = TRUE
AND privatelot = TRUE
AND sitdowndining = TRUE
AND restroom = TRUE;
That one SQL statement took me from 528k total POIs in Atlanta to just 19 POIs that meet the full criteria for the mobility-impaired dining article. I could take a more quantitative approach to finding the top restaurant by sorting the results by ratings, popularity, service quality, etc., or even adding those to the query. Or, with only 19 POIs, a writer could set out to do research on each restaurant using the website, address, and contact info also available in the Foursquare POI attributes.
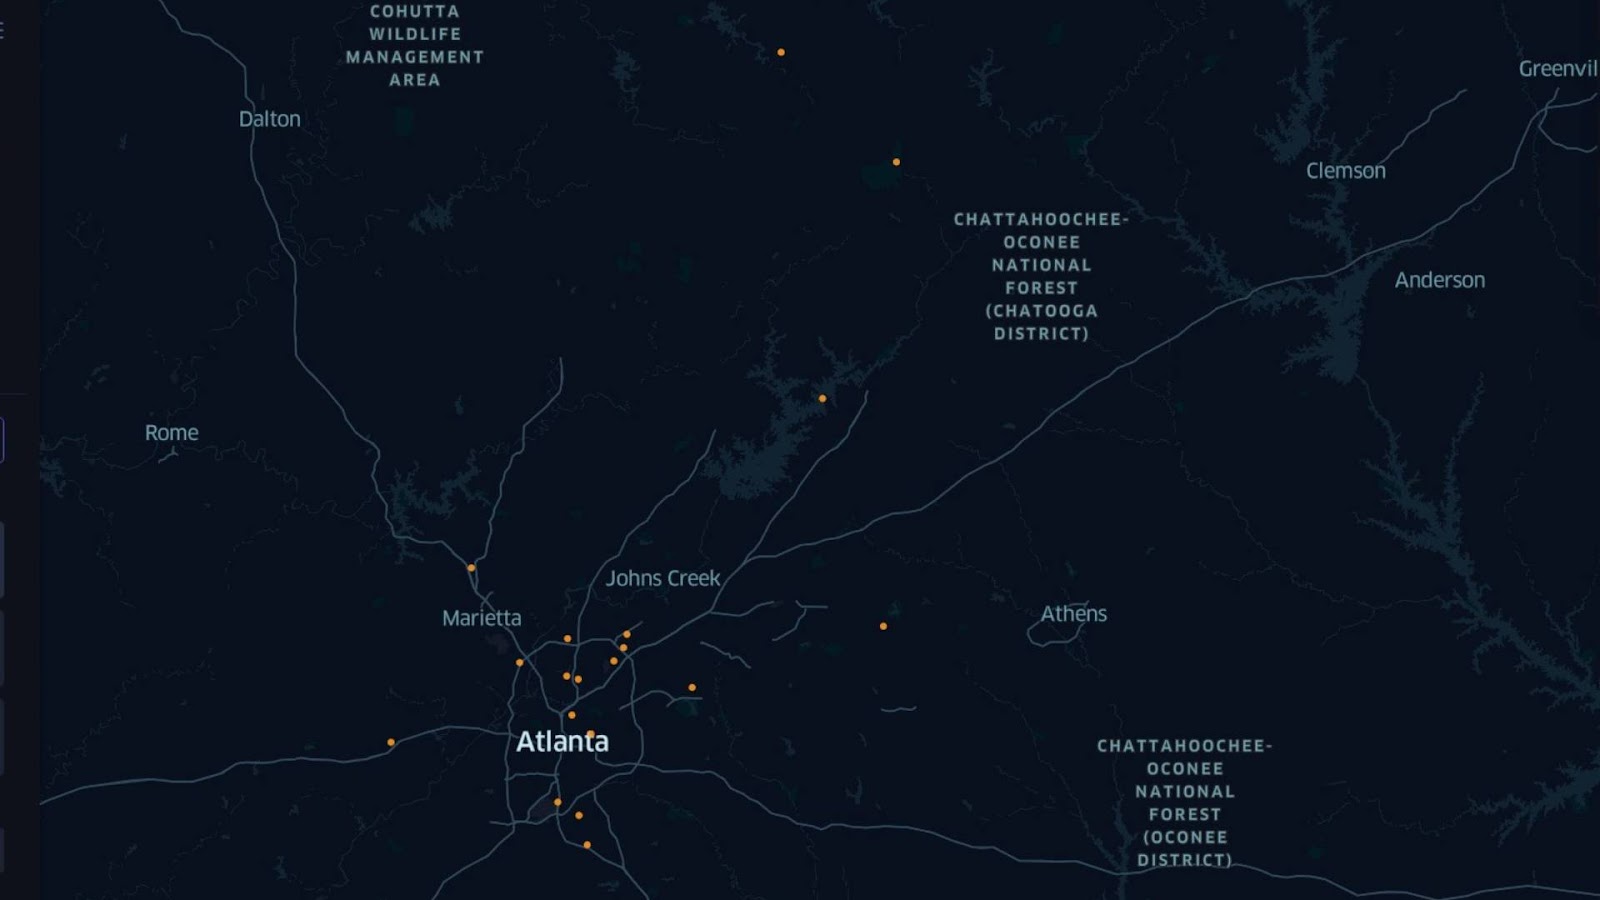
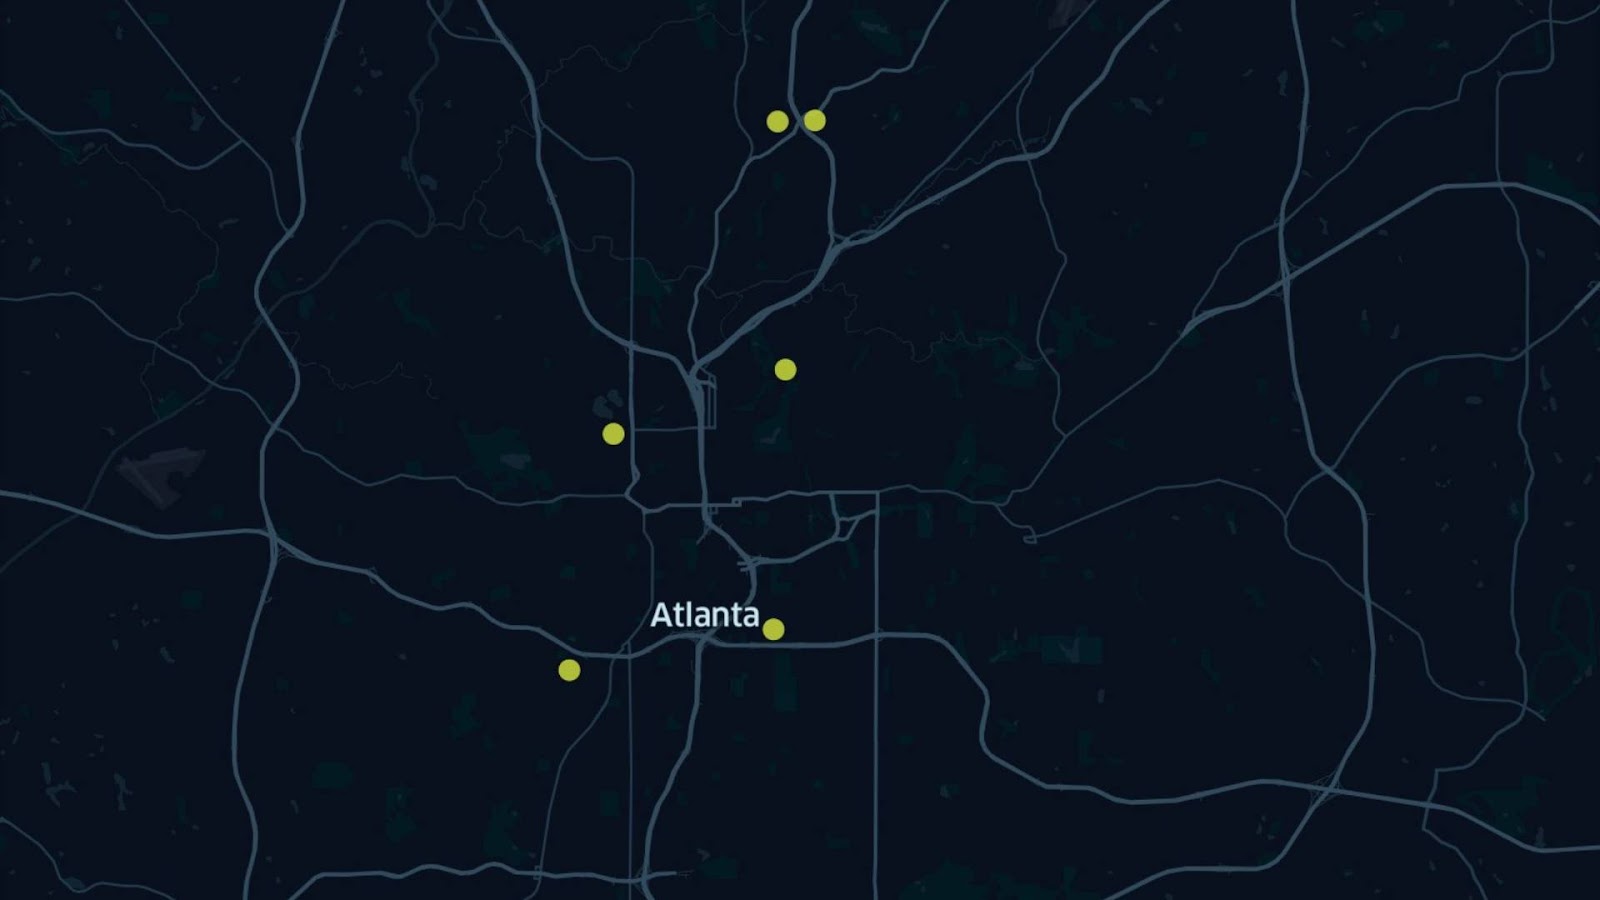
In the query window, I can add the 19 candidates to the map with the “Add to Map” button. Now, the journalists can see the proximity of the restaurants if they want to plan visits to each site as part of the research. Once the ten sites for the article have been finalized, I can update the map to show just those points and configure it for sharing on the blog page where the article will be posted and export a static version for print.
Since this is for a large travel magazine, Foursquare Studio Enterprise offers some additional features that support a publication workflow. The first is “Projects” which lets teams organize maps and datasets into project-focused buckets. The second is the “Color Palette Library,” which lets you set custom color palettes to your account, which can then be accessed by the entire team. In a publication environment, this would allow you to easily maintain brand consistency as you generate the visuals and charts to accompany the articles.
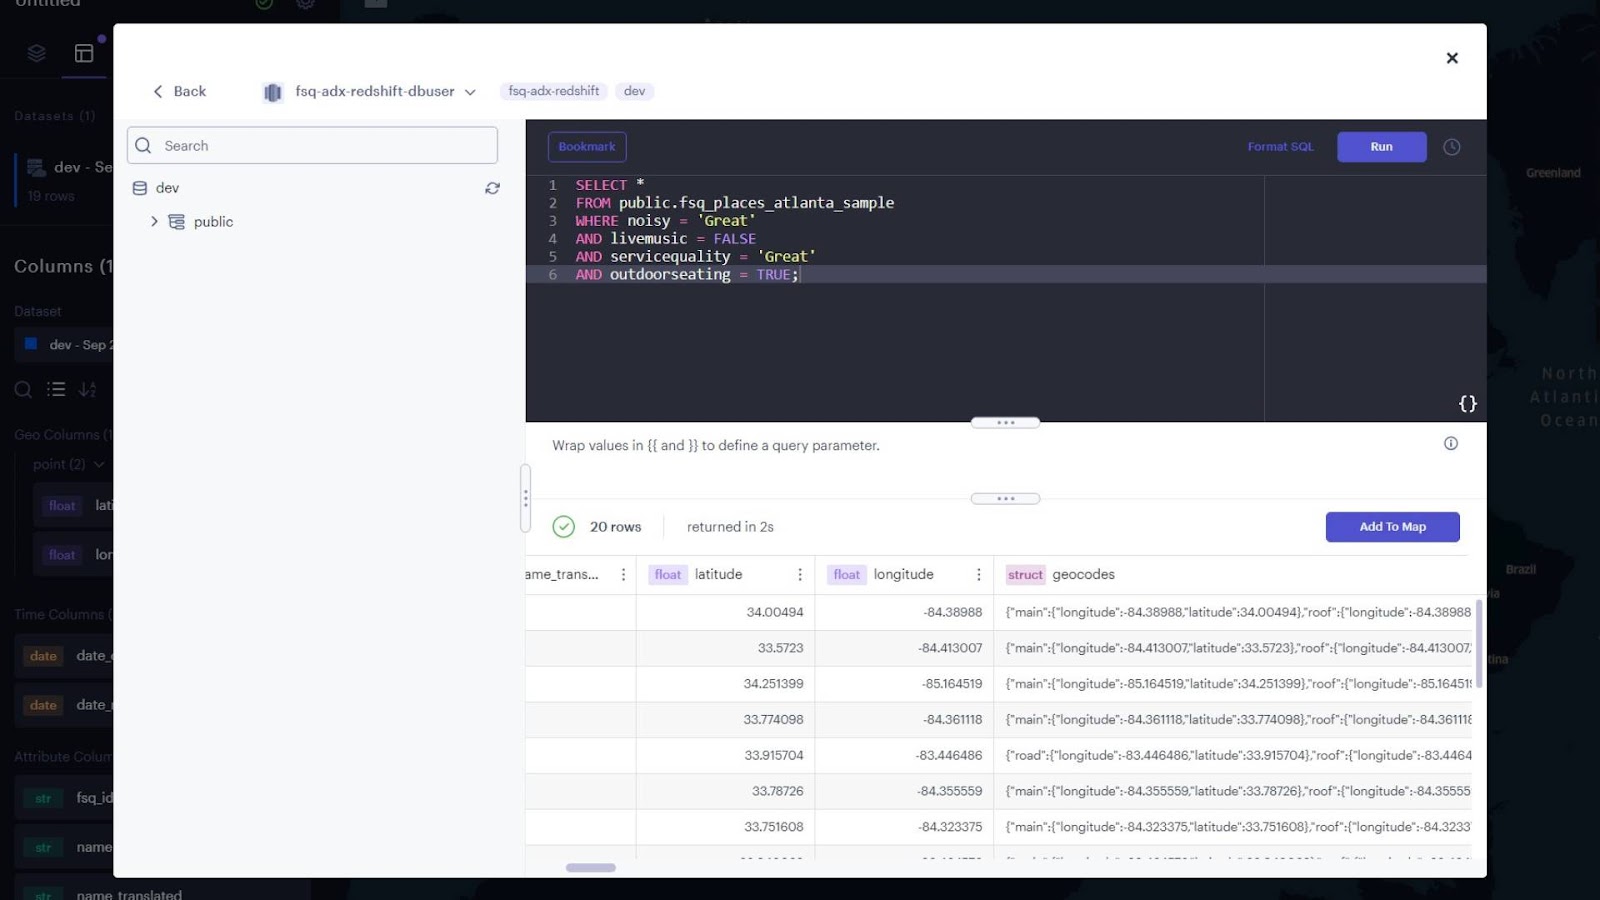
To showcase the repeatability of this “lead generation” workflow, I simply can just review these steps for the final two articles:
- Review the schema for relevant variables I can query.
- Local Collaborations: Identify local establishments (non-chain) for exclusive traveler experiences or behind-the-scenes tours.
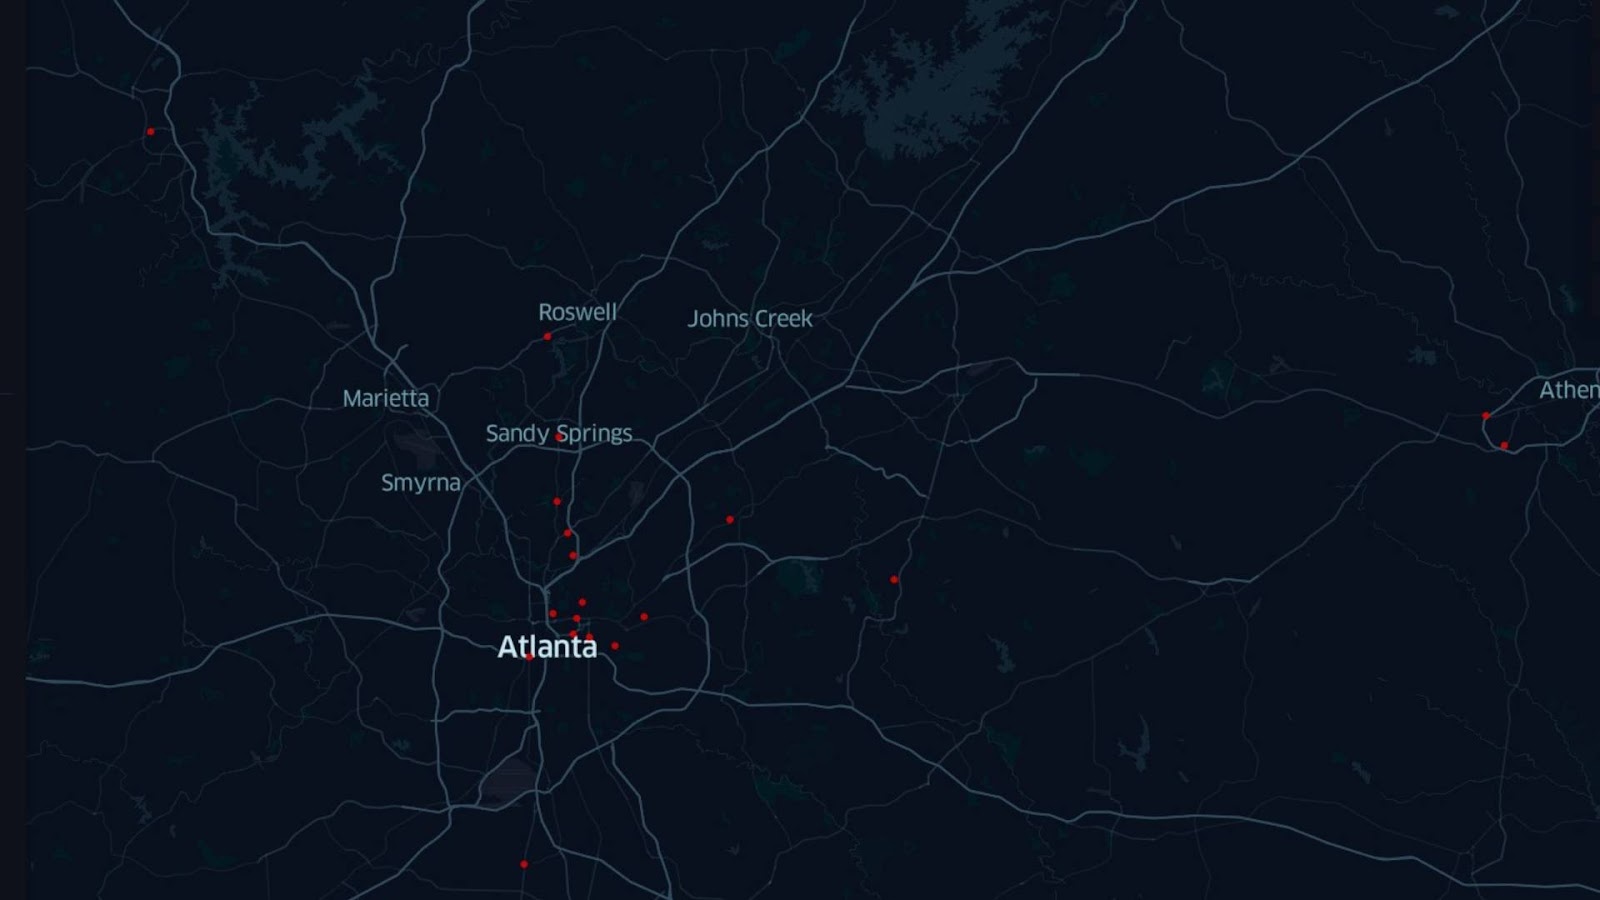
- Exploring, refining, and visualizing my lead lists for the final two articles.
This exercise in lead generation provides a glimpse of the potential Foursquare POI has for location-based storytelling. In this example, Atlanta’s most accessible places seemed impossible to find among more than 500,000 other POIs. By leveraging this valuable resource, storytellers and adventurers alike can create immersive narratives that guide travelers off the beaten path and into the heart of authentic experiences. Take a moment to consider your own travels and audiences. How could Foursquare POI data enrich your adventures? Reach out to them! They would love to hear your ideas! As an avid traveler, here are six ideas I came up with to get your creative juices flowing:
- Create Personalized Travel Packages or Itineraries: Use data attributes to tailor travel packages based on individual preferences, such as diet type or price range.
- Event Planning: Identify venues with specific amenities, vibes, and price points to host events or conferences.
- Loyalty Programs: Collaborate with popular establishments (based on the ‘popularity’ attribute) for exclusive deals for loyalty program members.
- Interactive City Maps: Create digital maps highlighting different categories of POIs that travelers can use to plan.
- Seasonal Promotions: Use the ‘hours’ attribute to promote establishments with extended hours during holiday seasons or special events.
- Local Collaborations: Identify local establishments (non-chain) for exclusive traveler experiences or behind-the-scenes tours.


