Discovering real world places and keeping their information up-to-date is a challenging problem, due to their ever changing nature. In this blog post, we will explore how Foursquare builds a robust view of places using a combination of human and machine intelligence.
There are millions of public places and points-of-interest around the world. Coffee shops, store locations, airports, bus stops, and so much more. But building and maintaining a dataset tracking all the places in the world is extremely difficult and time-consuming. Organizations that need this data find it far more efficient to rely on a trusted data provider than to assemble this data set themselves. Foursquare has spent over a decade building the world’s largest dataset of over 200 million points-of-interest (POI) around the world. Foursquare Places has 100% coverage of the top-100 retailers and QSR chains in the US and around the world. Each record includes information such as the address, city/state/zip/country, latitude/longitude, and other rich and relevant attributes that provide full geospatial context for each place.
Foursquare Places data is used by companies in a wide range of vertical industries across Retail, CPG, Real Estate, Financial Services, Tech, and more. Uber, for example, uses Foursquare Places to help power Uber search in their app to help riders find and get rides to specific locations on a map. Coca Cola ingests Foursquare Places data into their data warehouse to inform their sales team on new store openings, helping grow their business by adding more stores where Coca cola products are sold. Each month, Foursquare adds and updates hundreds of thousands of data points to maintain the correctness and consistency of the data in accordance with the real world. The physical world is constantly changing — stores open, move, or close — so it’s important that the data represents the truth of the world around us.
In this blog, we’ll explore the engineering processes that Foursquare uses to maintain a global dataset of 200M+ POIs and ensure that customers can trust our data.
Overview
Foursquare builds its Places dataset in several stages: a) ingestion, which aggregates data points from various sources including web-crawls, trusted partners, and Foursquare app users, b) resolution, which combines all the inputs from various sources to create a self-consistent record of each place, c) summarization, which applies heuristics and models to build an authoritative view of the place, d) calibration, which scores each record on how much it deviates from its real world representation along various dimensions such as the reality score, status (open or closed for business), and the accuracy of its attributes, and e) filtration, which removes the records that do not meet our bar of quality. We deliver finalized datasets to our customers as a flat file and through our APIs.
Ingestion
Foursquare ingests data from four kinds of sources: a) various websites containing data on points-of-interest that our web-crawlers extract, b) listing syndicators, who work with Foursquare to help businesses improve their online presence, c) trusted partners who specialize in maintaining data on specific categories of places (such as gas stations or restaurants) in specific regions, and d) the active users of Foursquare mobile apps.
Our web-crawler searches thousands of websites to gather all publicly available data about places and stores the data in an internal cache. Then, we apply a set of validation and formatting rules to standardize the representations of attributes in various regions. For example, our rules use text patterns to identify postal codes in Australia, validation lists to confirm townships in Taiwan, and so on. We also receive batches of updates periodically from our trusted data partners and listing syndicators. And finally, the active users of our Foursquare Swarm and City Guide mobile applications provide us information about new places and updates to existing places.
At the end of this ingestion stage, we have a list of canonical inputs corresponding to every place, organized by source (specific website, specific user, or specific data contributor). In the rest of the document, we will refer to these as source inputs.
Resolution
In the resolution stage, we map the source inputs to either an existing record of a place in our database or a new place that doesn’t yet exist in our database. To do so, we run the source inputs through a multi-step entity resolution process:
- Candidate Generation: First, we identify potential matches with an existing place by querying all the places in our database indexed by their key attributes.
- Similarity Scoring: Then, we use our resolve model to generate a similarity score. The resolve model is a machine learning model that compares two POIs for similarity, which we continuously retrain on a multi-country and multilingual dataset with human-annotated labels.
- Place Mapping: Finally, we match the source input to the place with the highest score, provided this score is higher than a predefined threshold. Source inputs that do not get matched with existing places with a high enough score trigger the creation of new entities.
At the end of this resolution stage, we have all the source inputs mapped to either an existing place in our database or a newly created place.
Summarization
Once we’ve ingested and resolved groups of inputs related to a place, we use a process called “Summarization” to determine the best attribute values for each place. We run the summarization process separately for each attribute, and the strategies we use for summarization differ from attribute to attribute. The following are a list of strategies that we use for different attributes:
- Weighted Mode Summarization: We use consensus voting among the inputs in a source cluster to pick the most frequently-suggested value (e.g. 3 inputs said the postcode is “90210” and 1 said “90211”). However, we refine this model further using calibrated weights for the vote values based on ground truth analysis that scores each source based on its historical accuracy as judged by human annotators. We’ll talk about how we calibrate sources (both digital and human) in a separate blog post.
- Model-based Summarization: For certain attributes such as geocodes, we use ML models that use spatial context (such as adjacent roads and buildings) to determine the geocode from the list of candidate inputs from various sources. The models are trained with labeled datasets that mark the POI centroid geocodes. We use custom loss functions to make the models learn from cases where the input source and the ground-truth labeled geocodes lie on a different building or on opposite sides of the road.
Calibration
One of the key challenges of maintaining a reliable location dataset is measuring the quality of every place in the dataset rather than a random or a curated sample. Foursquare has developed several models that help us calibrate how closely each place in our data set conforms to its real world reference. We use the following scores to continuously identify gaps in our data and improve the quality in a measurable way:
- Venue Reality Score(VRS): The Venue Reality Score is an indication of how ‘real’ (meaning, accessible to the public at a fixed location) we think a place is. The Venue Reality Score is generated by an ML model that uses POI attributes, the sources of the POI inputs, visits throughout time, etc., as features. The model predicts a score that is then binned into 4 buckets: Very High, High, Medium and Low. Low indicates that the place is not real, while Very High and High indicate that the place is considered real. The Medium bucket indicates that we do not have enough signal from our sources to determine whether the place is real or not. We analyze places in this bucket on a regular basis to identify opportunities to improve the signal or flag any miscalibrations by the model.
- Closed Score: The Closed score is an indication of whether the place is currently operational. The ML model generating the Closed score uses features including POI attributes and input source information; time-sensitive features like checkin and review/tip patterns available to us. An important feature in this model is the feedback we get from the clients of our API. Whenever a client calls our ‘Nearby Places API’ with a specific location (lat/lon), we respond with an ordered list of candidate places. The client then invokes the ‘Report Nearby Place Selection’ API to let us know about which place was selected from the list returned. The predicted score is binned into 5 buckets: VeryLikelyClosed, LikelyClosed, Unsure, LikelyOpen and VeryLikelyOpen.
- Attribute Accuracy Score: This score was recently added to determine the accuracy of the attributes attached to a place. We implemented a veracity-inspired algorithm to evaluate the accuracy of an attribute value (e.g., POI name, address, etc.) that results from the combination of multiple potentially conflicting input sources. The algorithm weighs positive inputs that support the entity attribute value (agreeing inputs); penalizes conflicting inputs with a different attribute value than the entity one (disagreeing inputs); and applies a time decay factor, to penalize agreeing or disagreeing inputs based on the time period since they were last ingested, in order to favor input sources that we ingested more recently. After calculating the confidence score for each attribute of any POI, we additionally rank the POIs of a country for each attribute separately, and assign a percentile label based on the ranking of the confidence score, as one of p99, p90, p75, p50, or p0: e.g., p99 if a POI attribute score lies in the top 99% of the confidence scores for this attribute. This allows us to do two things: a) sort the POIs based on the accuracy score of specific attributes and b) differentiate sources providing reliable inputs from those that are not.
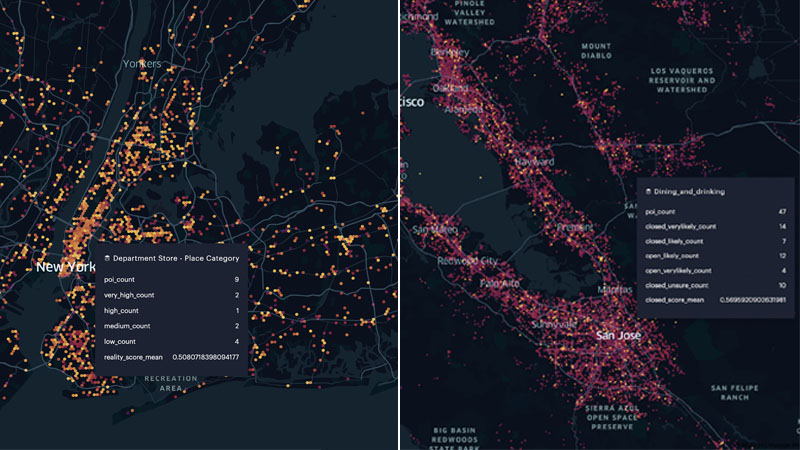
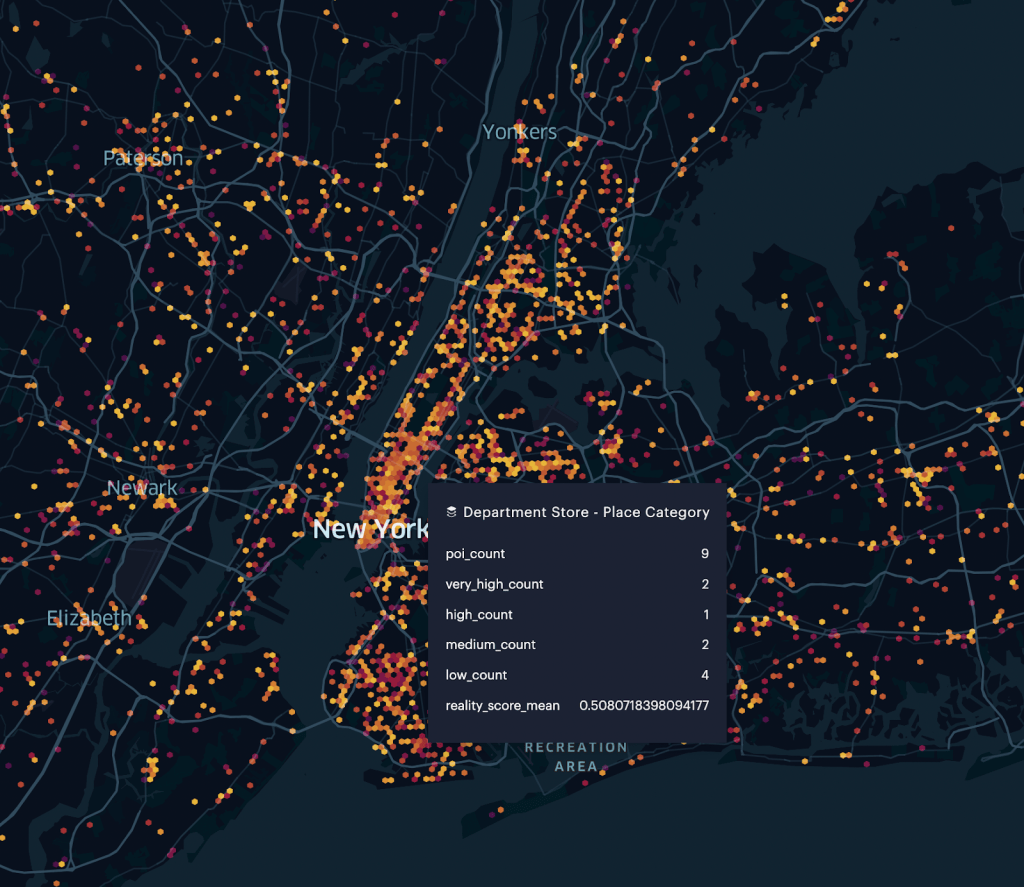
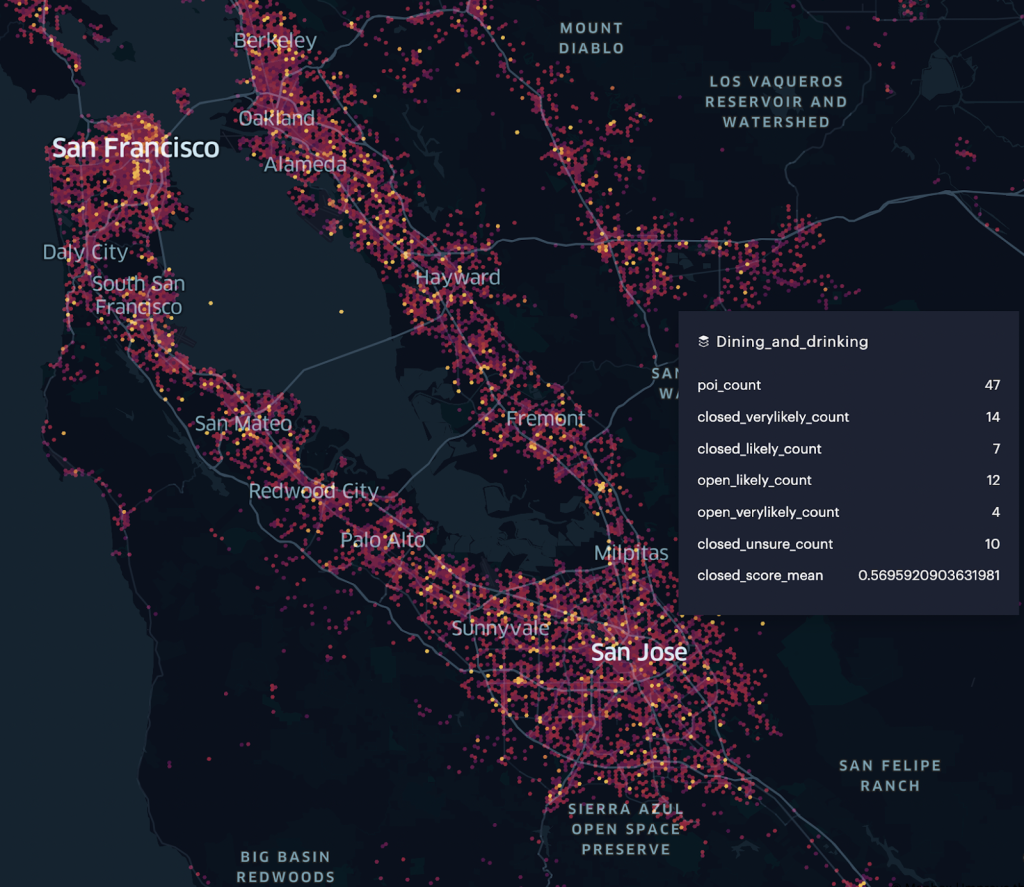
The above metrics provide a window into the quality of our dataset across different regions, states and localities, along each of these dimensions. We use Foursquare Studio to visually analyze and identify geographies & categories where we have low quality POIs – see visuals below. We then use a multitude of techniques such as pruning bad sources, identifying new sources that specialize in a specific category & geography, and leveraging the network of Foursquare app users to make quality improvements in a measurable way. We will go into the details of our Quality Framework and the process we use to drive continuous improvements to our Places data in a separate blog post.
Filtration
After all the place records in our dataset are scored, we perform various checks on the record to determine their eligibility for inclusion in the final dataset delivered to our customers as a flat file or through our APIs. In this step, we verify whether a) the key attributes of a place record are populated, b) the reality score of a place and the accuracy of key attributes cross a certain threshold, and c) there is at least one credible source contributing to each of the attribute values. We also perform some additional semantic checks to make sure two attribute values on the same record are not in conflict with each other, for instance, a zip-code not matching the city. The records passing these verification checks are released to our customers.
Release
Another interesting challenge in maintaining the integrity of our dataset is keeping track of any problems that may occur between releases. In this section, we will walk through some of the guardrails we set up to prevent regressions in our datasets.
There are two events that trigger a change to the Places dataset. This section will detail how we manage those releases: a) there is a new batch of data available from a specific source or a set of sources, and b) there is a new version of the summarization algorithms or the calibration models available. Each of these changes are tested in a staging pipeline, where all the above steps are run, on a specific snapshot of the production data, and a report is generated to understand the delta between the newer version of the places after the code or data changes are applied.
The report checks for a variety of dataset changes such as changes to attributes, changes in distribution of key quality scores described in the section above, and other custom programmatic checks. The report calculates these metrics and compares them against predetermined thresholds to flag any changes that are suspicious for additional review. Additionally, any changes to our golden dataset containing popular & curated places are also flagged. Then we determine whether these changes were expected (for example as a response to some code change we made or the data we ingested), or if they represent a potential problem and need further investigation. After reviewing potential regressions, Foursquare’s engineers can approve the QA report, and those data changes will be merged into the production dataset.
Conclusion
In this blog post, we outlined the systems and processes that Foursquare employs to generate a reliable dataset of places worldwide. In subsequent blog posts, we will dive into the details of our Data Quality Tracking framework, and how our network of loyal Foursquare app users helps preserve the quality of our data.
Authors:
Foursquare Engineering: Vikram Gundeti, Horace Williams, Jorge Israel Pena, Zisis Petrou & Dave Bortnichak
Foursquare Product: Sandhya Nallarkkiniyan & Jen Foran


