Did you tune into our webinar about the H3 geographic global grid system? Or perhaps you read through our follow-up article recapping The Power of Hexagons. Or maybe you just have questions about working with H3 in general. Whatever the case, you’ve come to the right place – we’re here to answer all your burning questions about using H3 to make sense of your data.
How does H3 compare with Google’s S2 library?
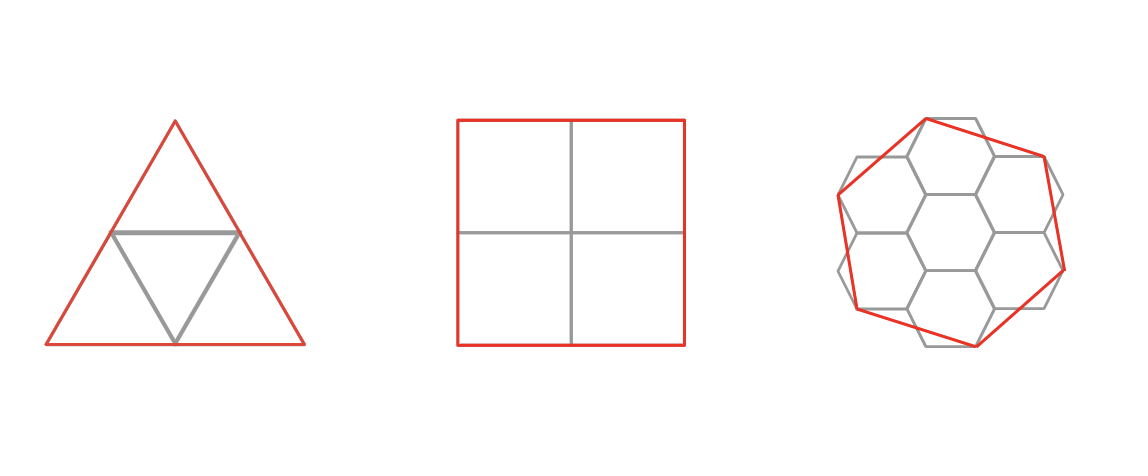
H3 and S2 both represent discrete, multi-resolution global grids. The most obvious difference is the choice of cell shape: hexagons in H3 vs. squares in S2. As discussed above, these shapes lend themselves to different use cases – S2 works well when exact aggregation and subdivision are needed, H3 shines in use cases where neighbors and grid traversal are important. H3 also boasts a broader array of bindings in different languages, making it more accessible for many projects. You can see a more comprehensive comparison on the H3 website.
How is H3 used in the Unfolded platform?
The Unfolded Studio application does not depend on H3, but it supports H3 data in various ways, including providing high-performance H3 visualization layers, supporting H3-based joins, and offering H3 functions for custom calculations. H3 is also a core technology for a number of upcoming features focused on data enrichment, unification, and analytics.
How can you use H3 for more familiar audiences with admin boundaries like counties or neighborhoods?
Administrative boundaries are generally the result of history, legislation, and physical geography (rivers, coastlines, etc.). If these boundaries are important to your use case, by all means, use them! For example, it would make little sense to use H3 for an electoral analysis in the US because the exact boundaries of electoral districts are important to the use case.
In many cases, however, the reasons that define administrative boundaries may be irrelevant to your use case. ZIP codes represent postal delivery zones. Neighborhood boundaries often represent real estate considerations. If you are not a postal worker or a realtor, choosing a unit of analysis that is not bound by spurious concerns can remove important sources of bias.
It may be harder, however, to communicate H3-based analysis to an audience. Using a visual representation like the maps you can create in Unfolded Studio is generally more effective than explaining the trends you see in text or charts. If necessary, you can also convert your H3-based data back into familiar admin boundaries by bucketing and aggregating H3 cells into known shapes, allowing you to leverage H3 while still communicating your results using familiar geographic labels.
How does H3 support big data use cases?
While the H3 library provides fast, efficient grid operations, it doesn’t in and of itself offer analytic functions for large datasets. However, by dividing the world up into well-defined equal-area cells, H3 makes it straightforward to partition datasets by geography, add spatial indexing to large amounts of data, and perform efficient geographic queries. H3 lends itself well to scalable distributed systems, including key-value stores like Cassandra, and is generally much more efficient for analysis than a traditional point or polygon data.
How can you apply H3 to remote sensing data?
Remote sensing data can be difficult to work with because of its scale and because joining it with other geographic data generally requires specialized tools and knowledge. Unfolded is actively working on methods to efficiently transform remote sensing data in a raster format to H3, making it a much easier target for data unification and analysis without custom image processing techniques.
While the technical aspects of this transformation can be challenging, it’s conceptually quite simple: H3 cells can be used to bucket the pixels from raster data, aggregating them by sum or mean depending on the use case. This effectively moves the data from the ad-hoc grid of the raster image to the uniform global grid provided by H3, making it easy to apply grid-centric algorithms and join with other data indexed to H3 cells.
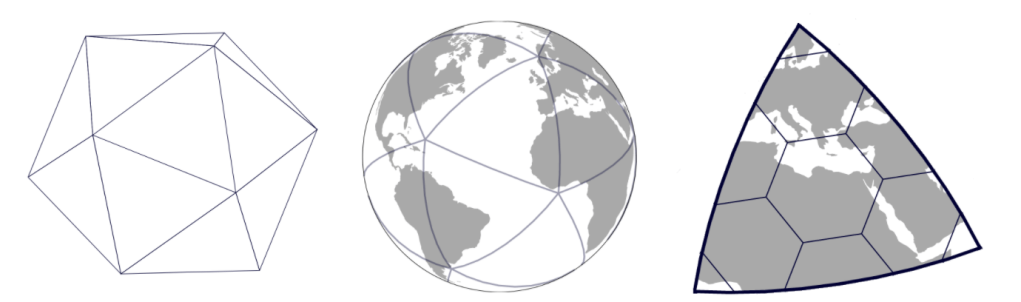
How can H3 tile the entire globe with hexagons?
The short answer: It can’t. It’s not topologically possible to tile a sphere with only hexagonal cells. At each resolution of the H3 grid, there are exactly 12 pentagons, with only five neighbors instead of six. The good news is that the H3 grid has been oriented to place these pentagons over water, out of the way of many common datasets, and in many cases, they can be entirely ignored. However, if your use case involves, e.g., whole-Earth modeling, you may need to adjust your assumptions about uniform cell shape accordingly. The algorithms in the H3 library all handle pentagons appropriately, and H3 offers the h3IsPentagon function to help you take evasive action when needed.
Can I change the orientation of the underlying icosahedron, e.g. to move the pentagon cells?
No, not without forking the H3 library and putting in significant development work. We chose the current orientation as a compromise that seemed to meet many real-world use cases, and you couldn’t change it without effectively creating your own custom grid system.
Since H3 cells don’t exactly contain their children, how can you move data up and down the grid hierarchy?
The answer to this question depends heavily on your use case. For example, if you have data indexed at H3 resolution 5 and you want to display or analyze it at resolution 4 or 3, you have two choices:
- Re-index all your raw data at the new resolution. This option is best if you care about exact containment – for example, if it would be a problem for a given point to end up outside of the boundary of the cell it’s indexed to. This might be the case if you need to join with other data indexed at resolution 4, and you need your aggregation to be exact.
- Take the parent index of each resolution 5 cell and re-group. This is generally a much faster option. Despite some margin of error, it’s often sufficient for specific use cases – for example, the error is unlikely to matter in many visualization scenarios. At the same time, the increased speed may be essential for user interaction.
It’s also worth noting that there are two different ways you could think about a parent index. For some use cases, you might care about the exact boundaries of the parent and whether all data you’re indexing falls within that area. For other use cases, you may be using the parent/child hierarchy as an organizational structure, not a strictly geographic one – in which case the parent index is effectively a shorthand way to refer to all of its children at a given resolution. This is the logic behind H3’s compact and uncompact functions, which use coarser indexes to efficiently represent the set of all their children at the target resolution.
See this Observable notebook for more discussion and an interactive example.
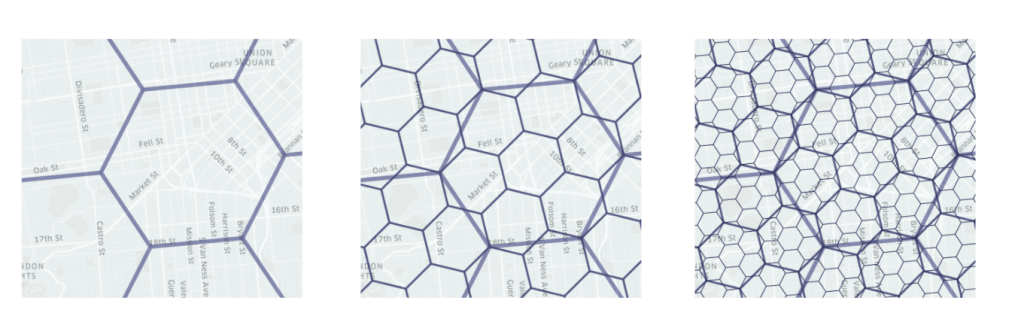
Why does H3 include exactly 16 resolutions, and why were these resolutions chosen?
The H3 resolutions are the direct result of several choices made in the design of the grid:
- The choice of base cells
- The “aperture” of the grid system (i.e., the scale relationship between different resolutions)
- The size of the H3 index in bits
In each of these cases, the grid could have been designed differently, but the selection made in H3 seemed like the best available option for the use cases we considered. For a thorough discussion of these trade-offs, see Sahr et al., 2003.
Base Cells
H3 uses 122 base cells laid out on the 20 faces of an icosahedron (a full technical explanation can be found here). These top-level cells comprise “resolution 0”, and all further cells are derived from them. These cells were selected to provide relatively low spatial distortion across the grid and minimize the impact of 12 pentagon cells at each resolution.
Aperture
Each H3 resolution results from subdividing its parent resolution by 7 (also known as aperture 7 grid spacing). There are different possible apertures and orientations of child cells, but aperture 7 provides the closest approximation of parent-child containment while minimizing the step-change in cell size between resolutions.
The H3 Index
The H3 library represents an H3 index using 64 bits, which is convenient as many systems can represent it as a single integer that can effectively store, transform, and use in operations. The index is hierarchical, meaning that the “address” of a given cell is expressed as the number of its base cell followed by the direction 0-6 of its ancestors at each level, e.g. “Base cell 10, child 3, child 1, child 5, …”. Given the size limitation of 64 bits, we can fit a maximum of 16 resolutions into the index.
You can see an interactive example of the bit layout here.
Is there a simple numeric relationship between an H3 index and its children and/or neighbors?
As explained above, H3 indexes are represented using integers. The structure of these integers allows us to make the following assertions:
- An H3 index is always lower than the indexes of its children and descendants
- All the descendants of an H3 index are lower than the next highest index at the parent resolution.
- If two indexes are numerically close, they are also geographically close.
However, the indexes are not sequential integers in the traditional sense, so you can’t request an integer range to cover a given geographic area. It’s also not guaranteed that geographically close indexes are numerically close – you can have neighbors with different base cells with dramatically different index values.
Join the Unfolded community to chat H3
If you missed it, check out our intro blog to H3. For more information and to share questions, insights, and maps with other Unfolded users, join the Unfolded Community on Slack. We’d love to keep the conversation going.