How grid systems can be used to make sense of complex geographic data
The real world is a tricky place for data analysis. It’s filled with natural and man-made features of every size and description, not to mention animals, people, vehicles, weather, and other entities that refuse to stay put. In a word, it’s a mess.
Maps abstract this mess into simpler forms, allowing us to better comprehend large-scale features and patterns. But in many cases, map data is still too messy for straightforward analysis – geospatial data may include points, lines, and polygons representing a wide array of features that are difficult to compare or visualize, let alone analyze in any meaningful way.
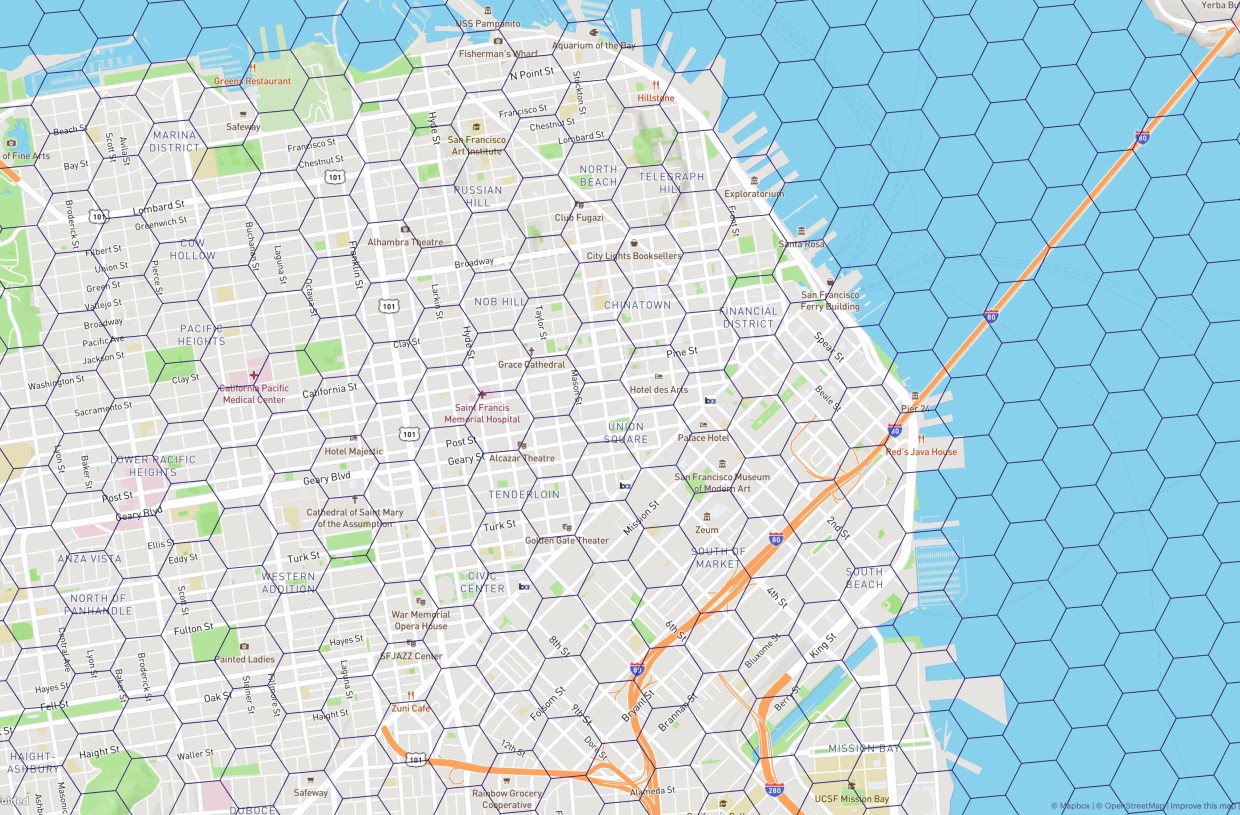
This is where geographic grid systems come in. Geographic grid systems – also known as discrete global grids – apply a different kind of abstraction. They divide the world into uniform cells, moving all geographic data into a common unit of analysis that is unbiased by natural and human processes, supporting new types of algorithms that are hard to implement with traditional geographic data. Grid systems take all of this real-world mess and move it into a clean, mathematical space that’s far simpler to work with, transform, and analyze.
- Compared to points, grid systems allow analysts to easily aggregate data, calculating statistics for groups of collocated features.
- Compared to administrative boundaries, grid systems offer comparable areas, unbiased by history, politics, or landforms.
- Compared to ad-hoc bins, grid systems offer stable, portable identifiers supporting joins and integration.
Our Friend the Hexagon
The H3 library, originally developed by Uber, has emerged as one of the leading options for discrete global grids. While there are other grid or grid-like systems in use, including Google’s S2, Quadkeys, and more, H3 stands out for its multi-language support, its active community, and of course for its most distinguishing feature: hexagons.
Why hexagons? There are many shapes that can tile the plane. What makes one shape or another a better choice for a geographic grid system?
There isn’t one right answer to this question, as it depends heavily on the specific use cases you care about. But for a general purpose grid system like H3, there are a number of features that make a grid more useful and consistent for analysis:
- Uniformity: All grid cells should have the same shape, the same area, the same edge length, and the same angles. Consistency in these features yields grid cells that are easily comparable no matter where they fall on the globe, and allows us to treat all grid cells equally in algorithms and analysis.
- Optimally compact: An optimally compact shape has the least mean distance from its center to any contained point, yielding the most accurate representation of the data indexed to a given cell, and has the lowest perimeter for its area, leading to fewer boundary effects.
- Optimally space-filling: An optimally space-filling cell can cover an arbitrary polygon with the lowest margin of error, yielding better representations of real-world areas and administrative boundaries.
- Uniform adjacency: An ideal grid cell would be equidistant from all of its neighbors, touching only on edges, not corners. This greatly simplifies algorithms that rely on traversal (moving from one cell to another), as all neighboring cells can be considered equivalent.
- Hierarchical relationships: Discrete global grids are often built as a set of grids at increasingly finer resolutions. Ideally these different levels support parent-child relationships, with finer cells perfectly subdividing their coarse parents. This supports incremental aggregation and disaggregation up and down the grid – for example, you can calculate the sum of some value in a given cell by adding up the values of its children.
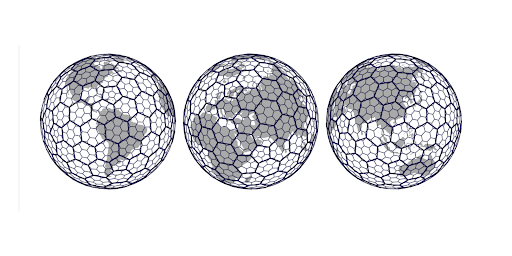
- Low shape and area distortion: As any mapmaker knows, it’s not generally possible to perfectly represent a three-dimensional area on a flat plane, and the reverse is true as well. Applying a two-dimensional grid to the Earth often involves trade-offs in the shapes and areas of the cells, depending on how we’re able to project the grid onto the globe. Geographic grid systems generally try to minimize this distortion in order to keep cells comparable across the world.
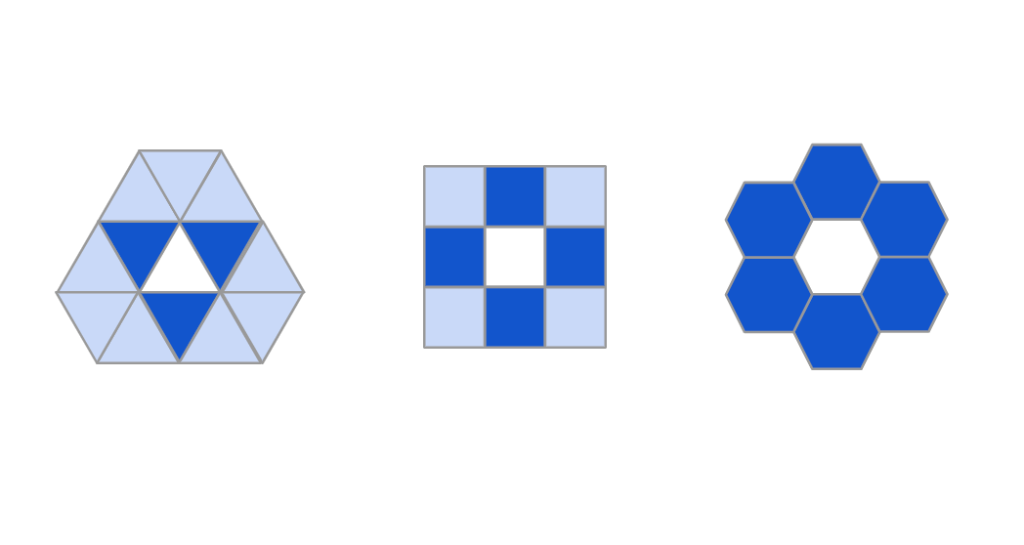
The requirements of uniformity restrict us to regular polygons, and there are only three which can tile the plane: triangles, squares, and hexagons. Of these, hexagons get the highest marks in many of the categories above: They are the most compact, the best at space-filling, and we can project them in a way that minimizes shape and area distortion.
Crucially, they are also the only option with uniform adjacency to their neighbors, which makes a hexagon grid a strong choice for traversal algorithms like smoothing, interpolation, or clustering. While they are not quite as good as squares are parent-child relationships – you can’t make a true hexagon out of smaller hexagons – with a clever arrangement we can give each hexagon seven children that are nearly contained, with a low margin of error that’s sufficient for many use cases.
The H3 Library
The H3 library leverages the power of hexagons to create a global grid system with 16 resolutions, from 0 (the size of a small continent) to 15 (less than a square meter). H3 is Open Source, with a large user community, and written in C, which makes it extremely fast and portable. Bindings are available in many languages, including Python, Java, JavaScript, and more.
The library includes a range of optimized, efficient functions for working with the grid, including indexing points to cells, moving up and down the hierarchy of grids, and traversing between neighbors.
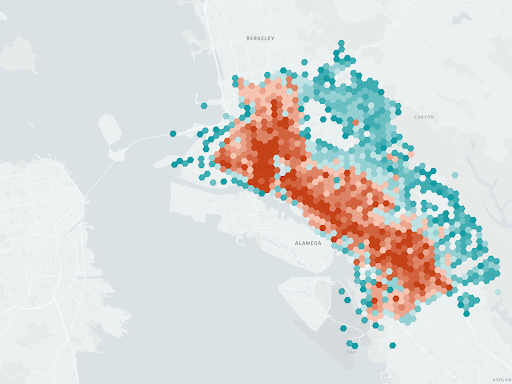
While the H3 library itself doesn’t perform geospatial analysis, it provides the core building blocks for a range of analytical functions, including many we use in Unfolded Studio. The most common is binning data, usually associated with specific point locations, to equal-area cells, where it can be aggregated by count, sum, or another statistical function. For example, in the following image, event data from Oakland has been binned to cells at resolution 9 and then visualized, with higher values encoded in red.
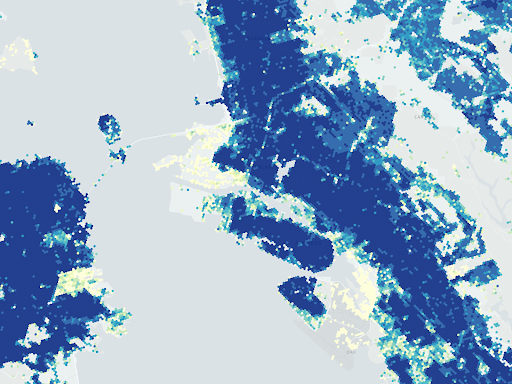
Using a grid system provides a common unit of analysis across different datasets, making it easy to join this data with other sources, such as this population dataset.
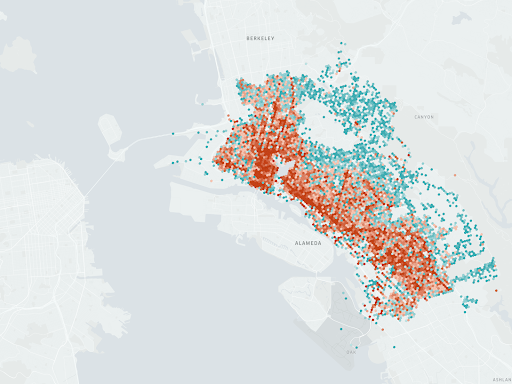
Joining these datasets allows us to easily normalize the event data by population, so as not to over-represent highly populated areas.
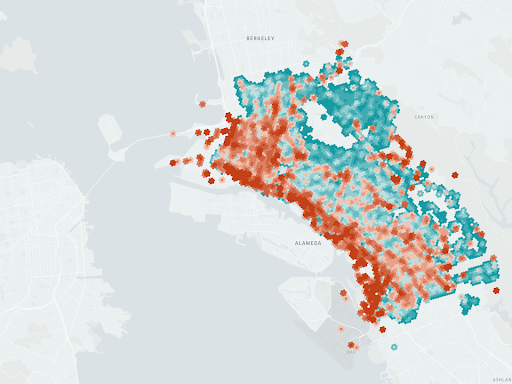
Using H3’s traversal functions, it’s fairly straightforward to implement additional transformations or analysis on top of this data. For example, in the following image we’ve applied a smooth function to better interpolate values in areas without data.
This just scratches the surface of the kinds of use cases H3 can support, including:
- Spatial indexing
- Radius search
- Raster conversion
- Clustering
- Suitability analysis
- Surface interpolation
- Similarity analysis
- Anomaly detection
- Forecasting
- Flow analysis
While a geographic grid system like H3 shouldn’t be the only tool in your geospatial toolkit, it’s a hugely valuable way to take some of the mess out of your geographic analysis. H3 turns data operations that might be complex or impossible in traditional tools into straightforward set operations that are easy to reason about and implement. So, isn’t it time to try hexagons?
Learn more about H3 at h3geo.org. To try out Unfolded Studio, sign up for free at studio.unfolded.ai.