If you’re an analyst, product manager, or developer, you’re likely familiar with Grafana. You may even use the open-source software to better understand and visualize your system metrics, logs, and traces in one unified view.
This unified view is achieved through operational dashboards that users can build using a variety of panels to construct the right queries and customize it to their use case. Panel plugins allow you to add different types of visualizations to your dashboard, such as maps, clocks, pie charts, lists, and now, Unfolded Studio maps.
That’s right. You can now add Unfolded visualizations and analyses to your dashboard using the Unfolded Studio Panel now available in Grafana.
Wait, what is Unfolded?
Unfolded is Foursquare’s advanced geospatial platform designed to transform large-scale data into impactful visualizations and analyses at scale, faster than ever before.

Why did we create the plugin?
Location intelligence is not a new business tool, and continues to drive value for businesses across industries, from aviation to telecommunications. As adoption grows, so does the demand for more integrated geospatial solutions i.e. solutions that connect to the data and tools companies already use.
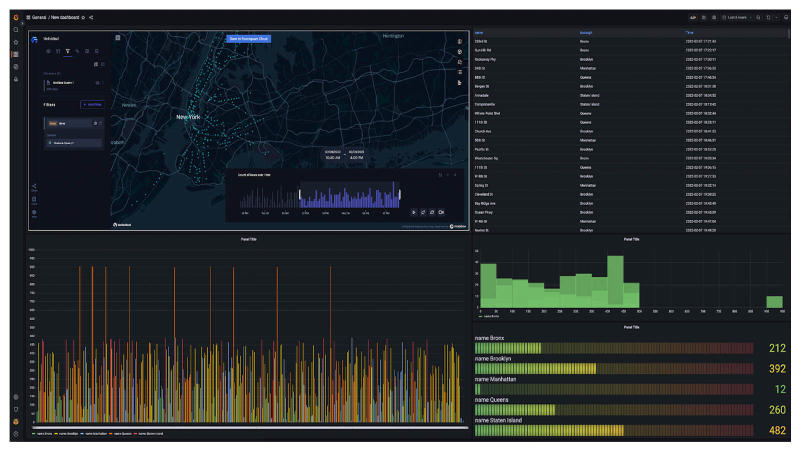
With the new Unfolded Studio Panel, any Grafana user can build location intelligence directly into their dashboards. The panel provides users with a global view (literally) into their infrastructure’s health and operations — allowing them to identify red flags and create more targeted solutions, faster.
How is this different from the Geomap plugin?
The Geomap plugin offers base map configuration, three map layer types, (markers, heatmap, and GeoJSON), and basic layer controls and mapping capabilities.
With the new Unfolded Studio Panel, users can access a variety of capabilities native to the Unfolded Studio platform directly from their Grafana dashboard. Discover advanced configuration, 4-map layer types such as Trip Layer, interactive split maps for comparing analyses, support for complex time-based analyses, and more.
What can I do with the plugin?
With the new panel plugin, users can take advantage of a variety of visualization techniques to display geospatial data in their Grafana dashboard such as:
1. Visualize points on a map

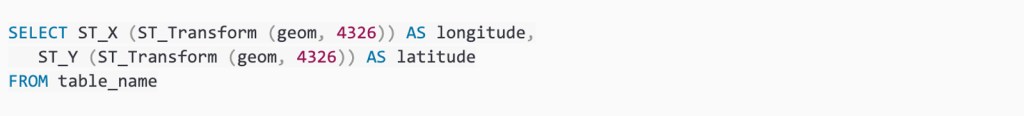
Visualizing the data as points on the map doesn’t require any time field, just the location. You need to provide the values for the latitude and longitude and then name these values exactly like that in the query.
Here’s an example of a query for getting the latitude and longitude against a PostgreSQL (with PostGIS) database:

It would be a similar query if you are using the geometry data type in PostGIS:
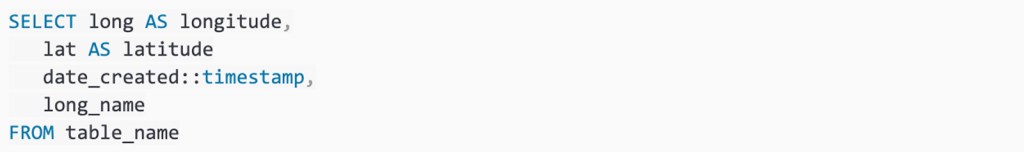
If you want to visualize more properties in the tooltip of the created points, you just need to add that data to the query:

2. Display a line based on passed timestamp

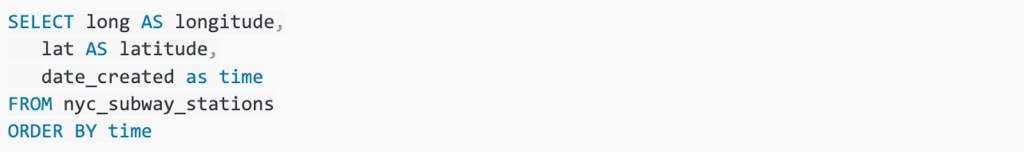
Similar to the creation of Points, to create a line that connects the points you need to provide the time value (as Unix timestamp) in the ascending order for the respective row. Keep in mind to name the properties in the query as latitude, longitude and time.
To show the line you need to toggle the Create line path from points to true in the panel options.
3. Animate time-based data with a Trip Layer

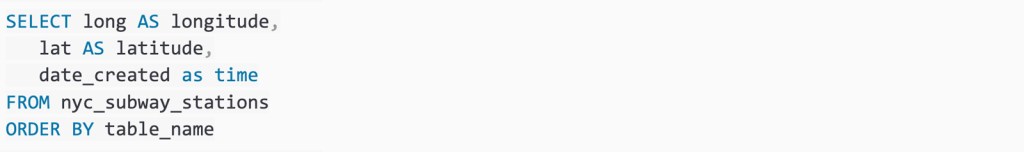
If you want to leverage more advanced features of Unfolded Studio, you can use a TripLayer and animate time-based data. Start by toggling the Enable animation to true in the panel options. To enable this option, Create line path from points must be set to true in the panel options. Same query as in the line creation should be provided.
This will create a TripLayer on the map and add a timeline animation control on the map.
4. Display a GeoJSON object
If you are able to leverage your database to get a single GeoJSON object, you can input it into the plugin in order to be displayed on the map. Keep in mind to name the value as “geojson_layer”.
Take a look at this example of a query for getting the GeoJSON LineString object against a PostgreSQL (with PostGIS) database:

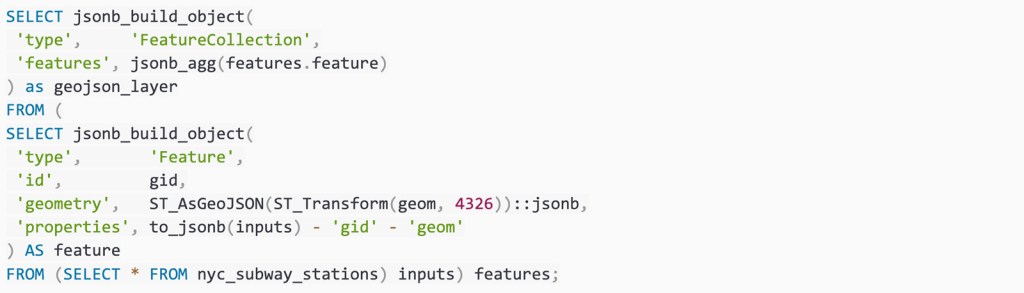
Similarly, below is an example of a query for getting the custom GeoJSON feature object with selected properties against a PostgreSQL (with PostGIS) database. This query will include all properties except for gid, geom values. The value should be named “geojson_layer” as well.
5. Add multiple queries
The plugin also allows you to add multiple queries where the result of each query will be added as a separate dataset and layer in the Unfolded Studio Panel.

Get started in Grafana
You can learn more and install the Unfolded Studio Panel here.
If you are running Grafana locally, you can clone or download the repository directly into the plugin directory of Grafana, and then reset the Grafana-server so that the plugin is automatically detected.See here for additional details on the installation process.