
Suitability Analysis – the process of evaluating the suitability of an area for a particular use or purpose – is more important than ever for businesses (or data-minded individuals) to make informed decisions. By analyzing different factors such as accessibility, competition, and demographics, Suitability Analysis allows businesses to identify the most compatible location for operations, thereby reducing risks, minimizing costs, and maximizing the potential for success.
Suitability Analysis helps to answer questions, such as:
- What areas of a nature preserve could best serve as a resettlement habitat for an endangered species?
- Where is the best location for a new housing development, business, retail outlet, restaurant, power station, etc.?
- Which neighborhood is optimal for a homebuyer with a set of requirements?
Foursquare Studio offers a Suitability Analysis module that evaluates site locations for a particular use case – it does this by computing a suitability score based on a set of user-defined criteria and weights. Then, Studio assesses each attribute from the provided dataset, returning a new layer revealing the most suitable locations.
Throughout the rest of this guide, we will go over how to use this module for purchasing real estate in the Denver, CO area. Let’s dive into some maps!
Performing a Suitability Analysis in Studio
First, let’s create a new map on Studio. For this example, we’ll add two datasets: one containing properties for sale in the Denver area, and another containing H3 indexes with time to school, bus stops, coffee shops, and restaurants.
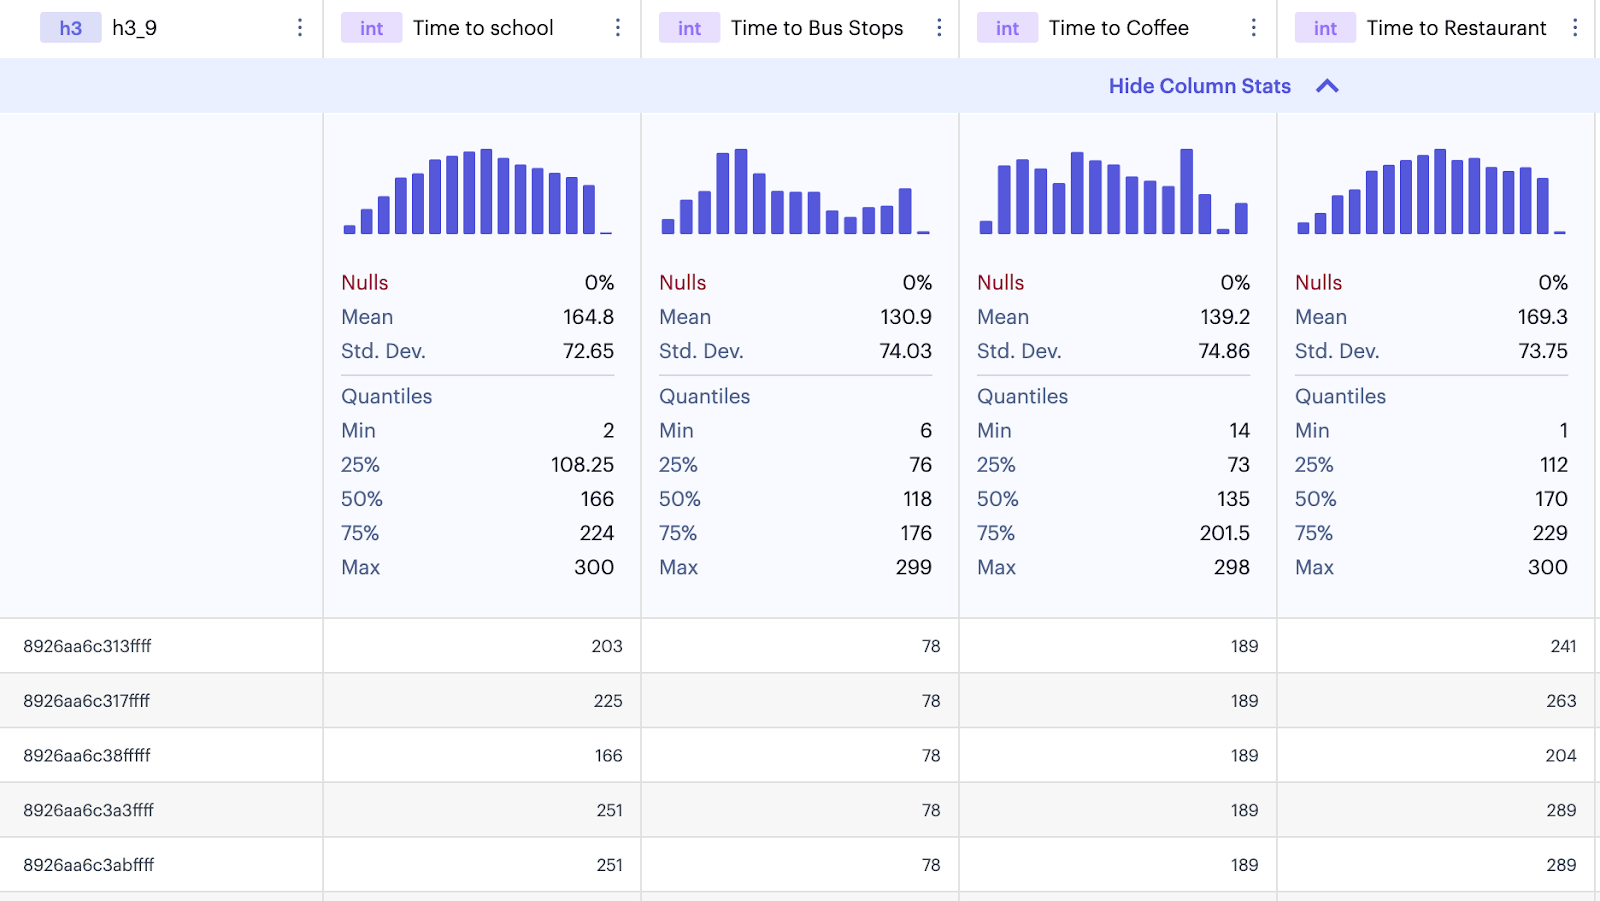
Upon creating a map, Studio will automatically generate layers for both of our datasets. Currently, this provides little-to-no insight into our search for the most suitable homes in the Denver area. Let’s start by hiding all but the “Time to Locations” layer.
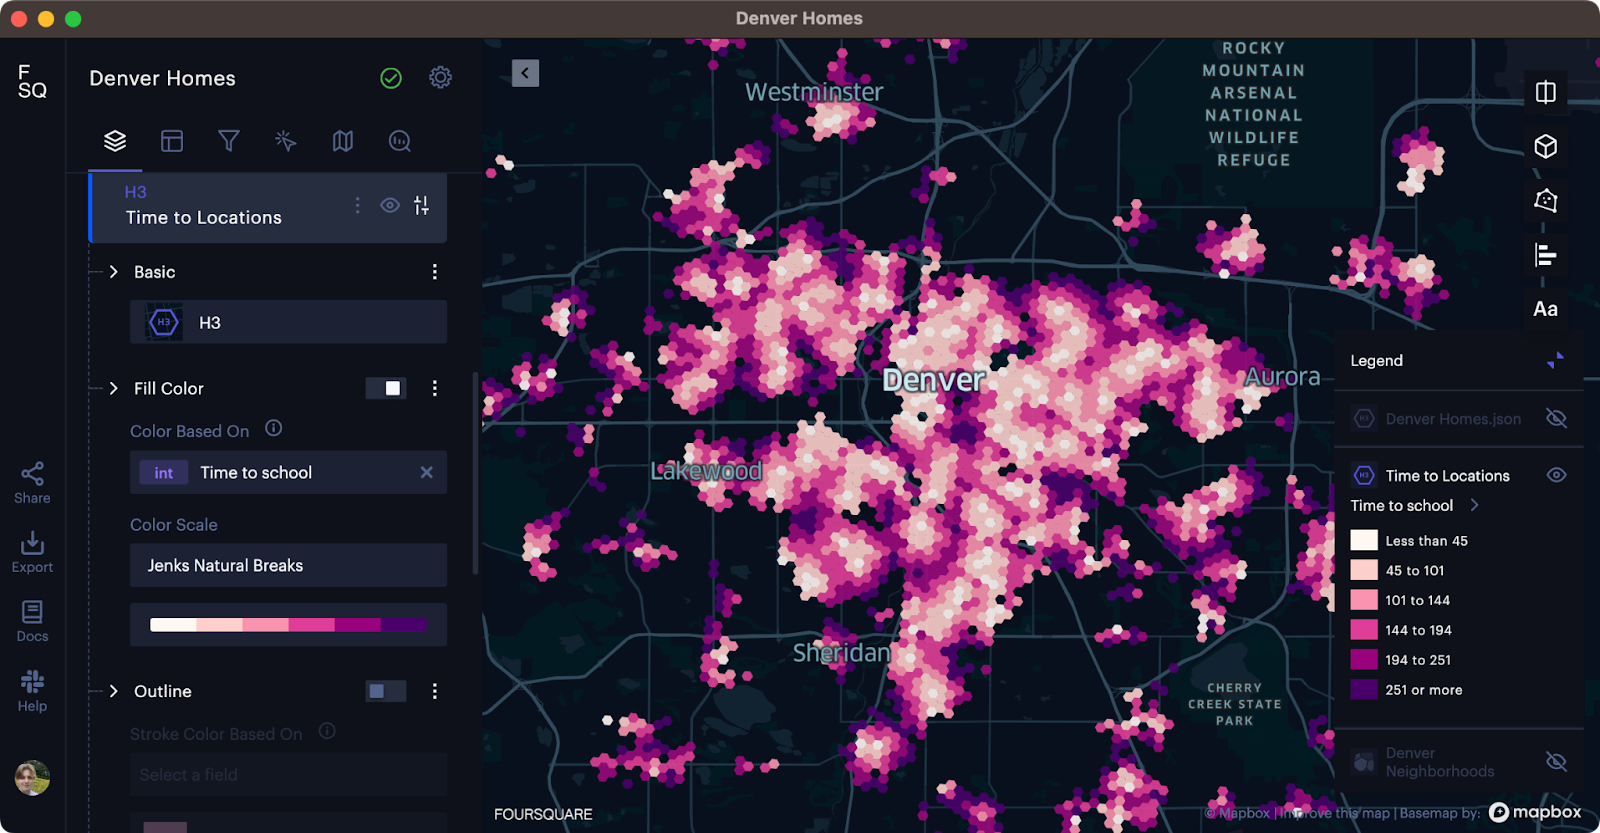
In the above image, lighter colors represent areas that are closer to schools, while darker areas represent areas that are located farther away. If the prospective homebuyer is a parent (and has no other considerations for buying a home), this map may provide some insight into the best locations to purchase. However, this map experience can be massively improved by using the Suitability Analysis module.
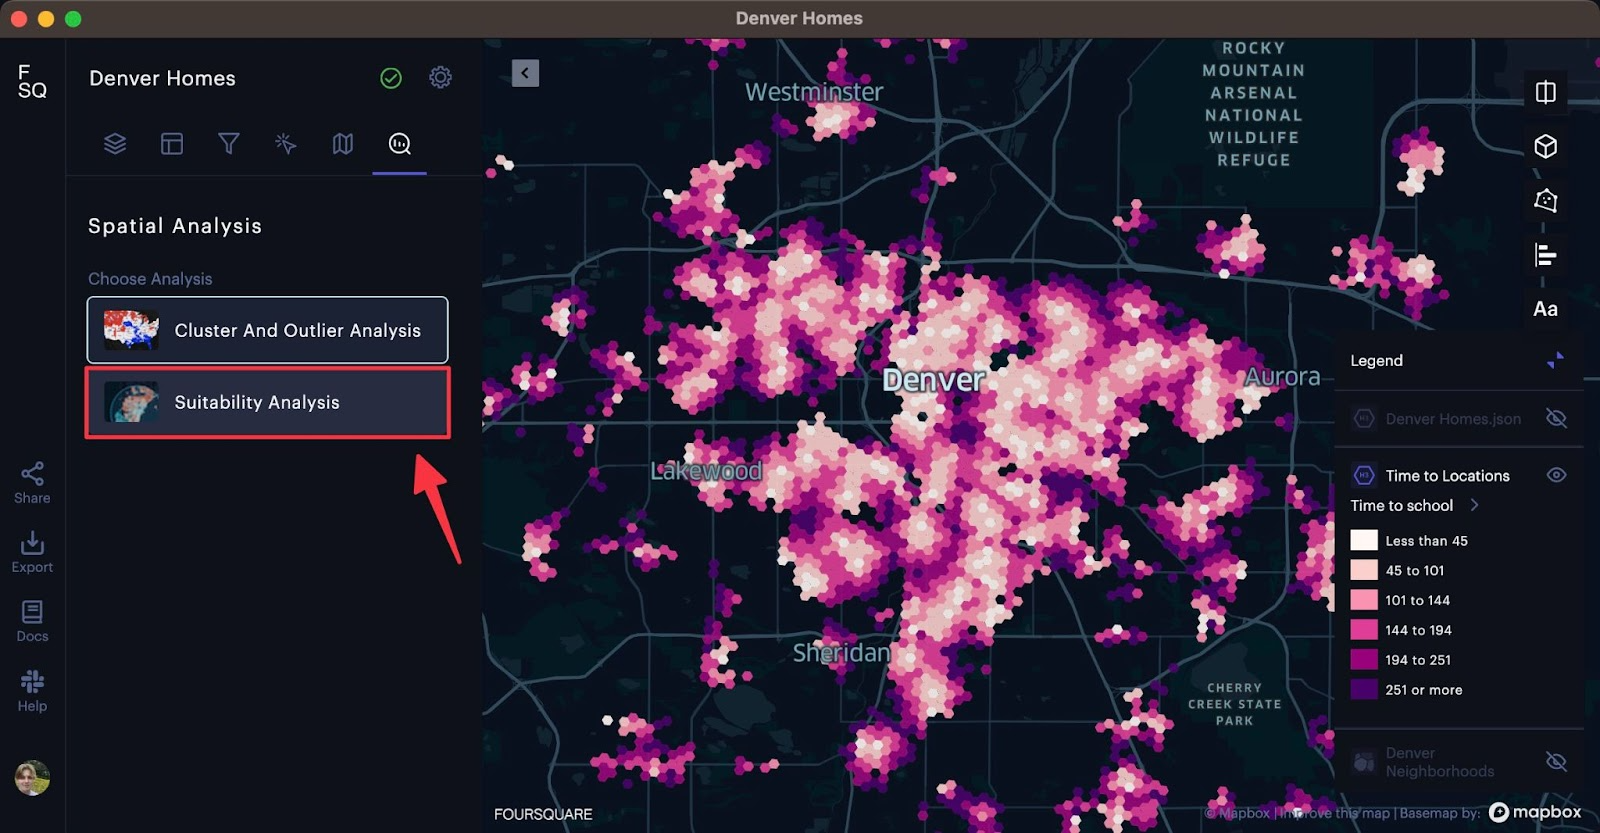
Navigate to the Analysis tab in the left-hand sidebar, then select Suitability Analysis.
Upon opening the module, you will be asked to select an input layer. Let’s select our “Time to Locations” as the input layer. We are now met with an interface that allows us to slide or enter a number from 0 to 1, with 1 indicating greater importance, and 0 indicating a lesser importance of the attribute.
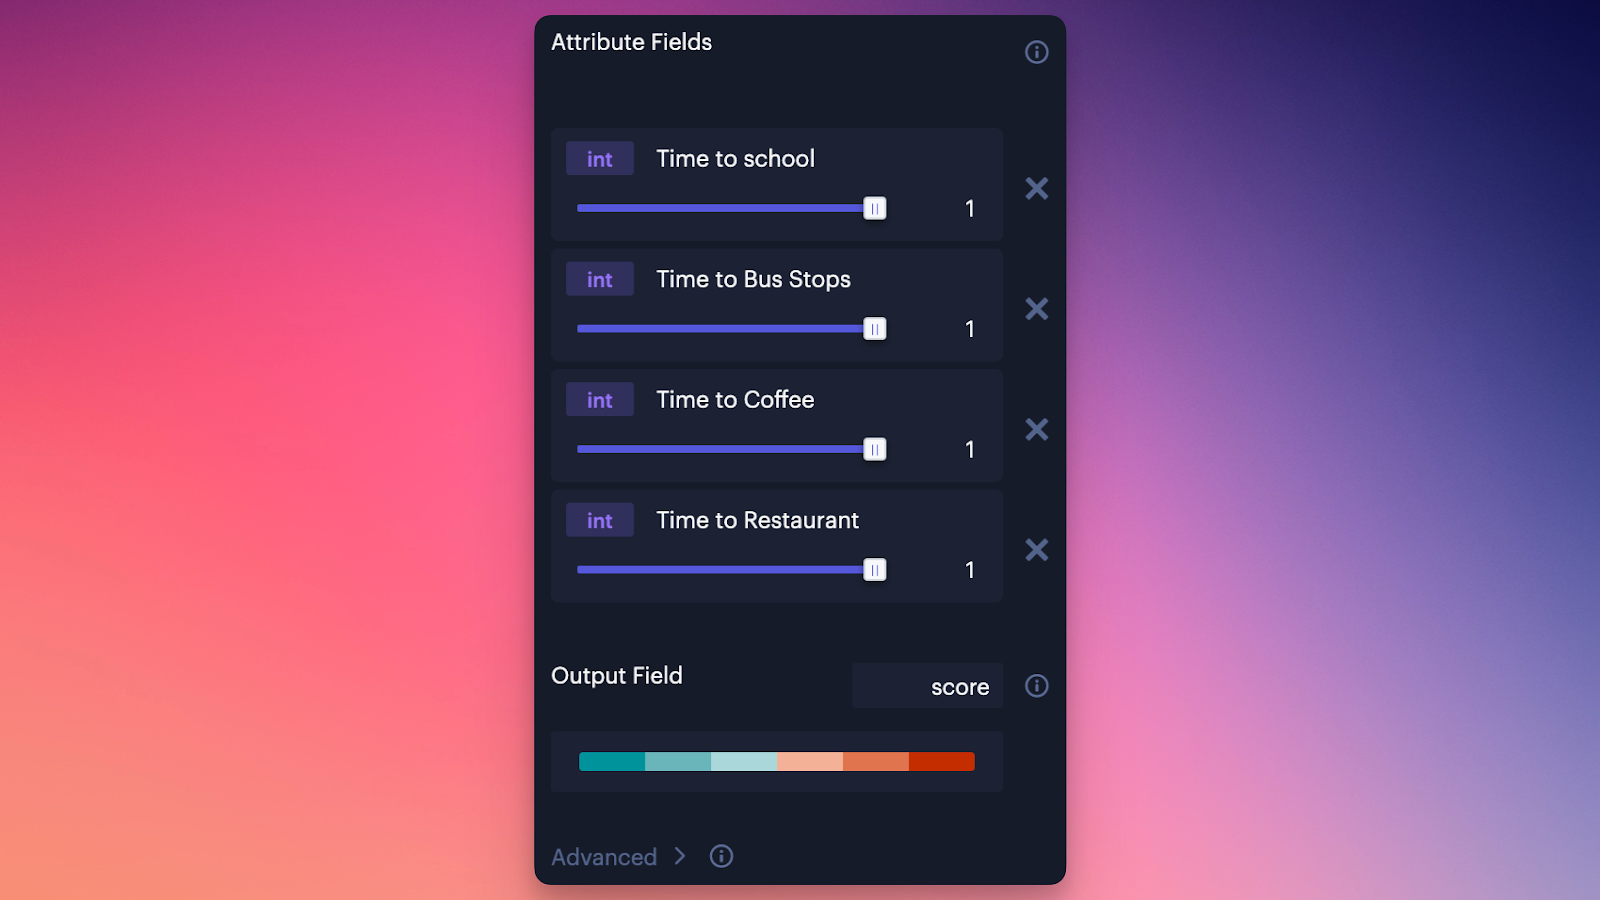
We can slide the weights to match our requirements, then click Confirm to run the analysis immediately. Say, for example, we are looking for a property that must be near a school, must be close to a coffee shop, and to a lesser extent near bus stops and restaurants. Choose a color scale then click Confirm to generate the Suitability Analysis layer.
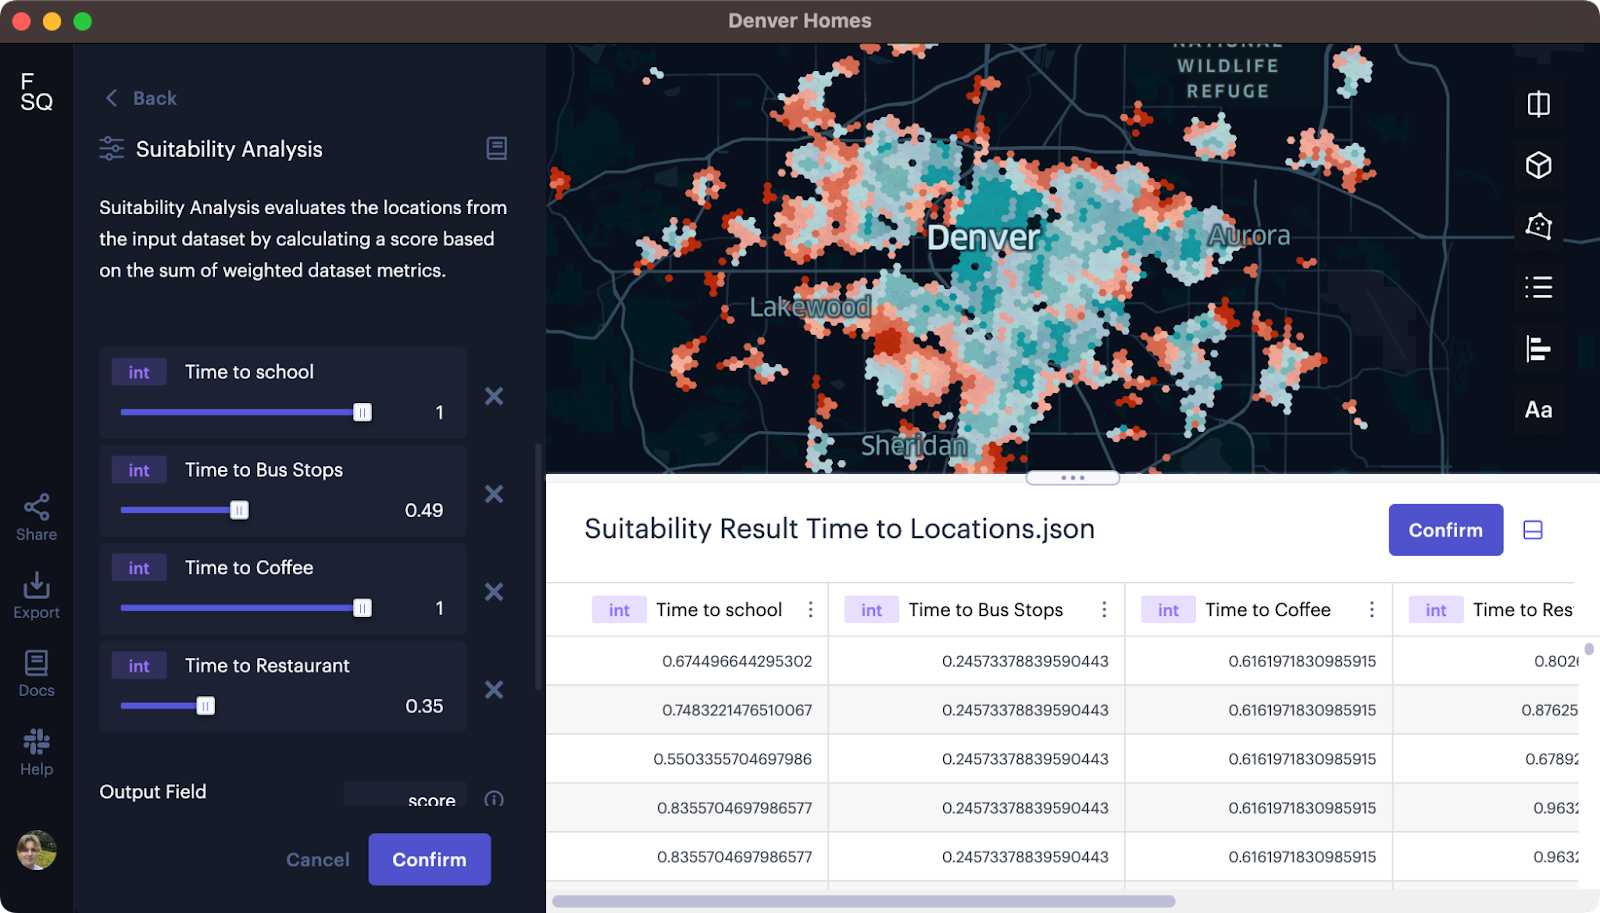
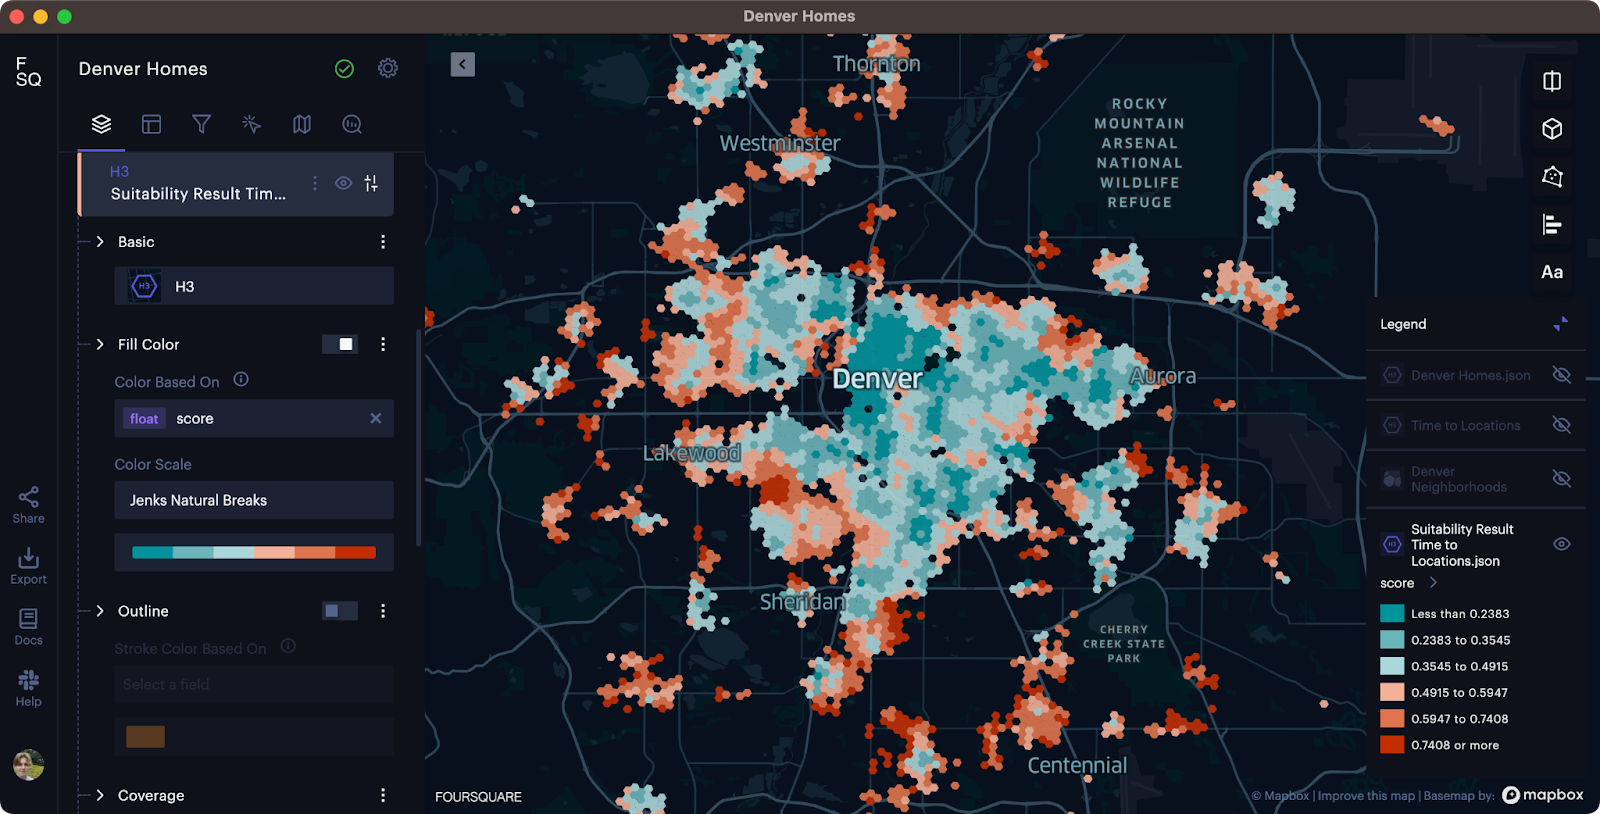
Right away, Studio generates the suitability layer using the specified weights and selected color scheme. If we wish to change any of the weights, color settings, or other advanced settings (learn more about advanced settings in our documentation), we can modify the settings and then click Confirm in the left-hand panel to rerun the Suitability Analysis module.
When the data looks good, click Confirm in the preview dataset. The suitability dataset is now added to our map.
Gathering More Insight
While this map provides a good base for identifying the best locations to purchase a home, Studio offers other tools that will enrich this map with more real-world information, offering new insights, such as the most compatible homes on the market, and the best neighborhoods that meet the home buyer’s needs.
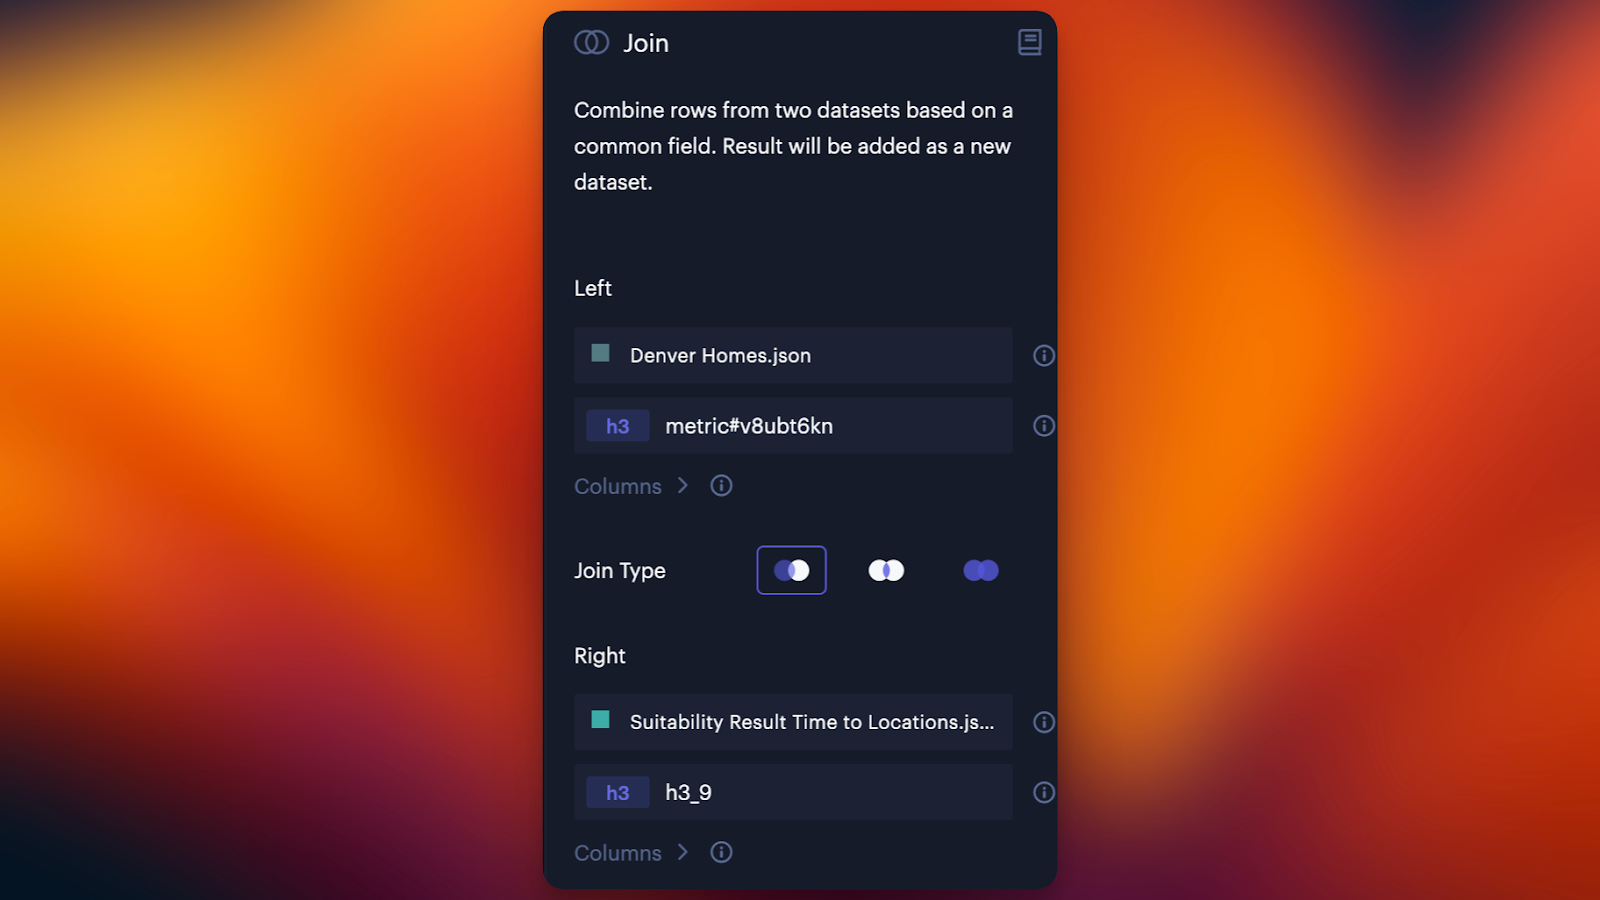
Let’s run a join operation on our “Denver Homes” dataset, conducting a left join on the suitability dataset we created above. Using the H3 indexes as our common field, our aim is to apply a suitability score to each home available in the Denver market.
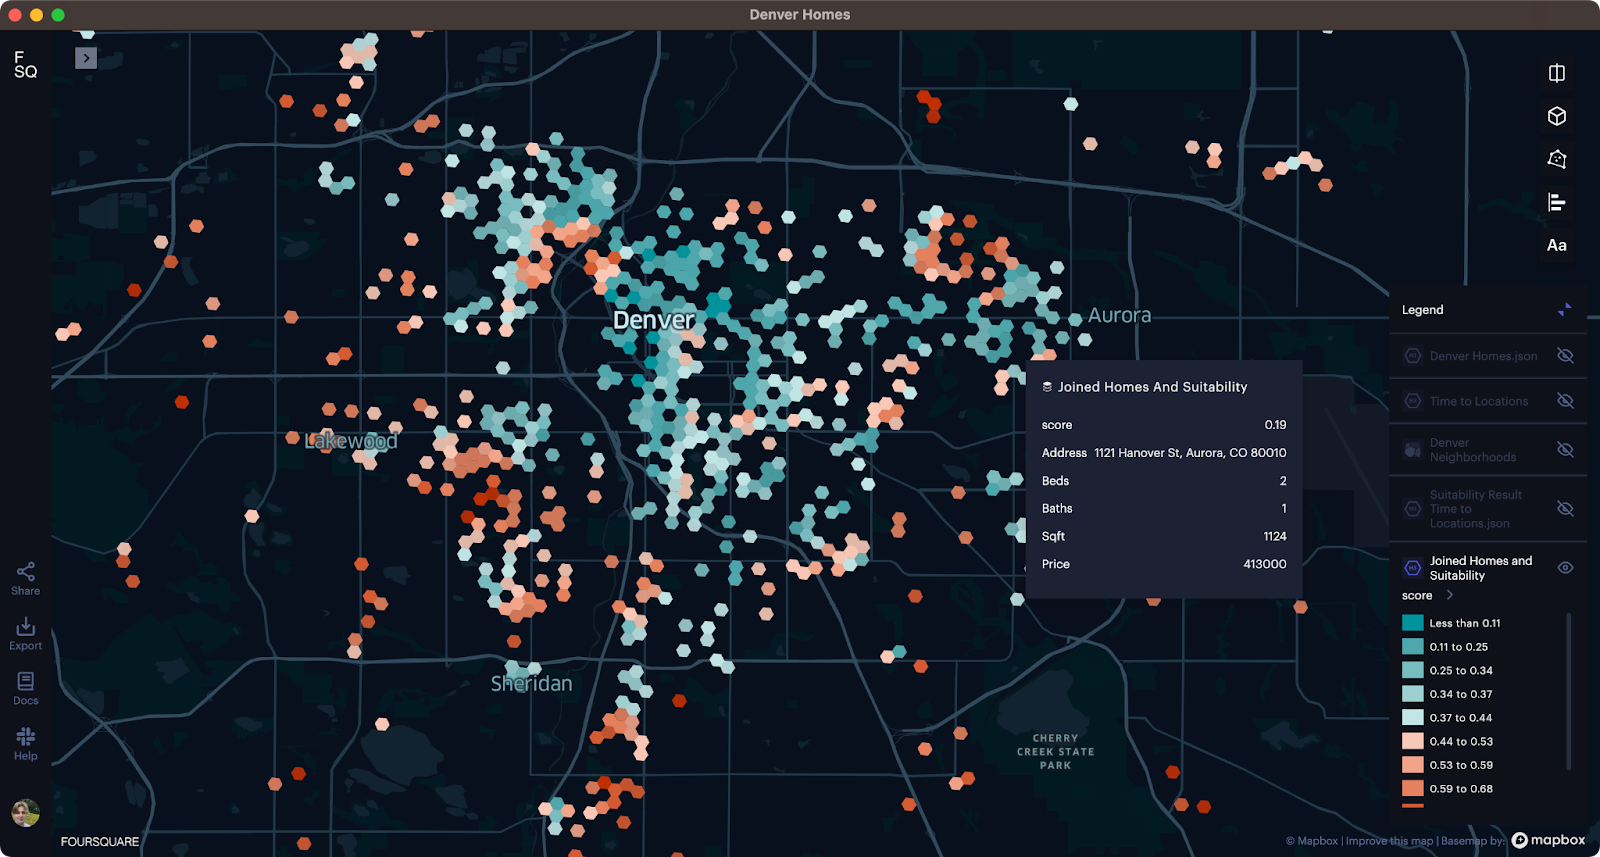
After running the join operation, a new layer is generated. This layer displays available homes that are then colored by their suitability score. We can use the mouse-over tooltip to browse the homes that have optimal scores (in this case, low scores since our input layer was time-to-destination values).
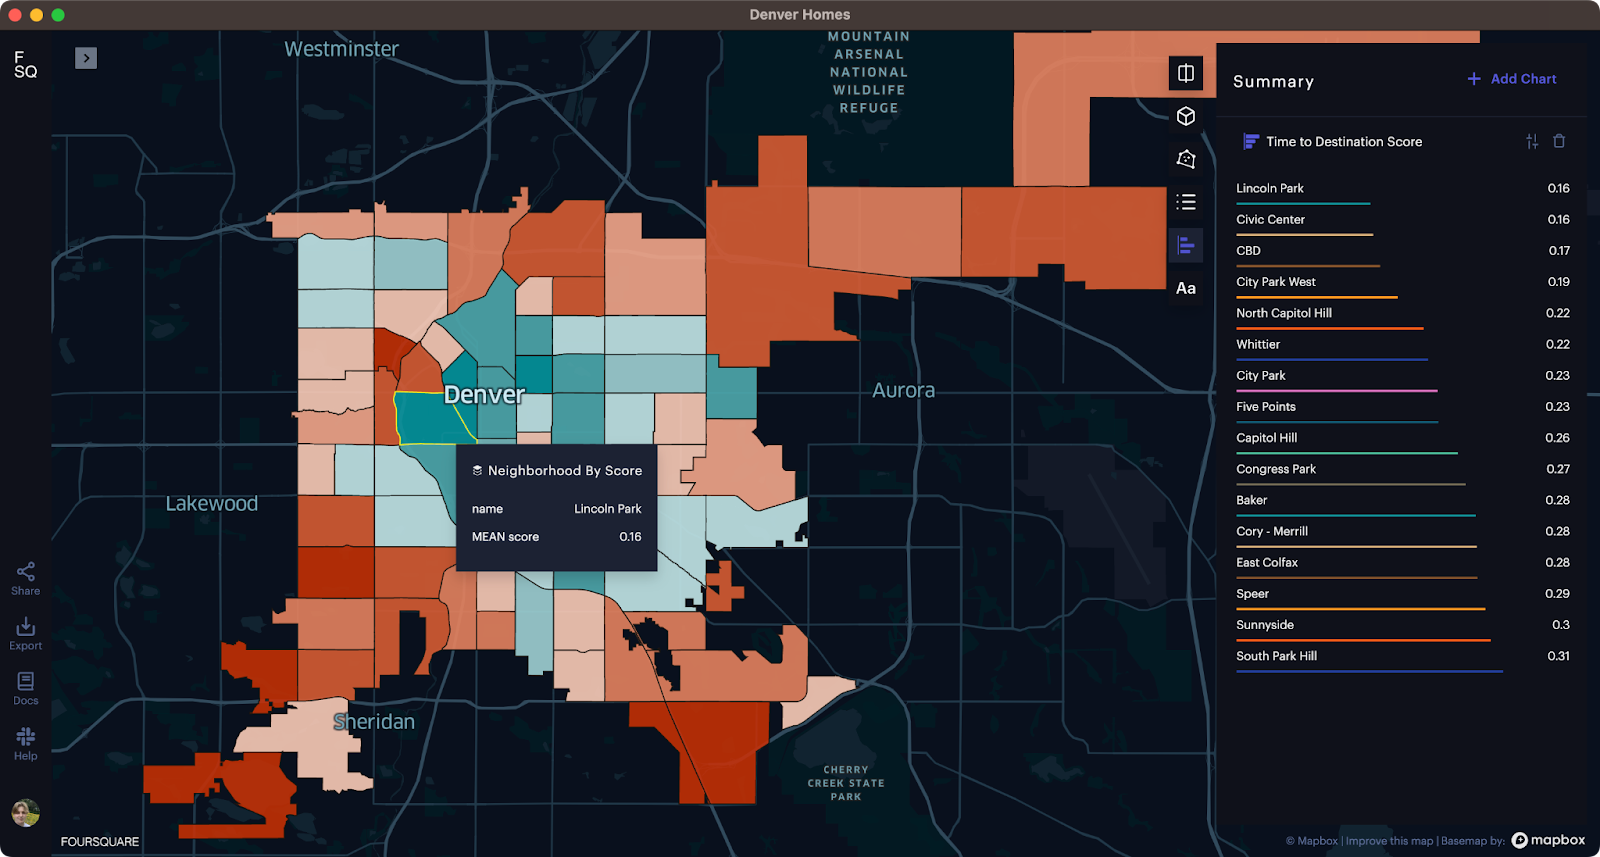
We might also be interested in the suitability of a given neighborhood. This is easy with Studio via the Spatial Join operation. Let’s import a GeoJSON dataset containing boundaries for Denver neighborhoods. Then, let’s open the spatial join module, selecting Intersects as a join type. We can then aggregate the score and time to destination columns by Mean.
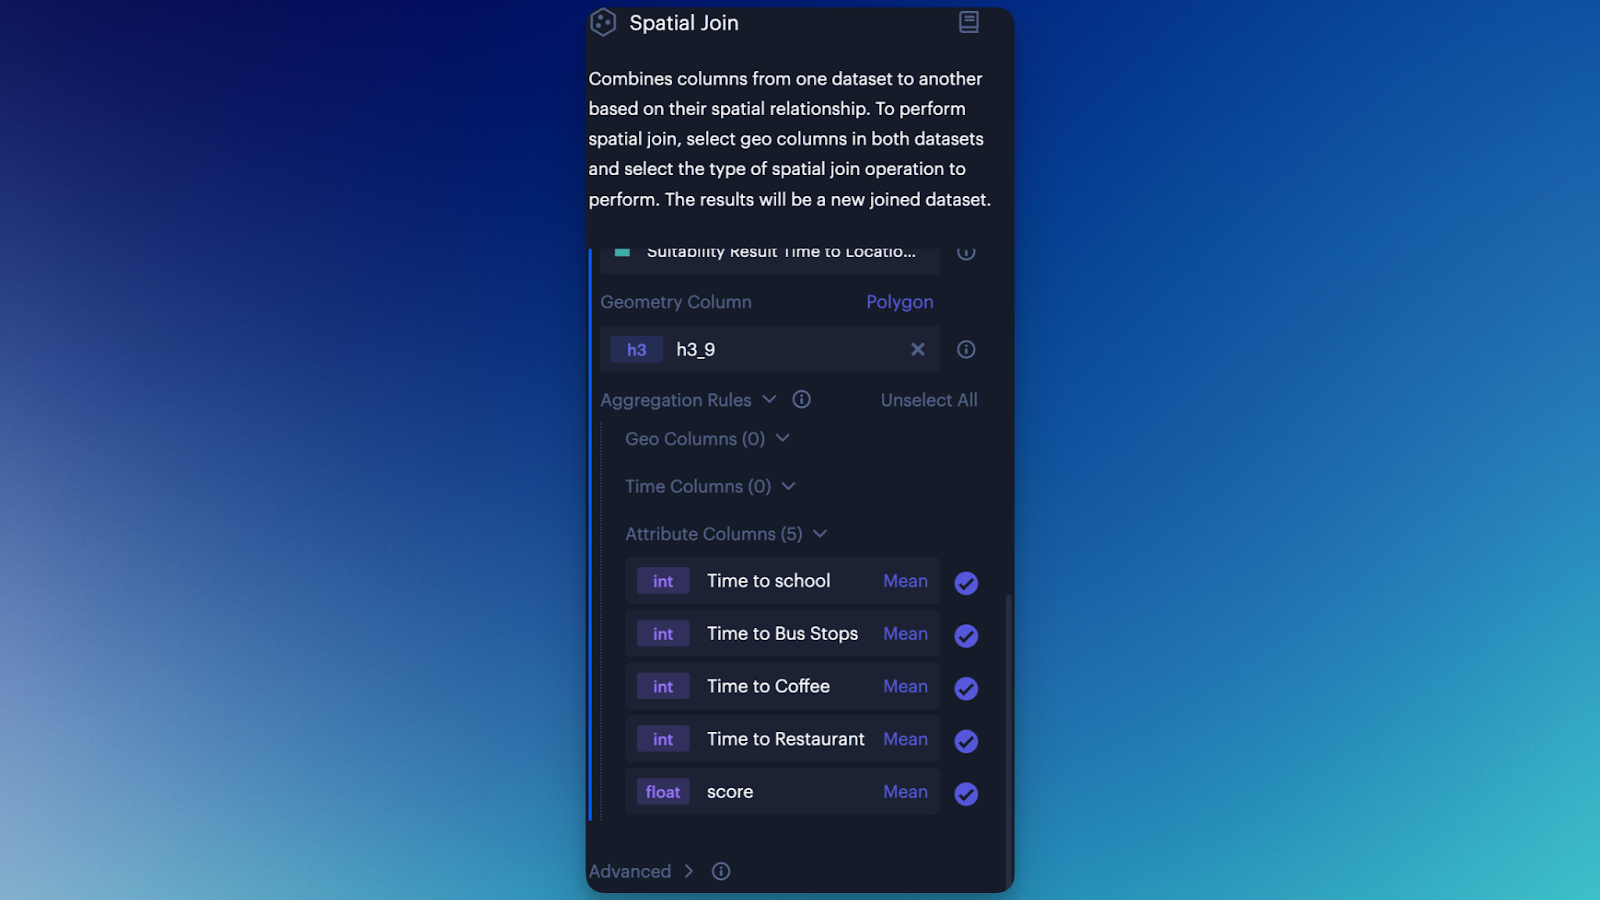
Click Confirm to add the dataset to the map. Again, a new layer is automatically created for the joined dataset. We can then set the layer to scale by score (the data point generated from Suitability Analysis), then review our results. Based on the criteria defined above, Denver’s Lincoln Park and Civic Center neighborhoods seem to offer the most attractive homes.
Want to explore the map yourself? Interact with the embed below to explore this data. To experiment further, try Suitability Analysis and other Studio features for free by copying the map to your account.


