
Trade area analysis: essential insights for any business
Developing and executing a successful business strategy is a complex undertaking that requires an in-depth understanding of not only your own business, but also your competitors. While most companies have detailed data and analytics in place to monitor their locations, performance, and forecasts, many lack the same level of knowledge about competitors.
This is particularly clear when considering two common workflows: trade area analysis and competitive intelligence. Trade area analysis, also known as catchment analysis, involves determining the service areas of specific store locations and where customers will travel from to visit these stores. Understanding trade areas is a critical input to site selection (or de-selection), marketing, supply chain analytics, and other data-driven components of a business strategy. It also reveals essential insights to help businesses ensure their locations are accessible to their target market and set up for success.
For example, a coffee shop chain looking to open a new store may conduct trade area analysis to see where there are lookalike markets, with conditions that mimic its most successful locations. Using location data and insights to create visualizations of where their existing stores are and where people come from to visit these stores can uncover untapped market opportunity, and also prevent the chain from cannibalizing its existing stores.
Layering in location intelligence for more accurate competitive analysis
Trade area analysis is incredibly important and begins with a comprehensive understanding of your own business. Companies that conduct this type of analysis typically have the data they need to understand the market; they know where their store locations are, and can analyze transaction data from their customers to get a general idea of where they reside. But determining market opportunity and risk – the main objective in analyzing trade areas – also requires competitive intelligence that many brands struggle to obtain.
Let’s take the same example of a growing coffee shop chain. While understanding the trade areas of existing stores is critical to choosing a new location, so is analyzing the trade areas of competitive stores. Through detailed catchment analysis, the growing chain may discover that its most successful locations are a certain distance away from other similar businesses. Or, that a market they thought was a lookalike based on certain characteristics is actually less likely to be successful for them as it is already saturated with coffee shops.
True business intelligence lies at the intersection of trade area and competitive analysis. However, it’s no easy feat for a competitor to obtain the same level of detail a business owner can see. Sure, employees of an individual store might be able to see that the competitor down the street recently closed, or that their store is losing customers to a new establishment five minutes away, but how do market teams stay on top of this local context when planning an entire network of stores?
Mastering trade area and competitive analysis with geospatial data
Brands that have mastered the ability to power their trade area analysis with competitive intelligence are relying on geospatial data – specifically points of interest (POI) data – to keep up with a dynamically changing business landscape. With an up-to-date database of POI data, brands can easily keep a pulse on how competitors are performing across local markets without ever having to physically assess the area. The wide array of geospatial tools and data available today also allows companies the ability to analyze how customers interact with competitive locations and deduce what that means for their stores.
Foursquare works with brands around the world to help them understand how competitors impact their trade area. With its Places data, comprised of 130M+ global POIs updated daily to reflect real-world change, Foursquare provides businesses with accurate data and a forum to visualize the competitive landscape, making strategic decision-making simple. With the variety of geospatial analysis tools available in Foursquare Studio, brands can effectively assess market conditions and model potential store performance scenarios. Many brands take geospatial analysis a step further by enriching POI data with consumer mobility insights, revealing how customers interact with competitive locations.
See it in action: competitive trade area analysis for Tim Hortons in Buffalo, NY
To illustrate this advanced competitive intelligence and trade area analysis workflow, let’s stick with the coffee shop example. In this use case, we will leverage Foursquare Places POI data and Studio geospatial visualization tool to analyze trade areas and the competitive landscape for a Tim Hortons store located in Buffalo, New York.
Methodology
First, we identify the store’s true trade area. We begin by mapping the store POI from the Places dataset using Studio to visualize the location, and then layering in movement data to identify the home zip codes of customers who visited the store. We filtered the data to only include zip codes with a medium or high volume of visitors. Because stores inevitably get visitors that can be considered outliers, (e.g., people visiting on vacation or just passing through on the way to another destination) we recommend applying a threshold distance for particular zip codes in a trade area. While it can be helpful to analyze these outliers for other purposes, it can skew the results of a local trade area analysis.

Next, we further narrow down results by filtering the zip codes to only include those immediately adjacent to the zip code where the Tim Hortons is. Another popular method for further filtering the zip codes in a trade area analysis is to refine the movement volume filter to a more granular threshold.

Now that the trade area for the specific store location has been identified using consumer mobility data and proximity analysis, we can begin to layer in competitive intelligence for more real-world context. To do so, we filter the Places dataset by Foursquare Category ID.
| Category ID | Category Name |
| 13032 | Dining and Drinking > Cafes, Coffee, and Tea Houses |
| 13033 | Dining and Drinking > Cafes, Coffee, and Tea Houses > Bubble Tea Shop |
| 13034 | Dining and Drinking > Cafes, Coffee, and Tea Houses > Café |
| 13035 | Dining and Drinking > Cafes, Coffee, and Tea Houses > Coffee Shop |
| 13063 | Dining and Drinking > Cafes, Coffee, and Tea Houses > Pet Café |
| 13036 | Dining and Drinking > Cafes, Coffee, and Tea Houses > Tea Room |
We then map the POIs that fall within the identified trade area and are tagged with one of the chosen Category IDs.

To see how accessible these competitive stores are to the surrounding area, we can leverage Studio’s spatial analysis tools to conduct a drive time analysis.
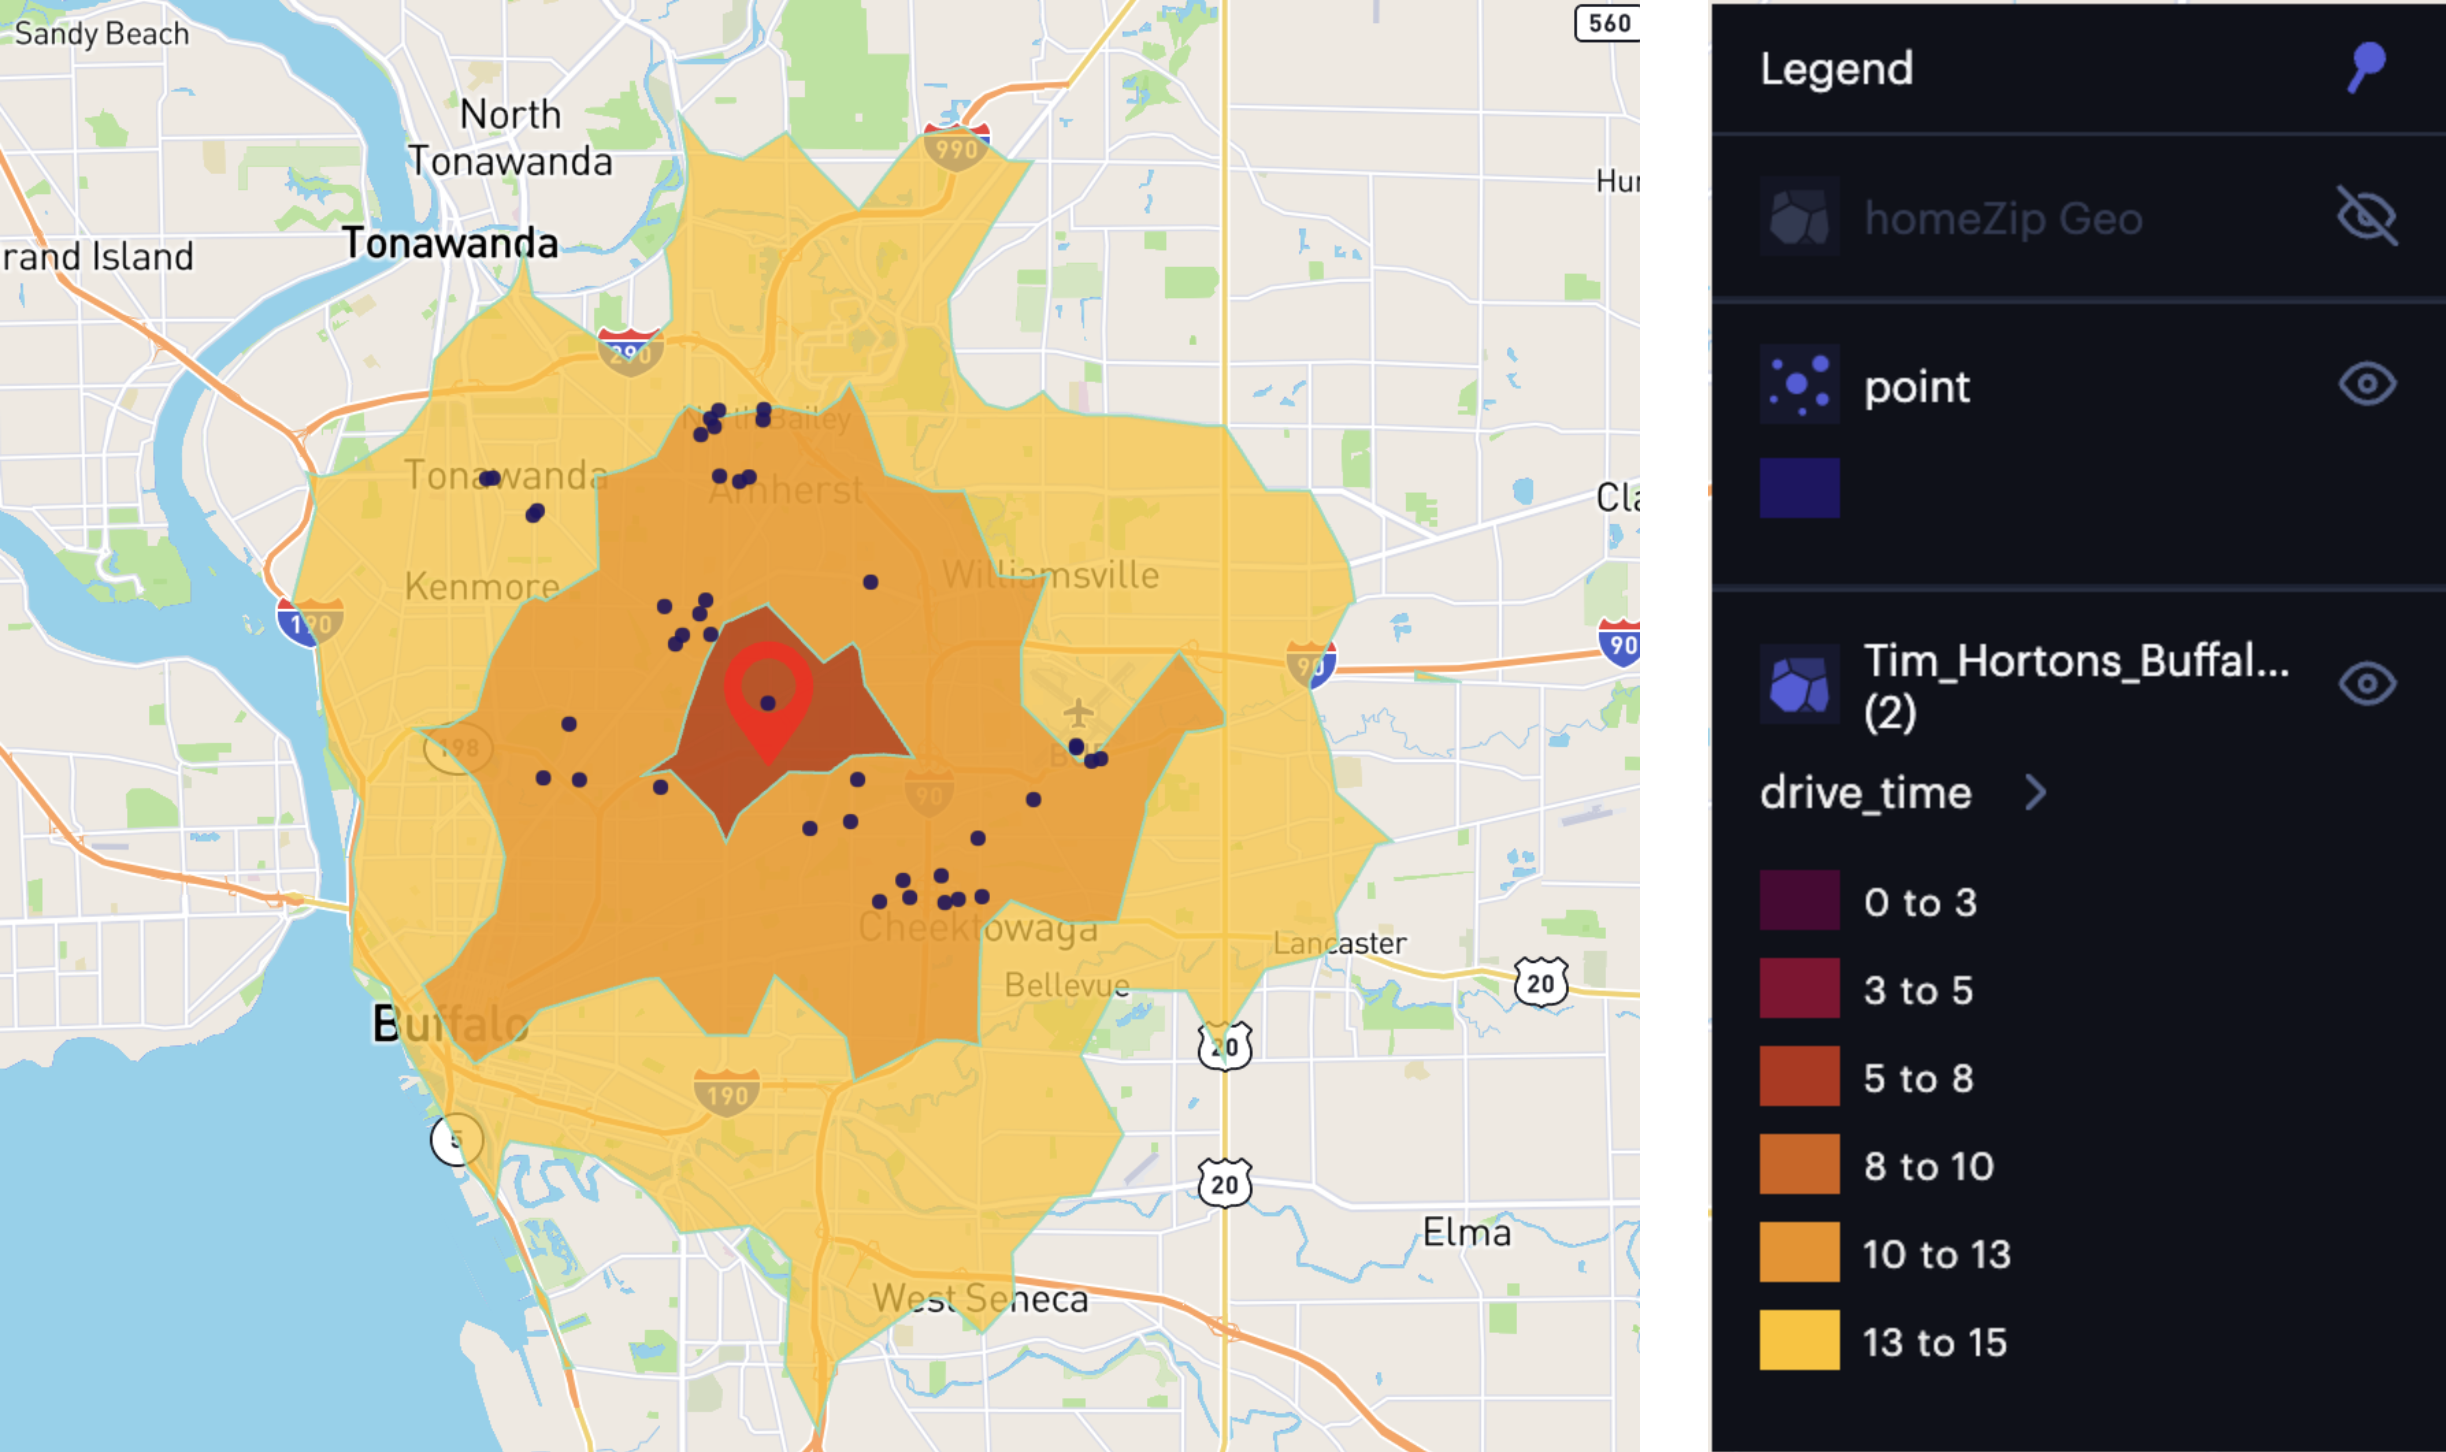
With the contextual layers of this specific store’s trade area, the locations of nearby competitors, and the accessibility of these coffee shop locations to the surrounding area, we can now begin to draw conclusions about the impact competitors have on this particular trade area.
Results
By analyzing the drive time isochrones in relation to the individual Tim Hortons store and its nearby competitors, we start to understand some interesting trends about coffee shop visitors in this trade area. For example, there are no other coffee shops located within a five-minute drivetime of the Tim Hortons, which may explain why most of its visitors reside in the same zip code.
There is a large concentration of competitive locations to the west and southeast of the Tim Hortons. This indicates that those markets are already served by coffee shops and are not good candidates for expansion, or even for marketing campaigns to try and entice visitors from those zip codes into the Tim Hortons we are analyzing here. Customers choosing to visit this Tim Hortons from those zip codes will have to actively drive by competitive locations in favor of visiting this specific store, which can be used as a metric to measure brand loyalty.
Another unique insight derived from this analysis is the types of competitors popping up in the area. Most of the nearby competitors identified for this analysis belonged to other quick service chains, such as McDonald’s or Starbucks. It is likely that Tim Hortons’ market planning teams already keep close tabs on these competitors since they are so similar to their brand. However, the competitive trade area analysis revealed that another, new type of coffee shop close by may be driving business away from the Tim Hortons store. To the northeast of the store is a craft coffee bar, close enough to potentially win customers from the surrounding zip codes.
Finally, the initial outlier zip codes can be analyzed in a future study to better understand why this particular Tim Hortons receives such large volumes of visitors from non-adjacent zip codes. For instance, deducing that workplaces near the Tim Hortons have employees who reside in more distant counties, or that the store is located near a highway exit, can help inform strategic decision-making around future marketing campaigns, product development, or other plans that require detailed knowledge of personas.
Building smarter trade areas with competitive intelligence from Foursquare
The intersection of trade area analysis and competitive intelligence provides brands across industries with the insights they need to develop data-driven growth strategies. By combining Foursquare’s global Places data with the aggregated mobility insights of movement data, brands have access to all of the layers of information needed for real-world business intelligence.
Ready to supercharge your trade area analysis with up-to-date details on the competitive landscape? Get in touch with an expert here.


