Constructing accurate, semantically meaningful user journeys in the physical world, with a pipeline designed to include privacy controls end-to-end.
At Foursquare, we know that ‘where’ matters. But getting ‘where’ right is no easy feat. The landscape is constantly changing, with businesses opening and closing daily. Distinguishing a visit from a passerby is difficult, particularly with signal interference in dense urban cities and busy indoor environments, not to mention options like drive-through and buy-online-pickup-in-store. However, when you get location wrong, you deliver suboptimal experiences and irrelevant information, ultimately risking loss of consumer trust.
How does Foursquare Get Location Right?
At Foursquare, we translate raw signals into meaningful data about places and the movement between them. As a result of nearly 14 years perfecting our best-in-class location technologies, we have created a map of the world not based on coordinates, but on actual places and proprietary tech that detects how we move to those places.
Here’s a behind the scenes look at what we do in our upstream data pipelines.
Delivering both quality and scale
To ensure we deliver both quality and scale, Foursquare has data from different sources, including our Owned & Operated (O&O) apps, SDK partners, and trusted third parties. Our consumer-facing apps, Swarm and City Guide, offer value to customers while collecting information that then trains and fine-tunes our models, providing us with ground truth data and the consumer with an engaging user experience. All users provide opt-in consent, and because we offer true utility to our customers for sharing their location, our opt-in rates are higher than industry standards.
Detecting movement with precision
It’s important to think about the methodology for detecting movement. In order to get movement right, it’s vital to get places right. Our artificial intelligence and machine learning algorithms aggregate, clean, and validate data from multiple sources, using first party ground truth from people in the real world to enhance freshness and provide rich context.
The next challenge is getting movement right. Common methods for doing this include using signals like GPS, polygons, or radii. However, this can result in the ‘little blue dot problem’ where certain signals indicate that you are 20M+ meters from where you are. In dense urban environments and busy indoor settings, this could mean the difference between a taco joint and a clothing boutique, or a bank and a shoe store.
So, how can you solve this and ensure there truly is a visit taking place, and that it’s registered as a visit to the right place?
The first consideration is the temporal element. It’s important to understand how data differentiates between visits and someone passing by. Foursquare differentiates using our proprietary multi-sensor, stop detection technology, which accurately detects how people move in the real world, at scale. We monitor speed, distance, direction and dwell time to distinguish when a visit actually took place versus when someone stops at a red light outside or walks by.
Another aspect to think about is data quality from a spatial perspective, in the case of knowing when a stop occurs at venue A and not venue B. To do this at Foursquare, we use what we call snap to place – we build a proprietary database of POI using Place shapes, collecting all signals from a device to build a picture of a place the way a phone sees it. Context clues like time of day and venue popularity provide an additional layer of insight to optimize our model predictions, and our real-time feedback system confirms and continuously improves our model accuracy.
Constructing Accurate, Semantically Meaningful User Journeys
We’re not focused on injecting cutting-edge machine learning algorithms into Foursquare’s sophisticated movement engine. Instead, we take a step back to frame the problem, and then architect a solution in the right modular way, which leads to more effective solutions.
Disentanglement and reconcile data providers
We bring in diverse data – hundreds of billions of pings – into our pipelines, which presents quality challenges in data amplification. Foursquare has processes in place to remove bots and fraudulent data, as well as further internal restrictions to prevent usage of data around certain locations.
On top of the remaining data, here are some highlights of Foursquare’s process for constructing semantically meaningful user journeys through our movement pipeline.
Innovative systems for data source de-aggregation and reconciliation
In terms of architecture, Foursquare runs parallel independent pipelines for each source, which helps handle any panel instability. Within this architecture, there are provider-specific algorithms that are tuned to unlock quality monitoring and noise filtering. Additionally, we conduct subsequent testing of inter-provider consistency, deduplication and eventual harmonization into a single fused device timeline.
Movement understanding beyond stop detection
At Foursquare, we ensure that movement can be confidently identified beyond stop detection from raw pings. This allows more flexible stop definition beyond a simple density/clustering approach. Therefore, richer geospatial understanding is made possible as movement and stops become two sides of the same coin.
Trained on our own app feedback
Foursquare is training on our own app feedback. We are able to leverage first party user check-ins to validate our movement and visits algorithms, as well as perform data conflict resolution with third-party data.
Superior noise filtering
Another key component in getting to high fidelity data products is our aggressive and precise noise filters for data quality in the upper funnel.
Privacy-preserving
Finally, at Foursquare, privacy controls are central to any improvements we make in R&D, which carries on into the development cycle. Foursquare’s data science team works closely in collaboration with the product, legal and privacy teams on any new products built.
In terms of raw data, most everyone in the geospatial industry is familiar with the mysterious, ubiquitous crop circles that appeared in GPS data last year. This is an example of an existing issue that is visually recognizable, yet a challenge to remove systematically, at scale.
Visualizing results in Foursquare Studio
This is where quality amplification begins and is relevant at the ping level. When we project the classification results on a Foursquare Studio map, the output of the movement understanding pipeline paints a beautifully segmented data visualization of stops (green points), movement segments (colored blue), synthetic noise and defects (in particular, red crop circles). You can see in the map visualization above that we paint this three color picture algorithmically.
Once the red noise is identified, it is simple to filter out. Filtering allows us to build more confidently on the remaining ping data, which is the semantically meaningful story for users moving through the physical world.
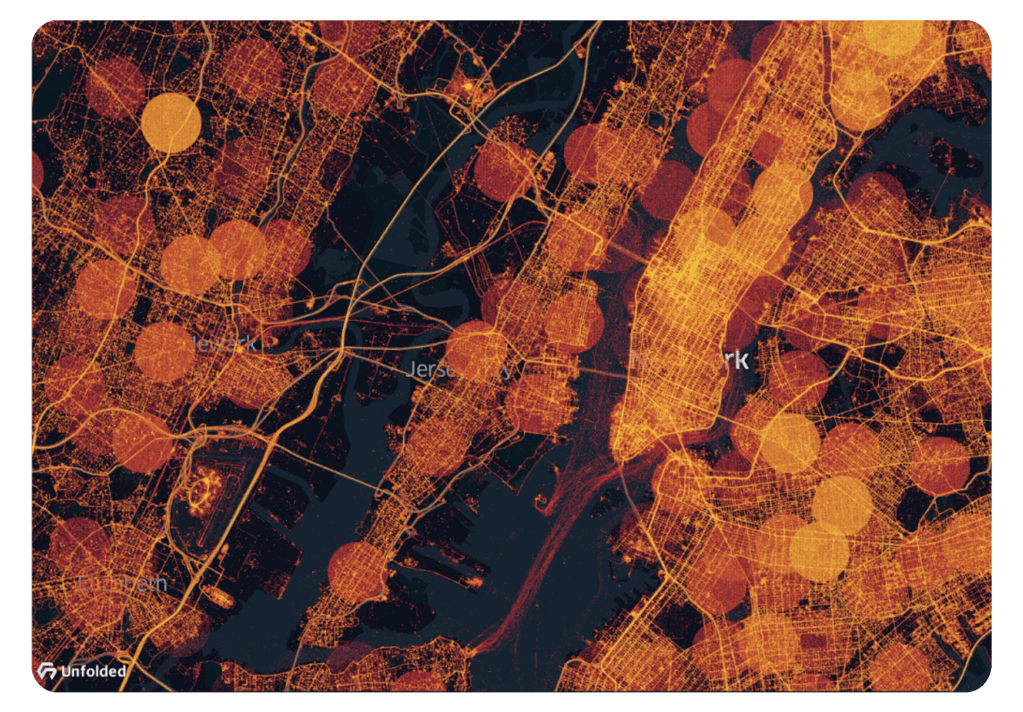
The graphic above is a “map without map,” which visualizes 1,000 users in Los Angeles during a particular week in 2022. The blue colored movement data itself is tracing the road and street networks using only ping sequences, without prior reference to any basemap.
So, what are the components of how Foursquare builds movement? A simple example of one input to understanding and classifying movement is the Vector Scalar Distance Ratio (VSDR) – a trail “shape” metric.
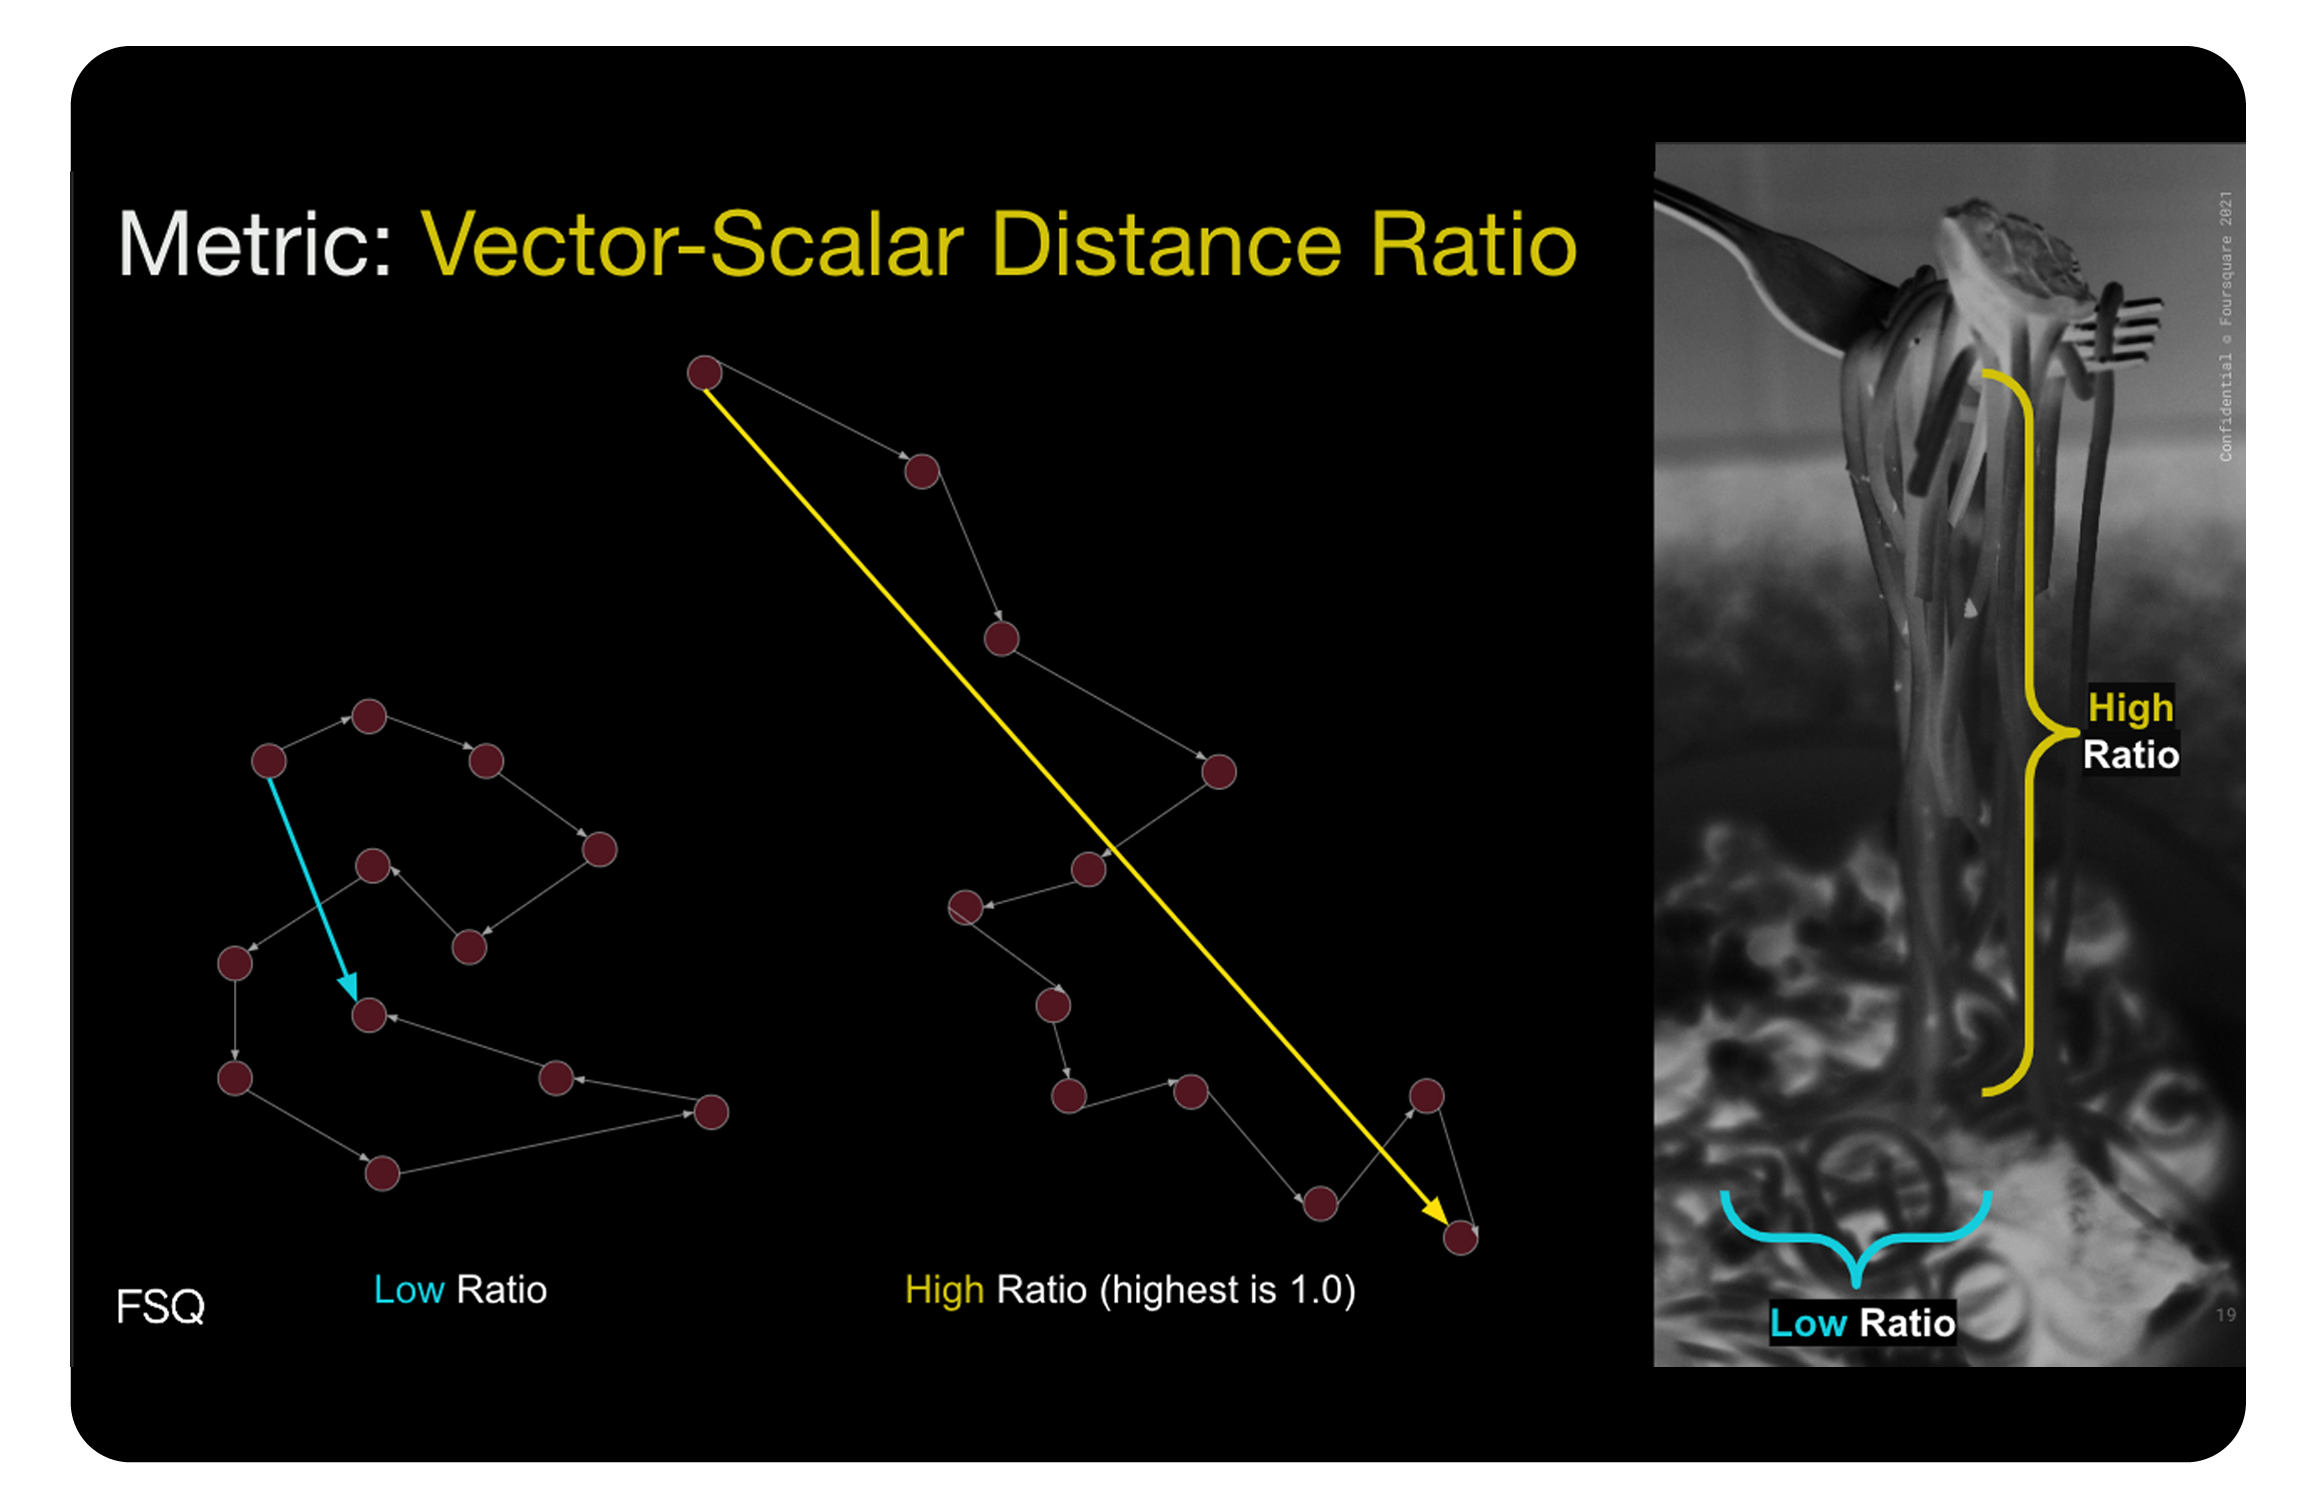
The visual above shows two ping trails of 12 pings for a single device or user. By introducing a threshold on this metric, we can map from the trail shape to a classification of “in motion” or “at rest.” Surprisingly, this metric is robust against noise, and also effectively identifies different motion types, such as devices moving in a car on the highway or an elderly woman taking a leisurely stroll down the street. These two examples are both identifiable as moving motions. If we instead segmented motion types on device speed, the results would turn out to be much less interpretable.
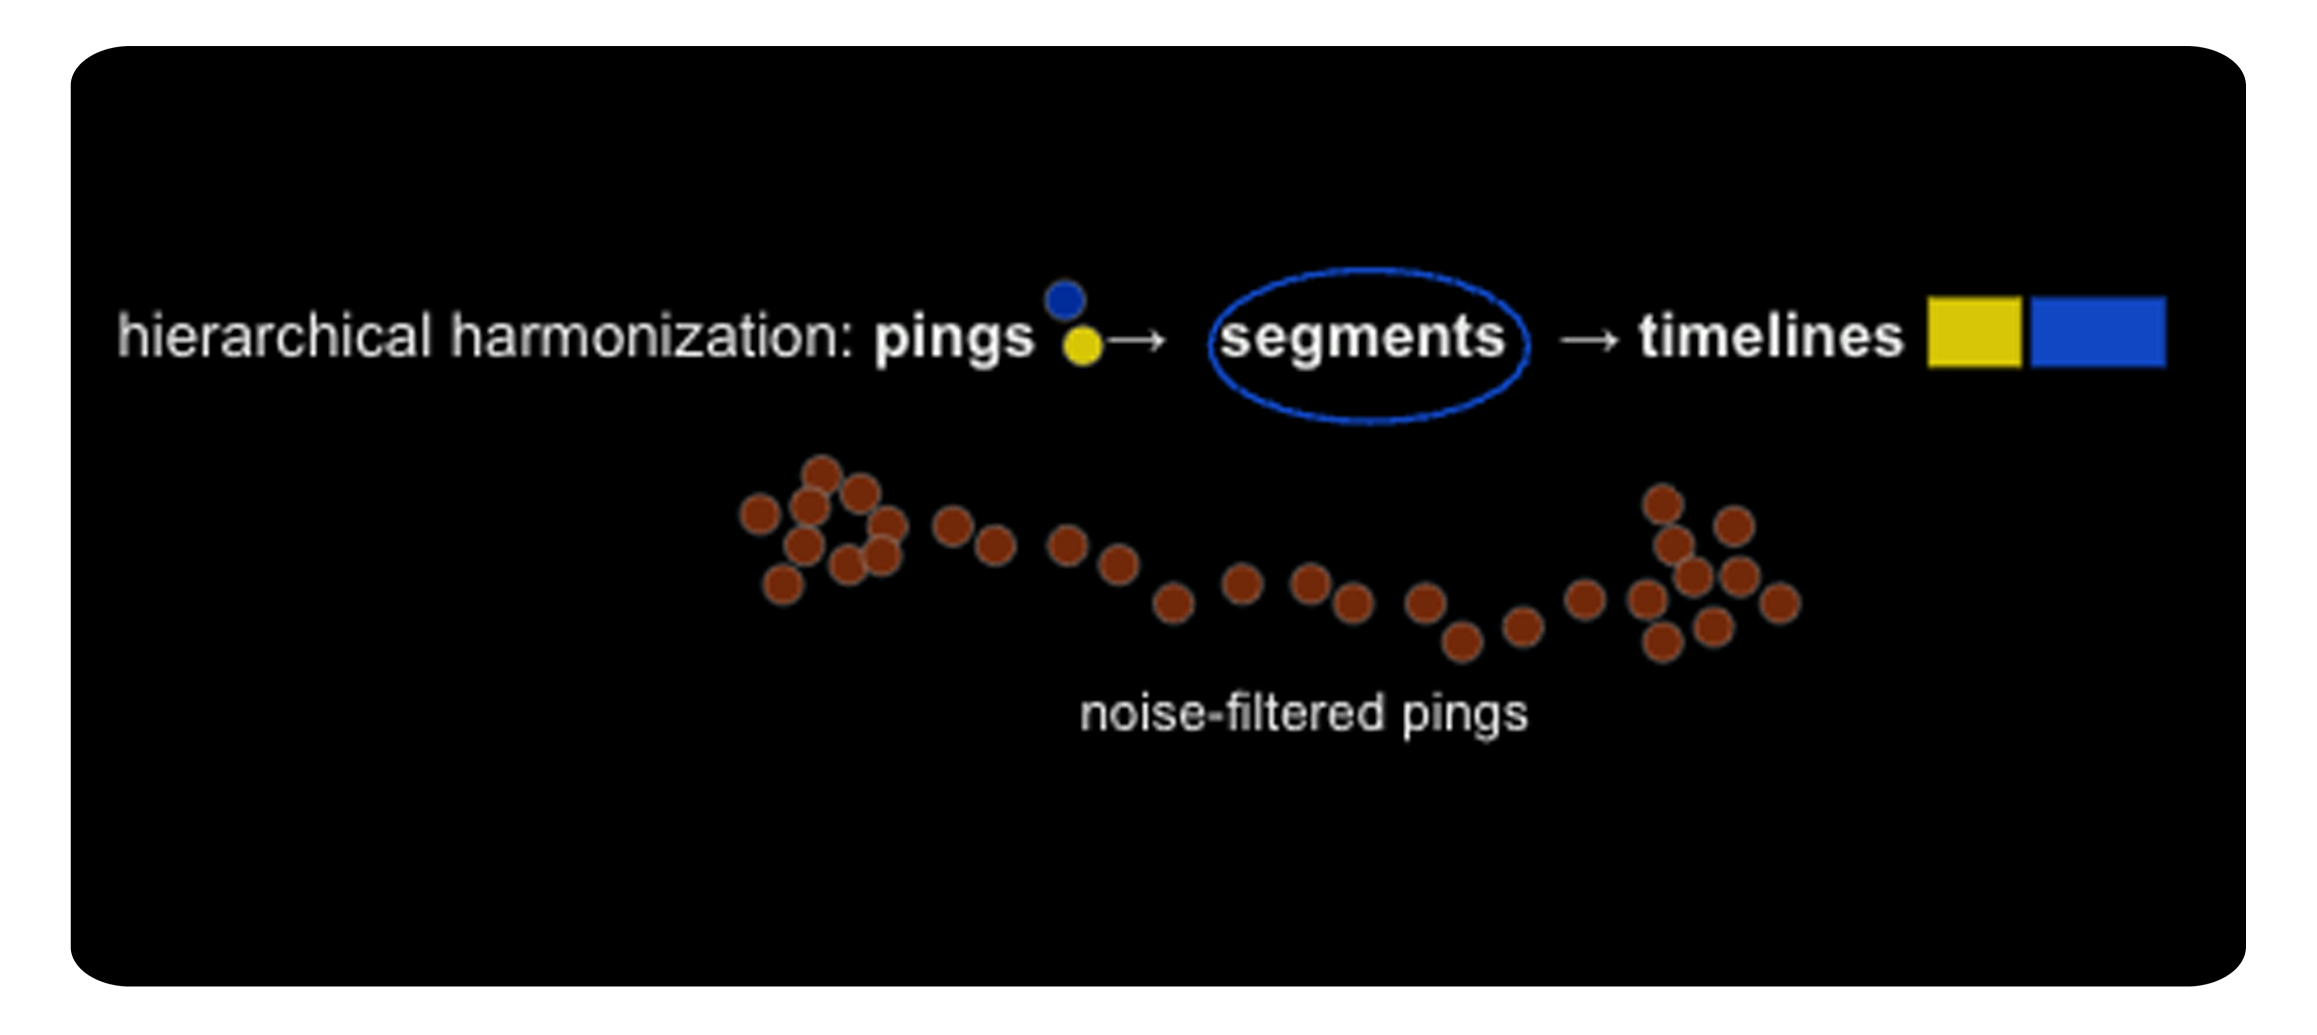
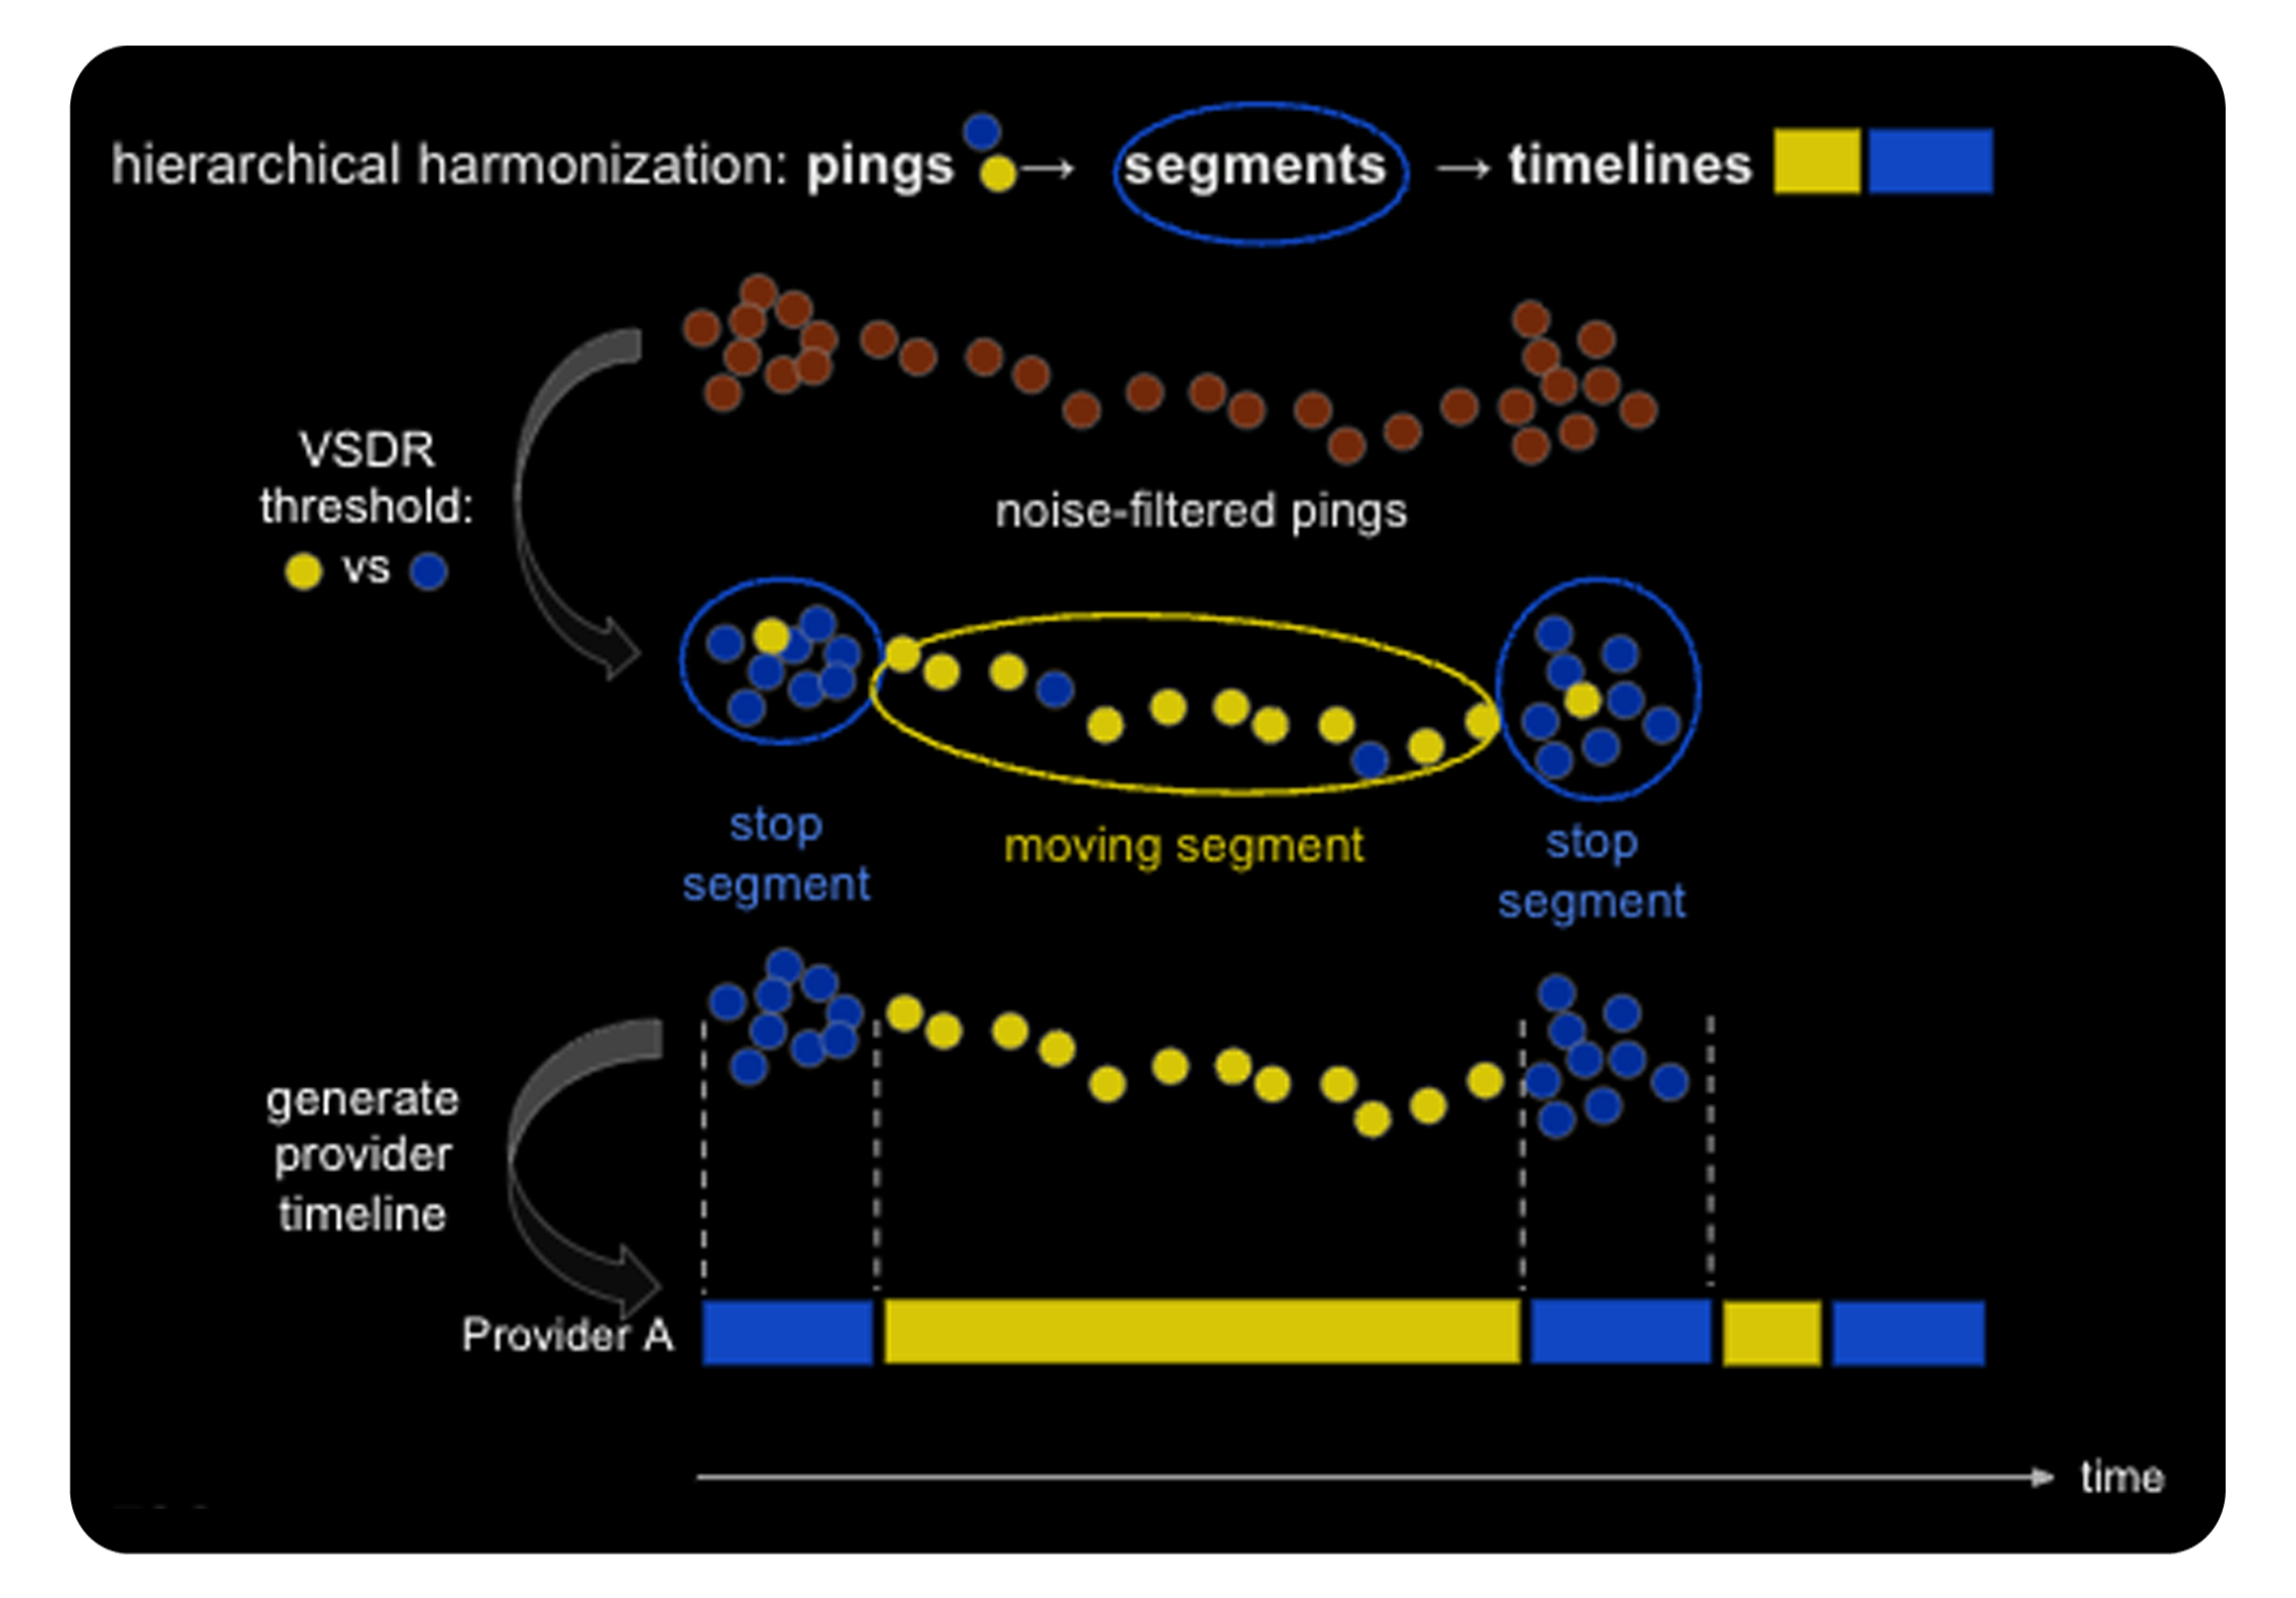
The algorithmic processing of raw data imbues the data with geospatial intelligence that moves up through the data pyramid, and converts it into actionable information and value to clients. It’s important to note that getting to semantically meaningful user journeys is a process of hierarchical harmonization from individual pings to stop and moving segments and on to device timeline generation.
The first step is the removal of the noise and synthetic data, such as the crop circles previously mentioned.
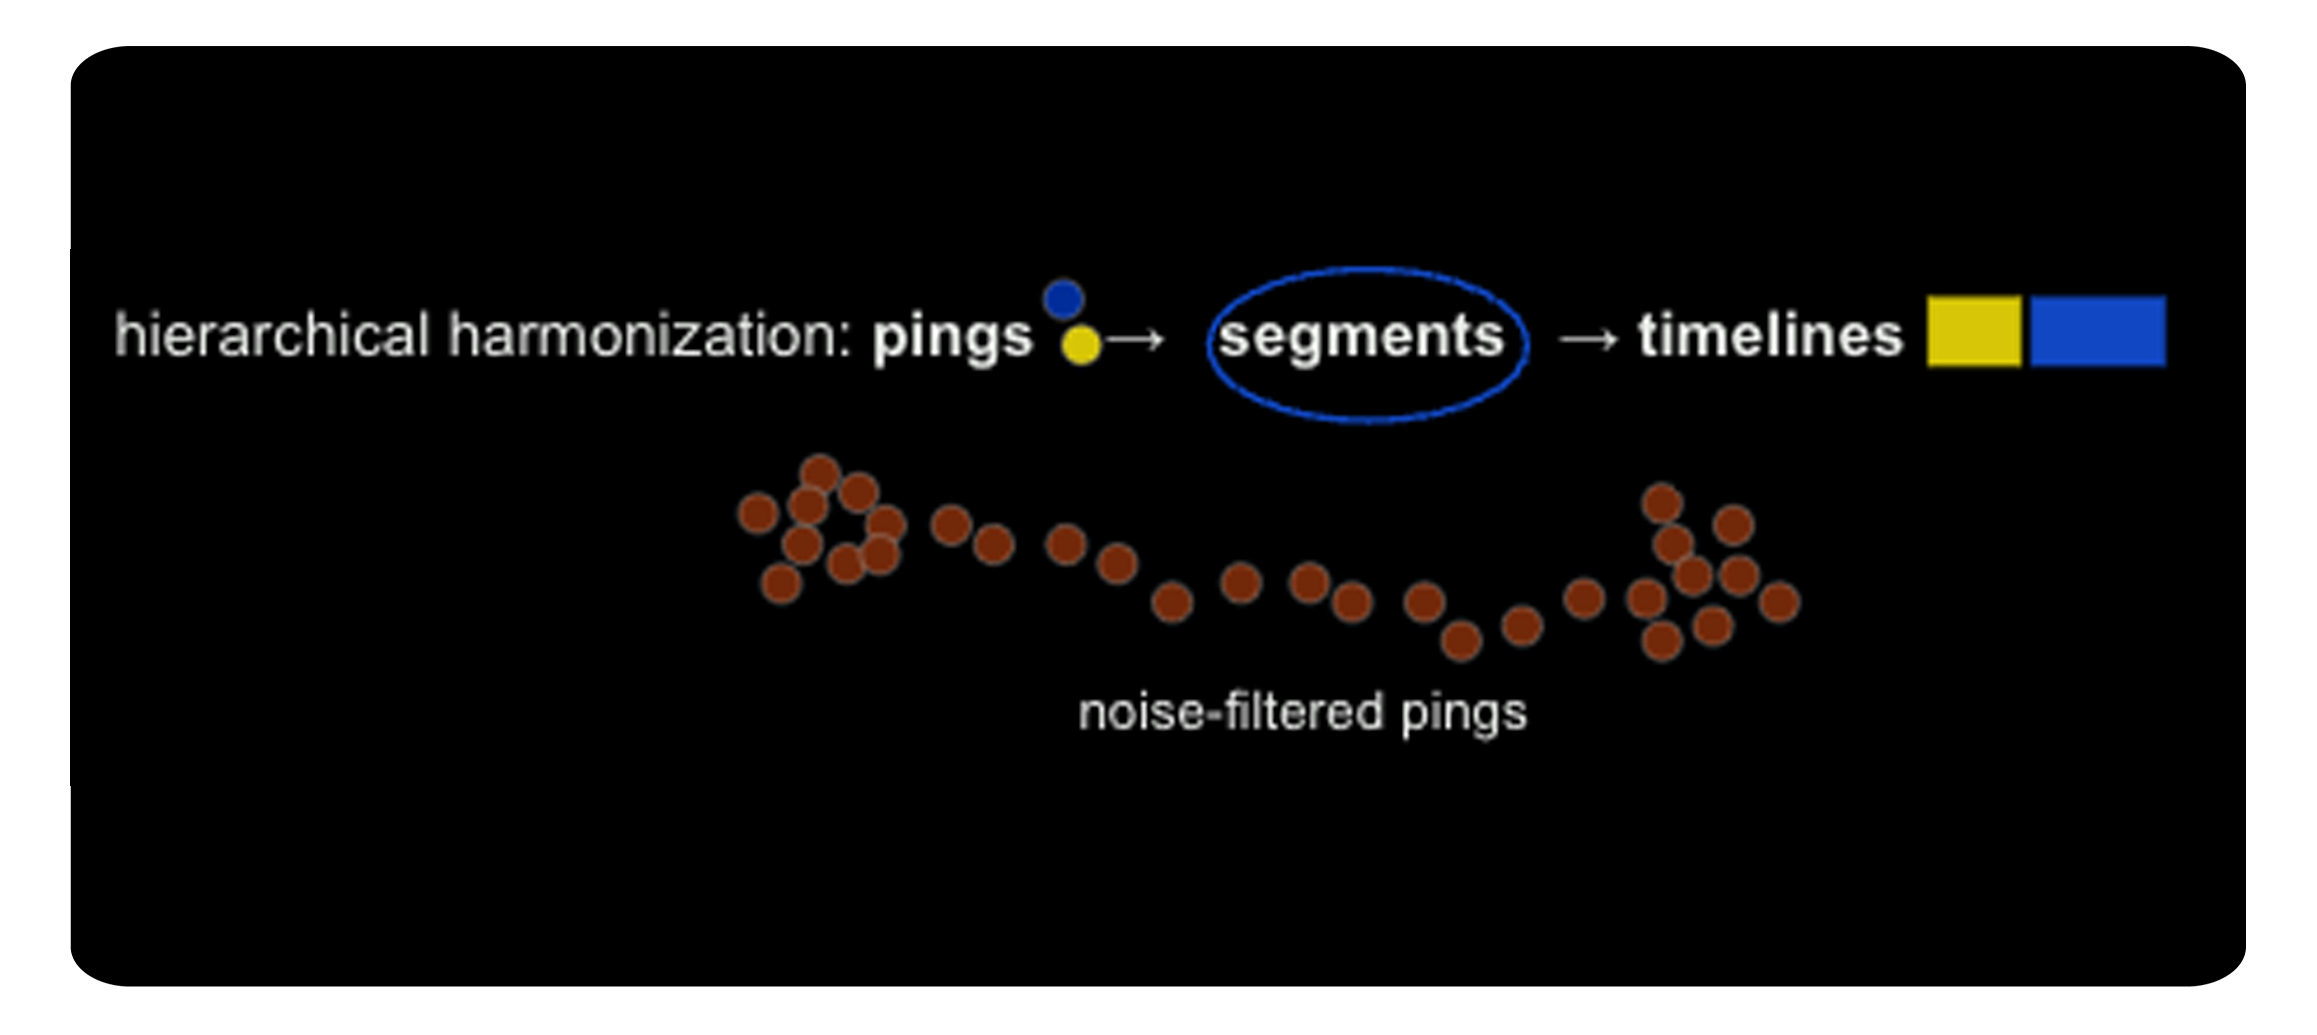
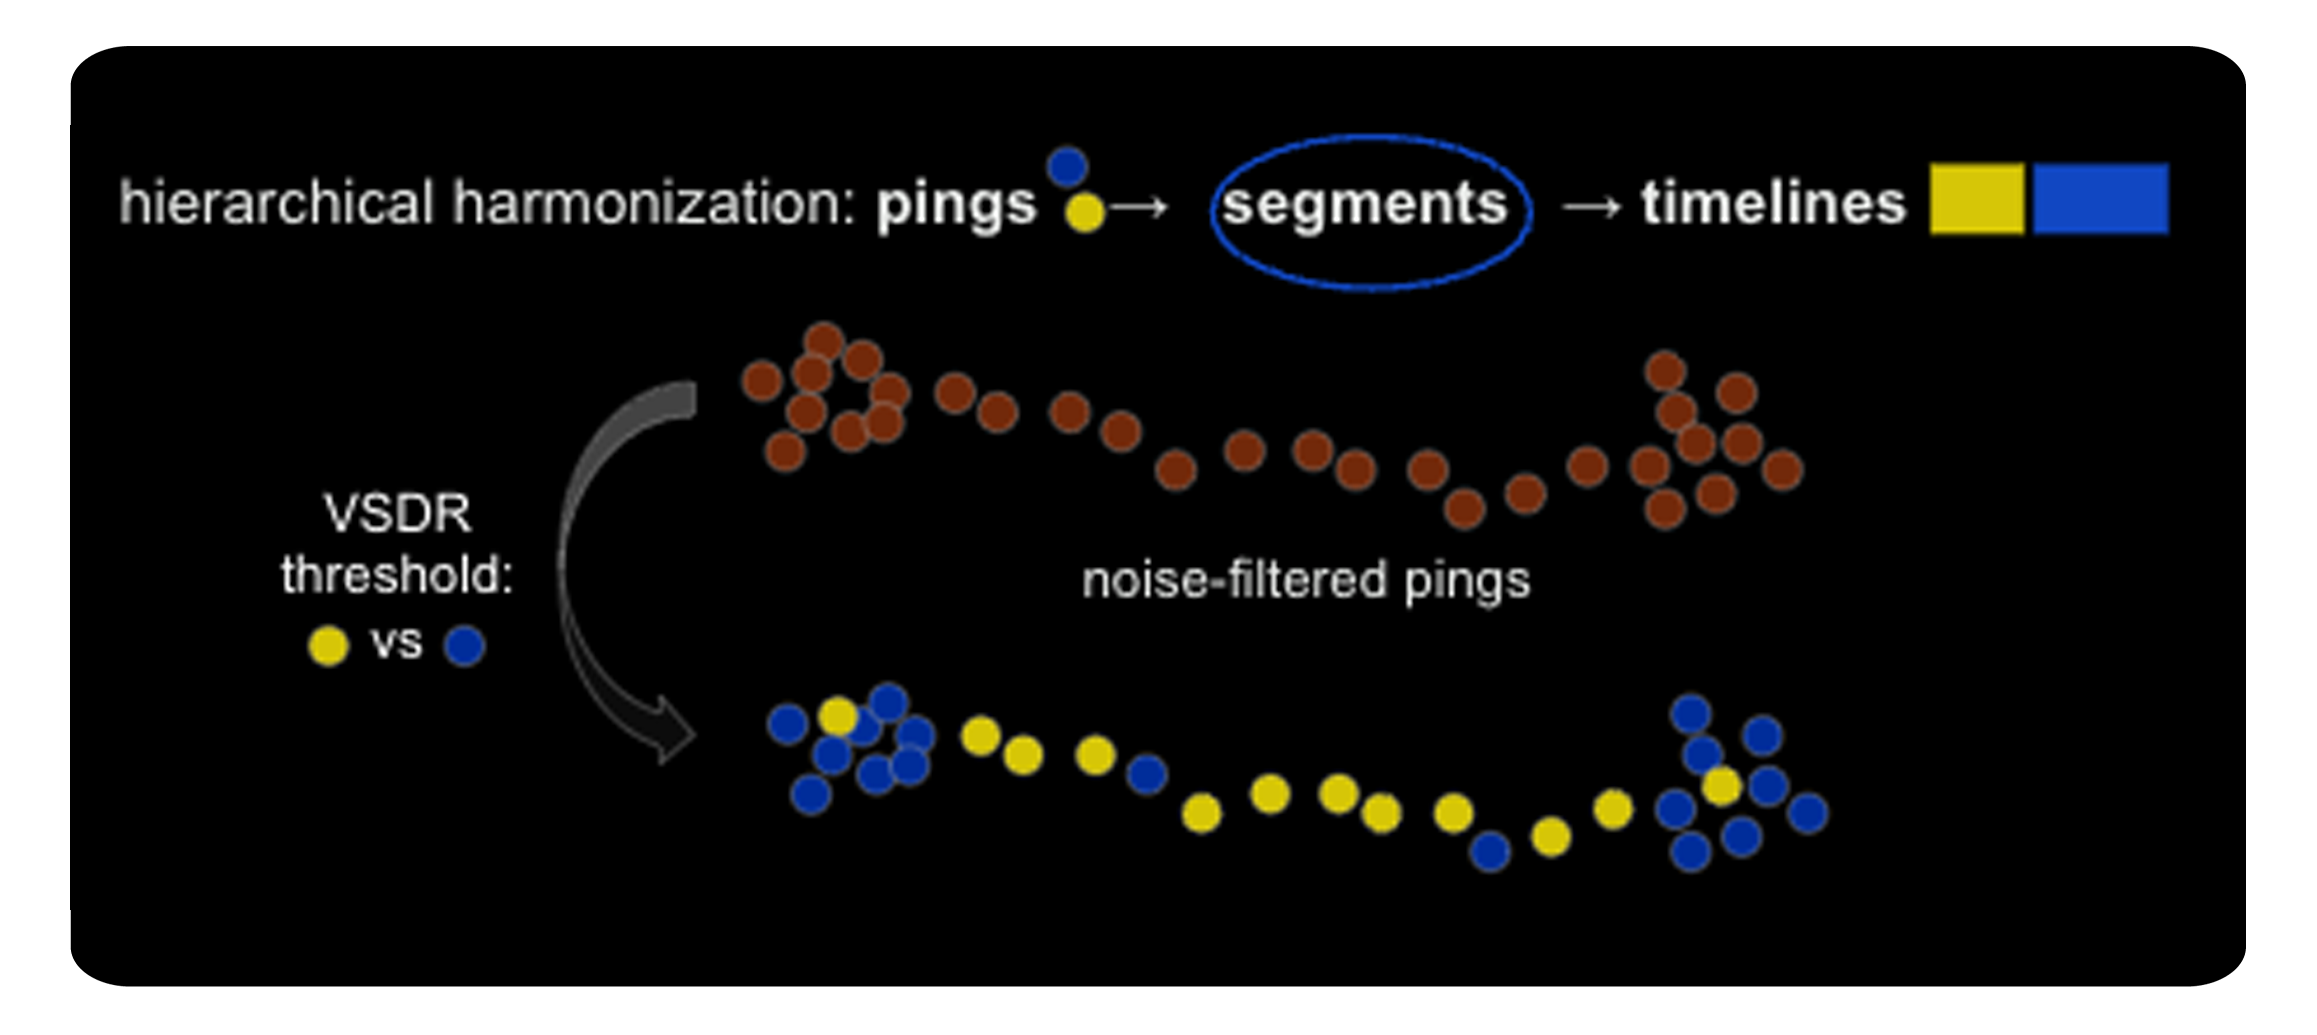
The next step is a ping-level classification that tags pings as moving or at rest, using inputs such as the VSDR spaghetti shape metric.
Next, the pings are bracketed into moving and stationary segments, with some tolerance for mismatch between ping type and parent segment class.
In the visual above, the pings within a segment are harmonized or homogenized.
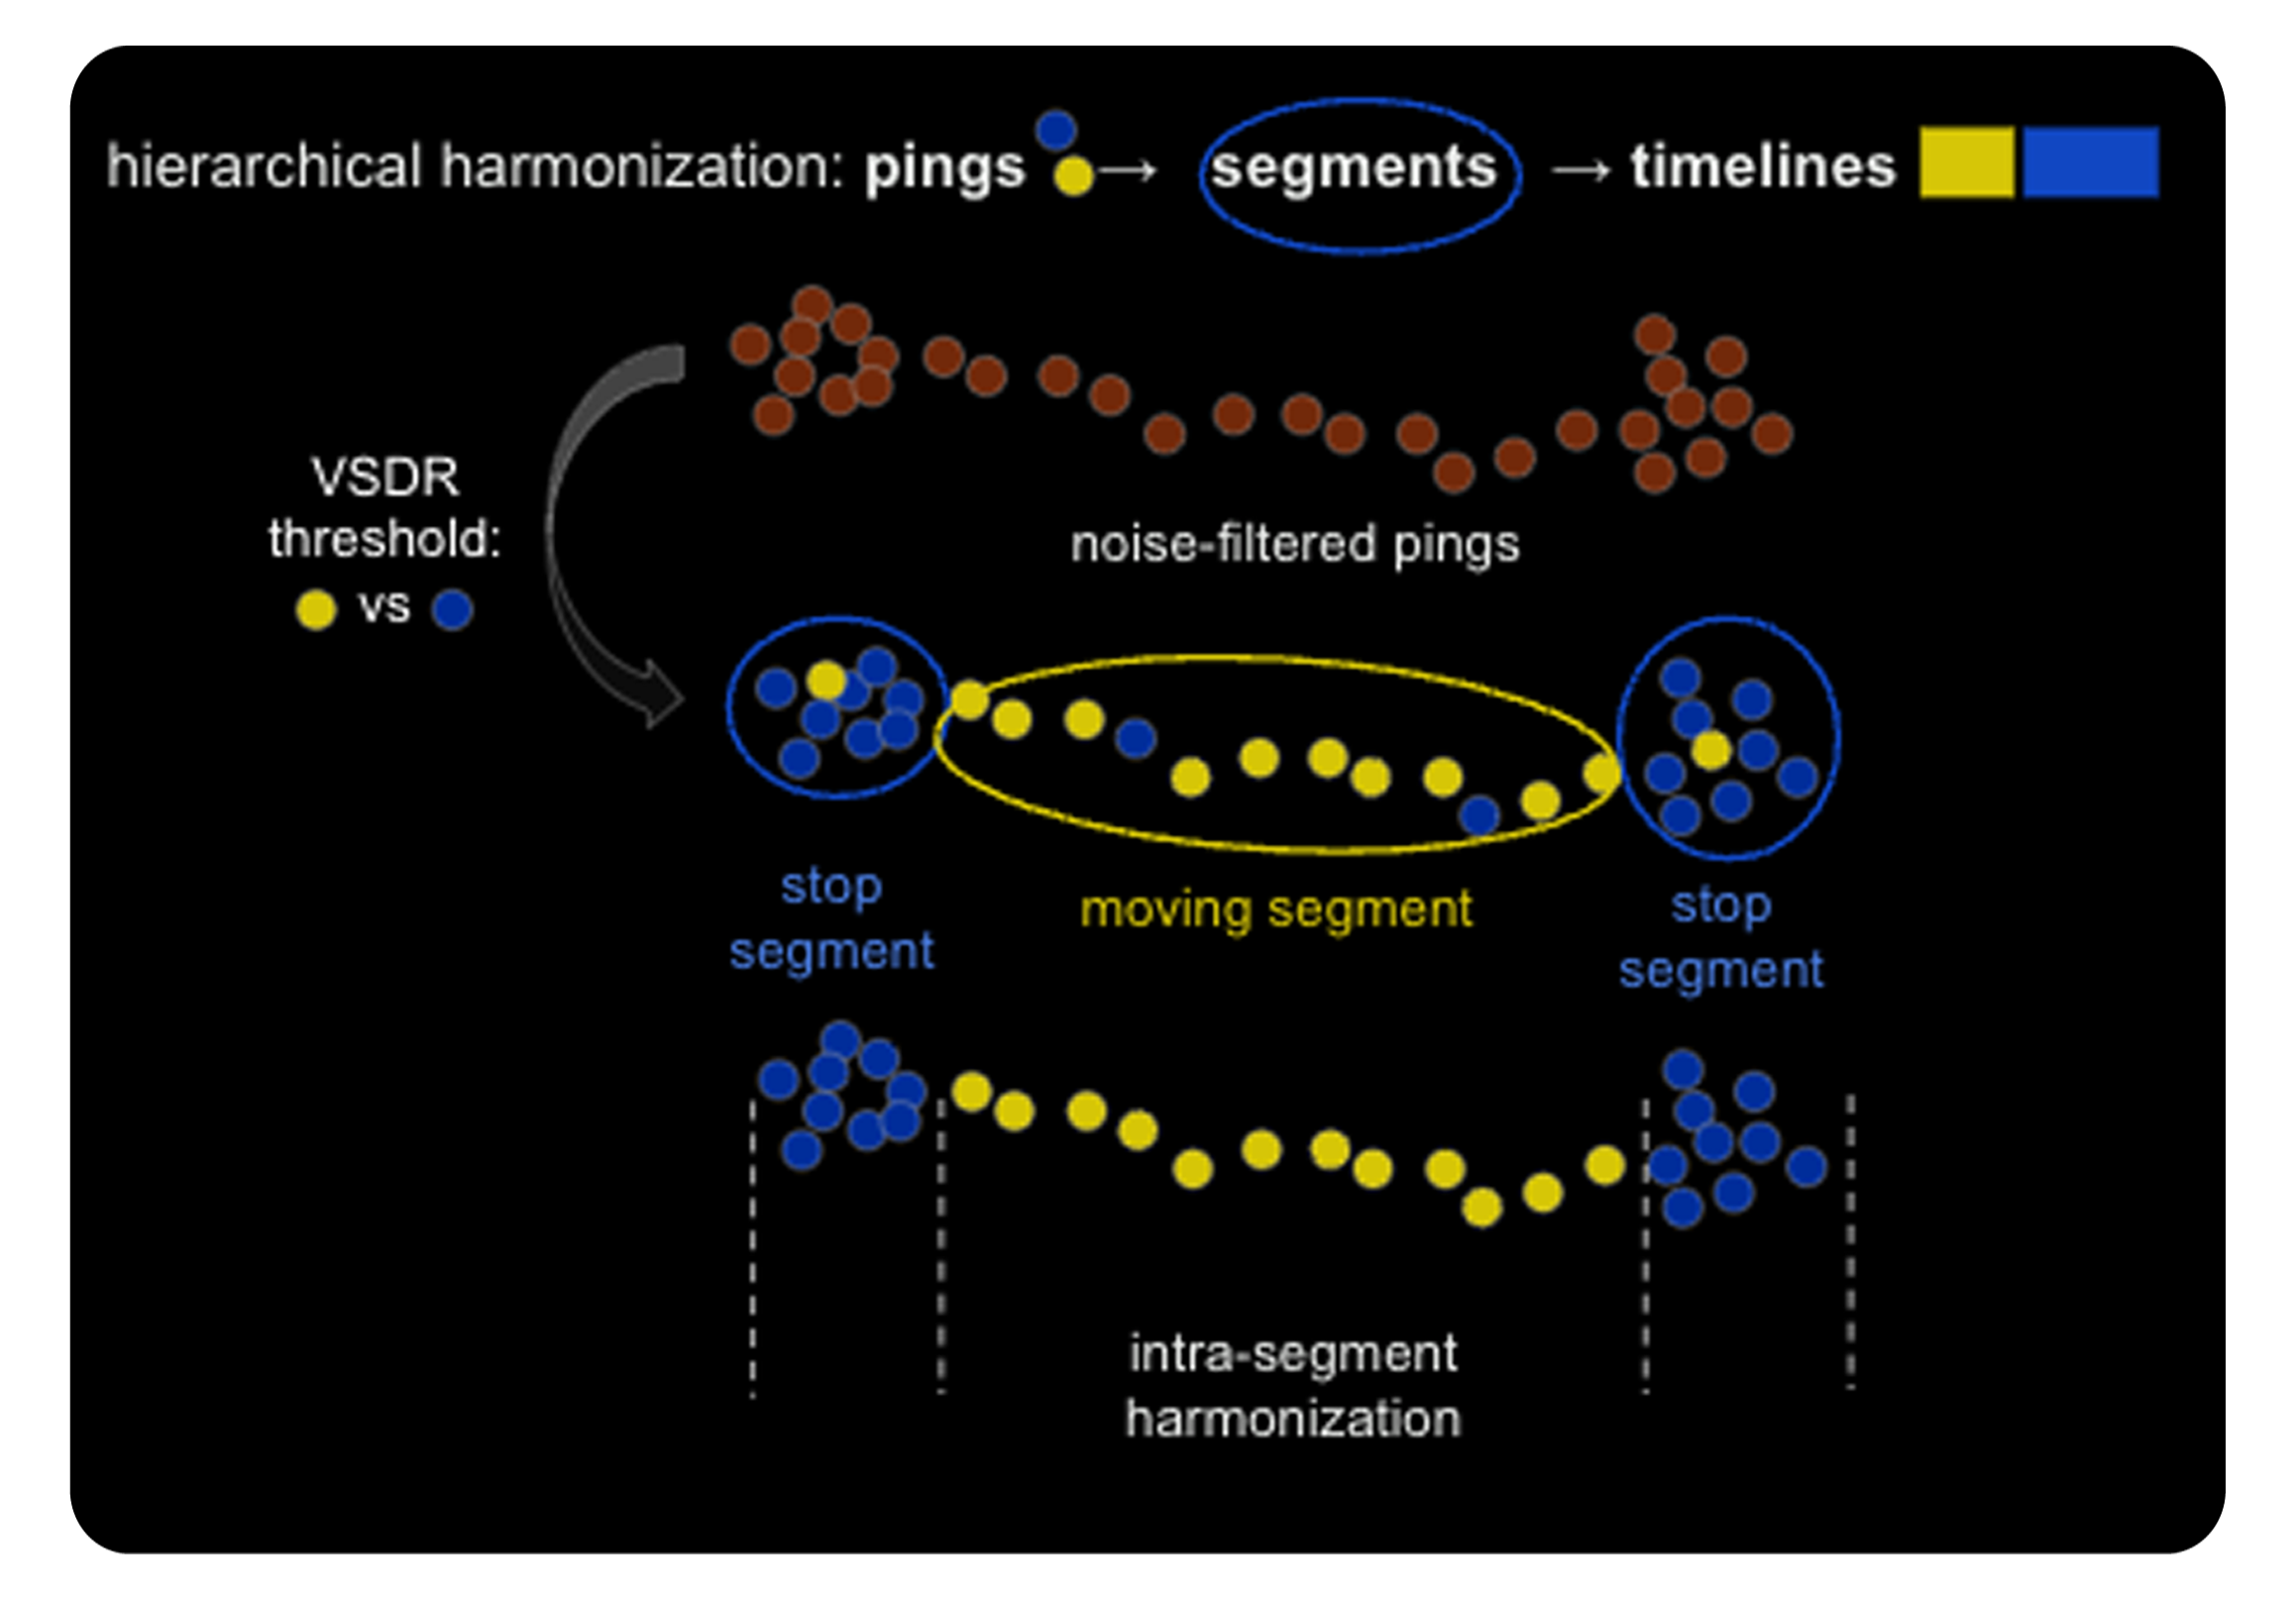
From the sequences of moving and stop segments, a complete user timeline is created throughout the day, for data from a particular source provider.
The final stage of harmonization involves the reconciliation of multiple timelines, created from each third party source.
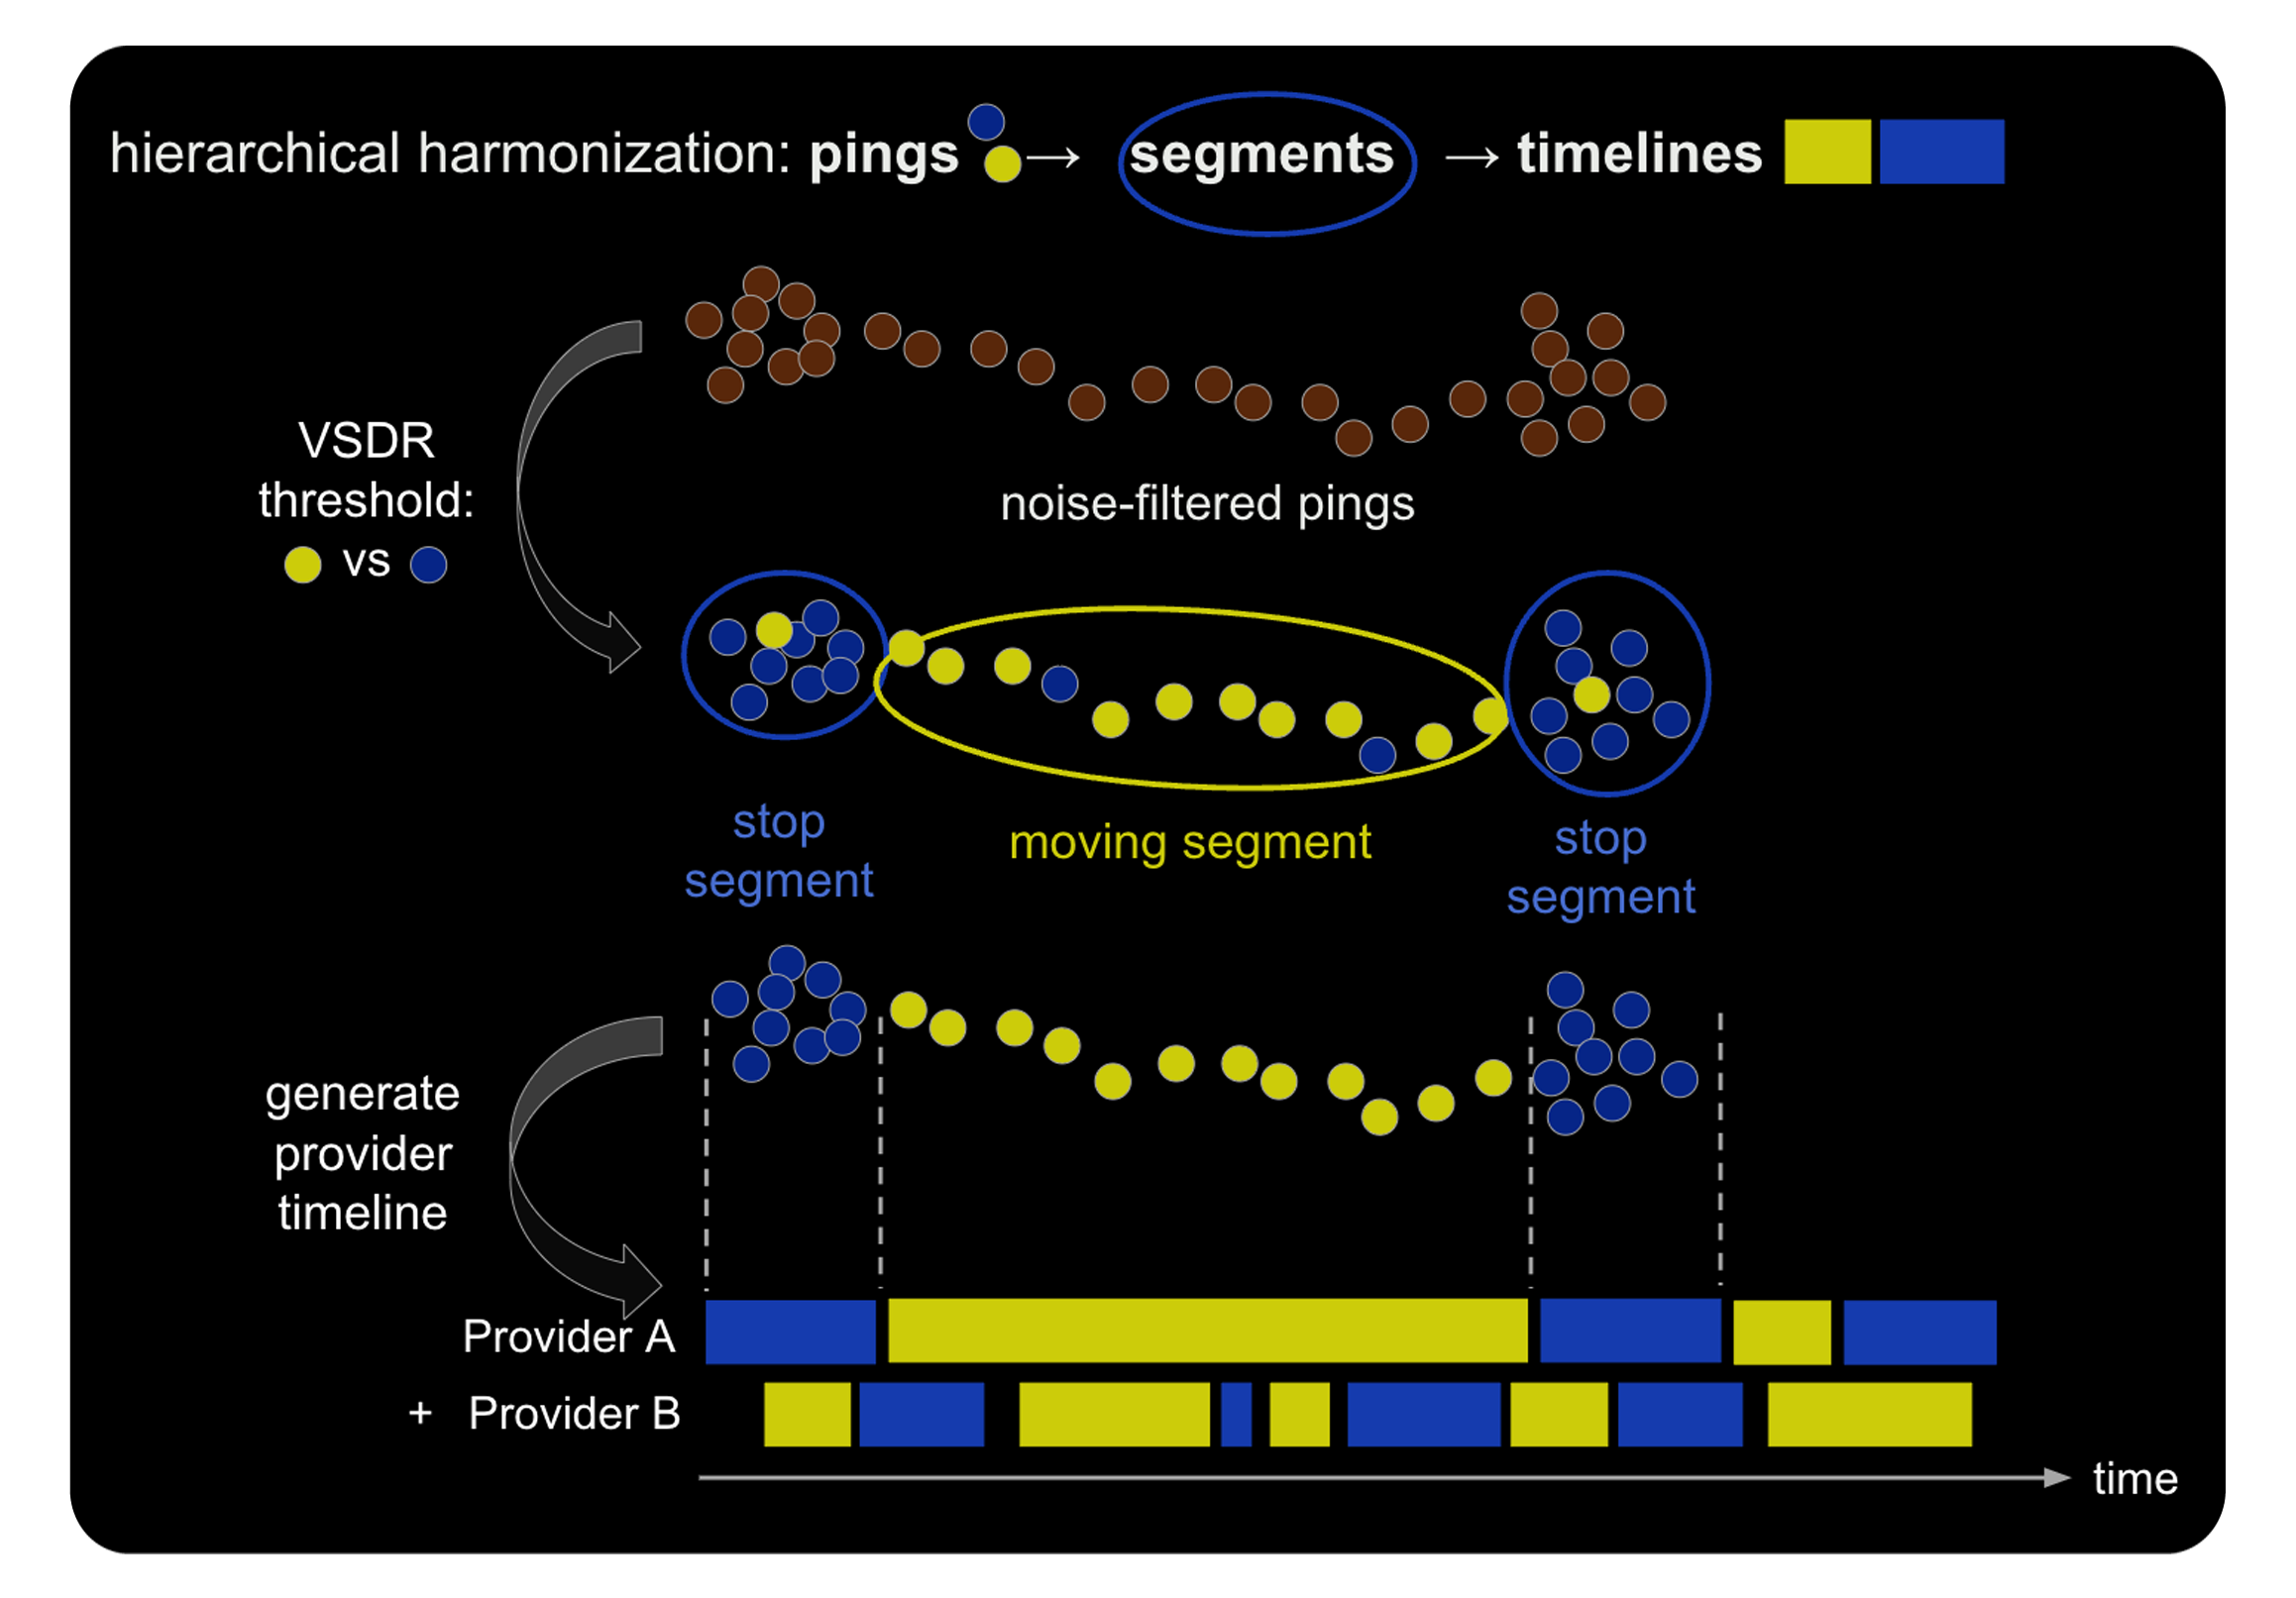
These multiple timelines undergo a proprietary data fusion process to become a single amalgamated timeline for that user or device. In the visual above, there are two providers.
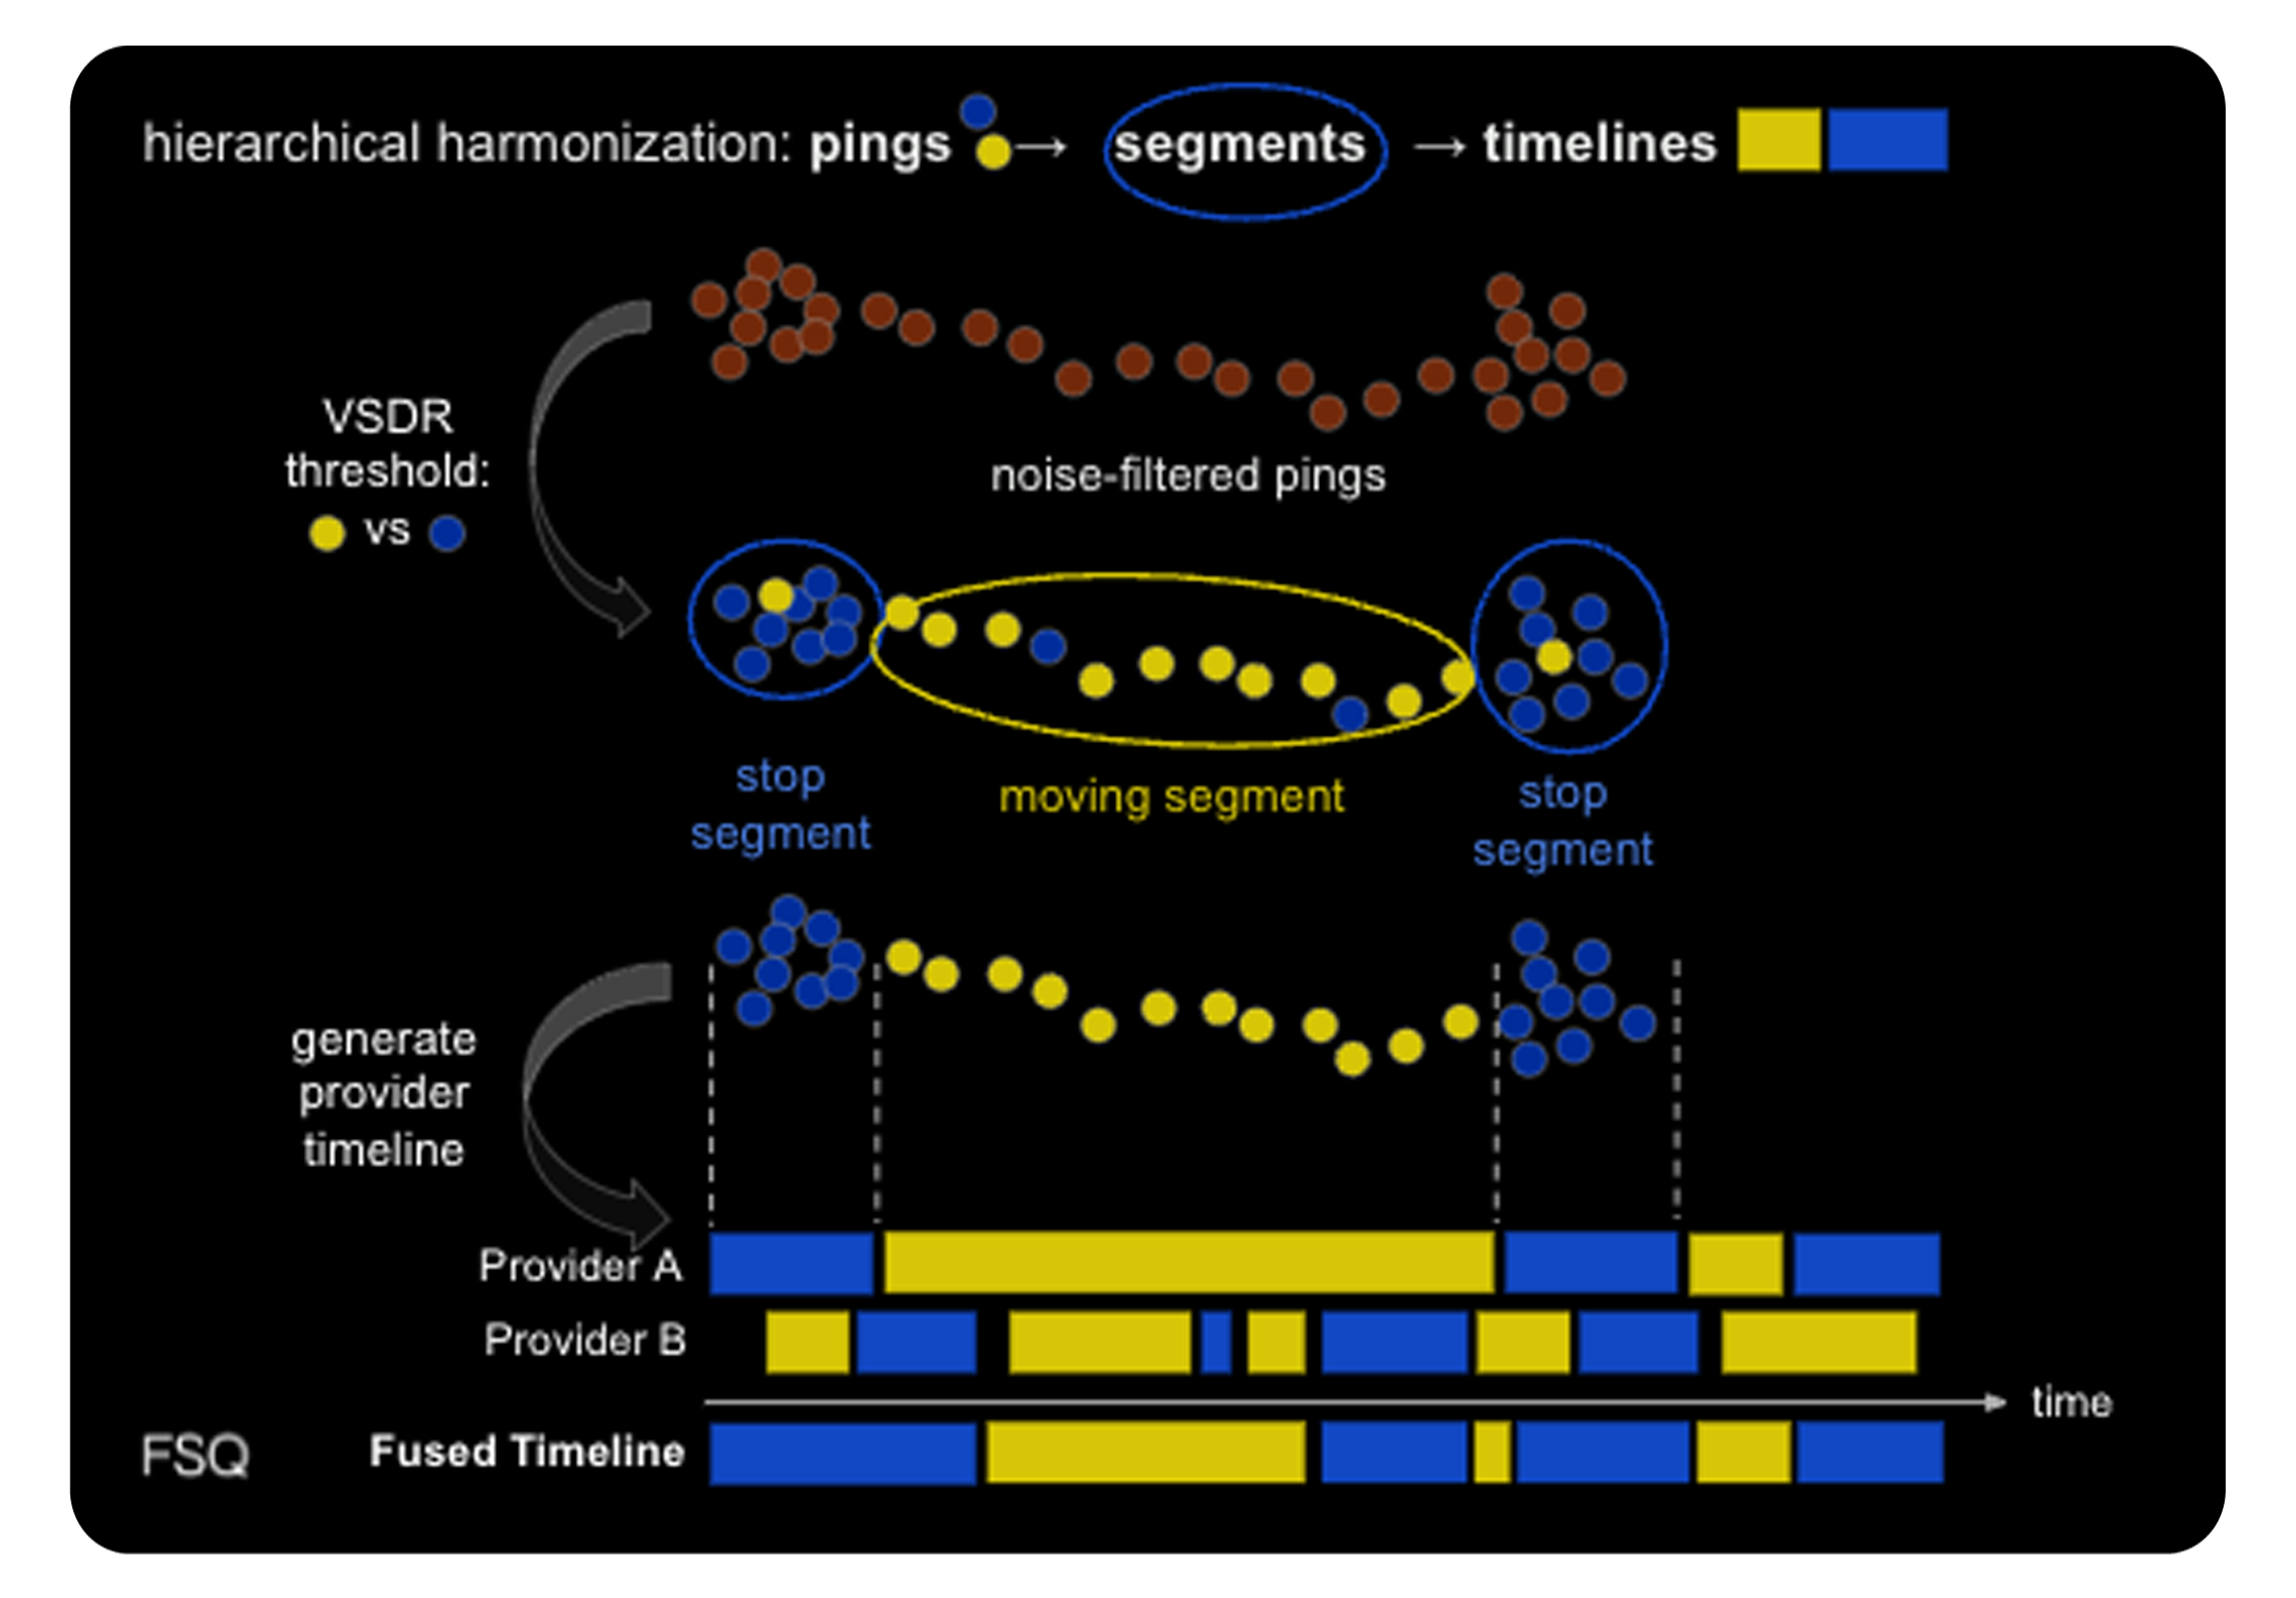
However, there might be ten or more source timelines to fuse for each device.
One may think of these timelines like DNA sequences. Although we have only discussed two segment types of moving or stops, the next level of complexity means breaking stationary segments into home visits and OOH. For movement, it can be segmented further into pedestrian and vehicular movement, therefore there are at least four components to these temporal DNA sequences.
The goal of making the fused offspring timelines semantically meaningful means answering questions like; where is the user’s work? However, there are challenges with work designation, as up to 25% of the population doesn’t work 9 to 5 hours. It is not always as simple as asking where the device spends its time during the weekdays.
There are plenty of challenges as we build these models for movement. As the leading location technology platform, Foursquare has a process in place and is actively engaged to continuously develop new and better approaches to deliver quality data using a sophisticated movement engine and pipeline.


