Before diving into lambdas, trees, and joy functions, we’ll start this overview of Foursquare’s Snap-to-Place technology with background on unique aspects of Foursquare’s proprietary geospatial technology platform and the extensive research we’ve put into our home-grown algorithms. In this post, we’ll explain the power of a phone’s data and how we derive accurate, privacy-first location insights via customized applications of machine learning methods.
The Power of a Phone’s Data
With our established and massive (16B+) check-in dataset, we’re able to frame location intelligence problems as supervised learning problems, with the goal of creating a model of the world over time using labeled data points. Many others in our industry, by contrast, have to solve unsupervised learning problems, with the goal of discovering patterns in unlabeled data from which models can be built. The problem we are solving is quite different.
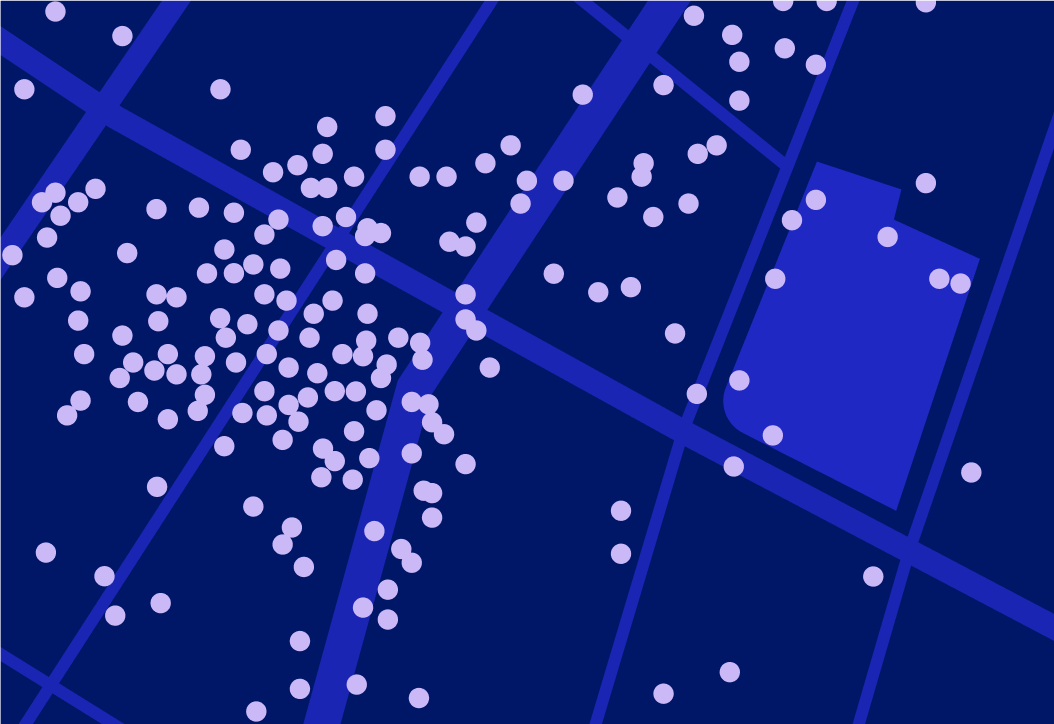
Here’s how the world looks to a mobile phone in an unsupervised setting, with each black dot representing a visit, as viewed by the noisy location measurement mechanisms on a phone.
Here’s how that data appears to us, in a supervised setting with each point tied to an explicit check-in at a venue:
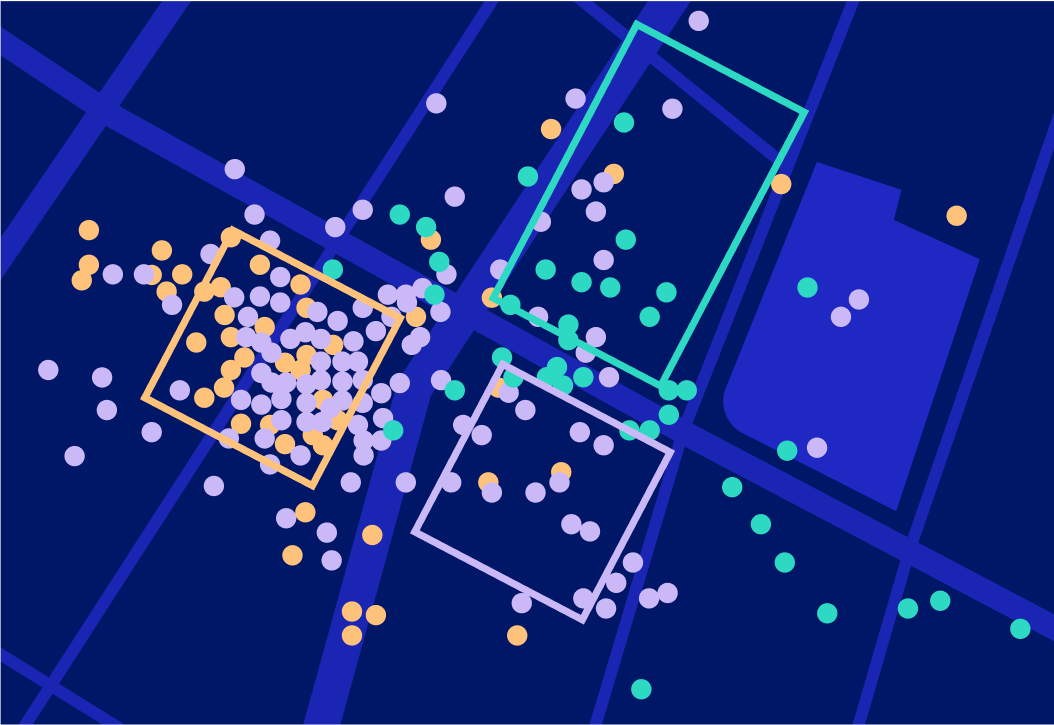
Phones use a variety of sensors to estimate latitude and longitude, including wifi signals and cell-tower triangulation. Occasionally, a mobile device may fire up GPS sensors when the OS decides it’s worth the battery spend. At the end of the day, the error between where the device thinks it is and where the device actually is can be greater than the distance between two venues in a dense urban area. The red, blue and green rectangles shown in the visual are the cartographic locations of three venues in New York City. The corresponding dots are labeled check-ins; notice that almost none of the dots are where they’re supposed to be (but they’re also not random).
The Snap-to-Place algorithm at Foursquare is a non-linear model (a gradient-boosted decision tree) built from R&D based on billions of labeled check-ins that we use to snap billions of other unlabeled visits to venues. A venue is any place in the world that we know about, from mom-and-pop restaurants, to concert halls to boutique fitness studios. Snap-to-Place supports the APIs that a myriad of companies — such as Uber and Samsung — use to identify and tag locations, as well as the movement data that powers other Foursquare products like Attribution.
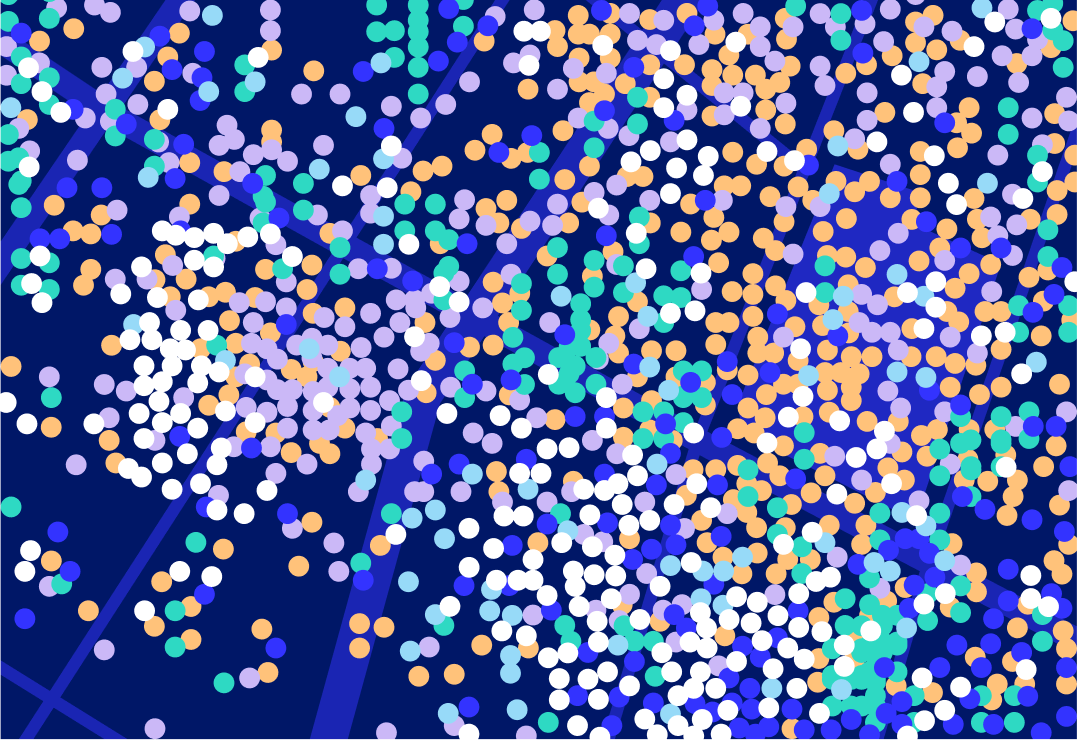
Even with these labels, real-world data gets messy. Here’s an example of a New York City block. While the colors correspond correctly to venues, it’s not clear where exactly these venues are. So while we have an edge on our competitors from our data, the conundrum is not less complex. It instead means that we have more interesting problems to solve.
Challenges for the Industry: Why is Indoor Retail so Hard?
There are several open challenges in the location intelligence space that remain largely unsolved. It is perhaps obvious that dense locations pose a challenge. However, sparse areas pose a different obstacle, as do places where the third dimension (altitude) matters — not to mention places that are unpopular. For example, consider a houseware store on the fifth floor of a building that also contains generic office space. Let’s say there’s a popular coffee shop on the ground floor next to a new restaurant that just opened up. When users of our core technology stop somewhere in the vicinity, but do not explicitly check-in to a venue, it can be difficult for us to differentiate visits to the houseware store, an office, the coffee shop or the restaurant.
Indoor retail is the confluence of many challenges in the space: a dense area with relatively small venues that change ownership and stack vertically. At Foursquare, we have addressed this problem by framing it as an explore/exploit learning setting.
Framing Business Challenges as Explore/Exploit Opportunities
Each venue in the Foursquare database is represented as a probability distribution function of visit frequency across space and time. The more data we have at a given venue, the more clarity our model has. A major differentiator for us is that these “place shapes” are often separate from where the venue is cartographically, due to the inherent bias through the phone’s view of location measurements.
Here’s an example, looking at Madison Square Garden in New York City over the course of 7 days:
An initiative at Foursquare has been to go after less well-mapped venues by framing our challenges as explore/exploit scenarios, also known as “multi-armed bandit” problems. In machine learning, a multi-armed bandit is a “gambler” with many different “games” to play. Each game has some probability of victory, but that probability has to be learned by playing. The gambler has to balance risk, opportunity cost and expected value.
Consider the previous case of the coffee shop near the houseware store. It’s likely that the coffee shop is the most popular place in the building based on check-ins. We have historical evidence that tells us what our likelihood of success is if we guess the coffee shop. Imagine that 90% of the times we’ve guessed this coffee shop, we were right. Analytics of this data alone cannot always tell us enough about the places we might have missed. In order to get better as a gambler, the bandit must put money into other games. We have to predict the houseware store sometimes in order to learn.
The framing of Snap-to-Place as an explore/exploit problem gives us levers to play with. We can decide when to make a safer guess and when we’re playing with house money. One of our core services, the contextual ping (shown above), has a required accuracy level that we maintain, let’s call it “P.” We want P% of our pings to be at the correct venue with no explicit action needed. Using that as our baseline, we have the option to be more or less aggressive based on how well we are hitting our standards. Accuracy is a currency we can spend in the pursuit of improving our map of the world.
Here’s how we can trade off small amounts of accuracy (in the form of confirmation rate):
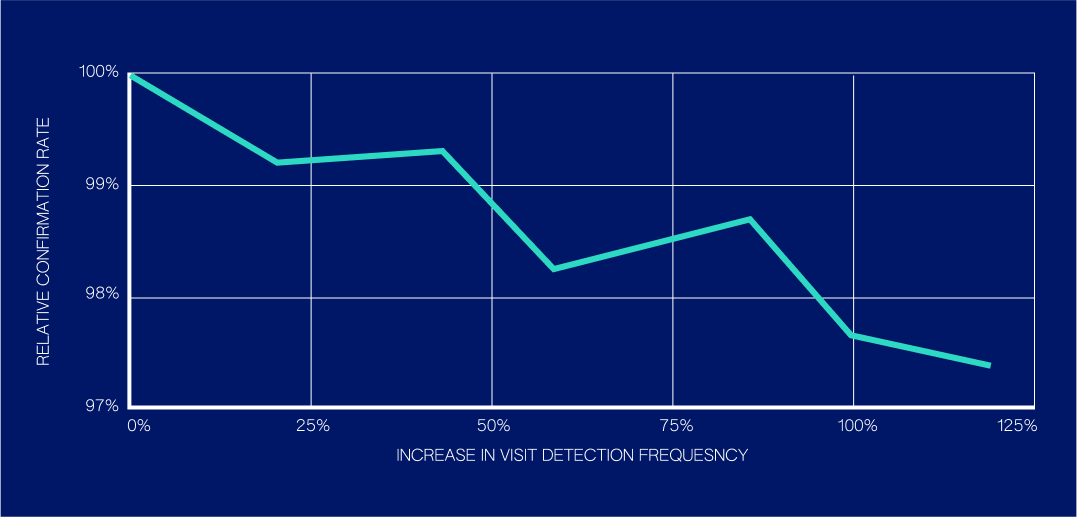
For a set of interesting commercial venues we experimented with, we were able to double our volume of confirmed visit predictions at those venues while taking about a 2.6% relative hit in confirmation rate. Having a set of strategies we can observe as we turn our knobs gives us a Pareto Frontier to choose from (a set of solutions that represents the best trade-off between all the objective functions). As we will describe, understanding these Pareto trade-offs enables us to express trade-offs through utility functions; internally we call these joy functions, because they allow us to think about product trade-offs in terms of the direct benefits to end user happiness and client happiness.
Getting the Algorithm to Compromise: Importance Weighting and Lambdas
Continuing on the theme of quantitative compromise, we can coax our model generation algorithm to care about venue coverage at scale by rewarding it accordingly. Decision tree generation is a greedy process, and the resulting trees, while pseudo-random, optimize for an objective function and the provided examples. As far as the algorithm knows, these examples are the only events in the world. Importance Weighting allows us to motivate the model by applying weights that reward the model more heavily for getting interesting places right (but still offer no reward for wrong answers).
Here’s what this enables:
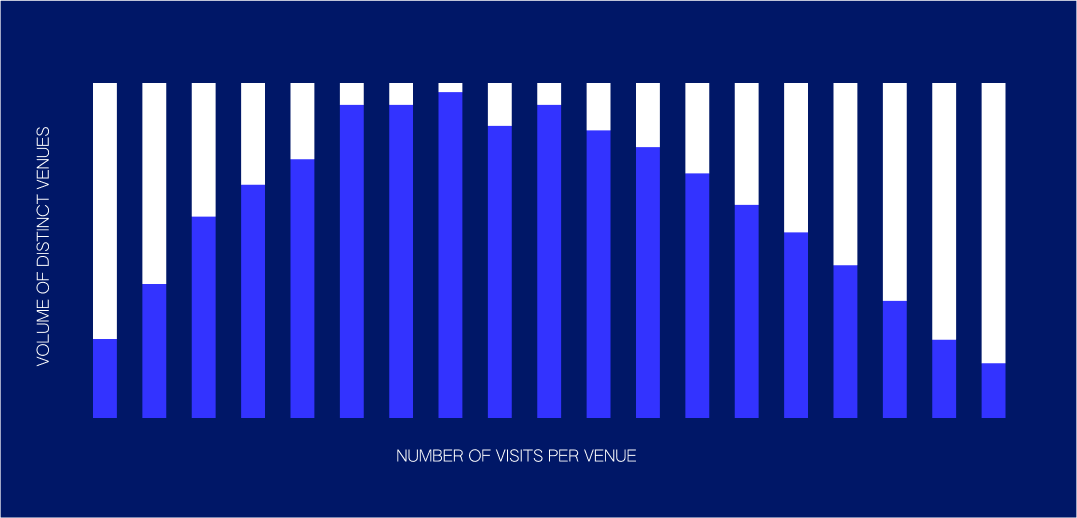
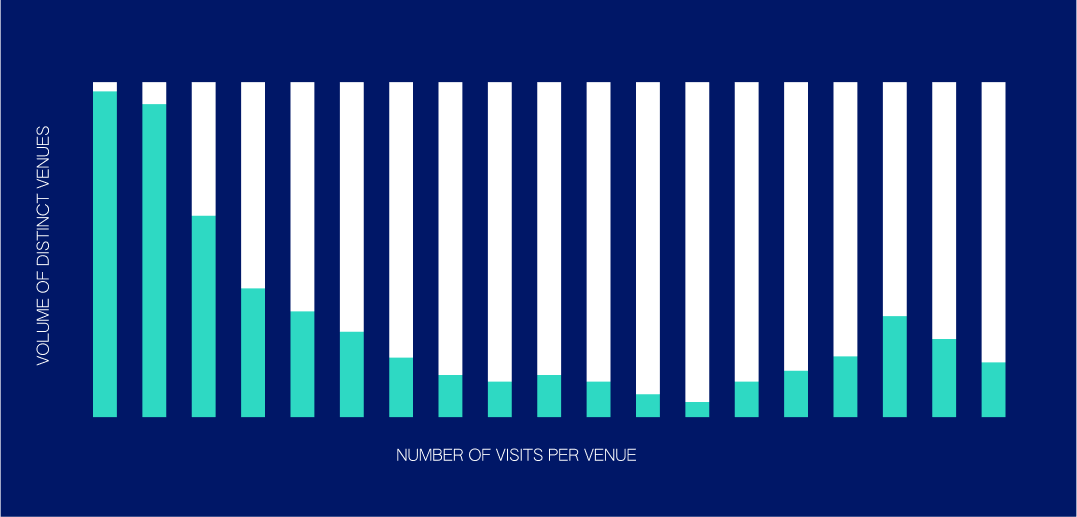
Like many natural phenomena, check-in behavior follows Zipf’s Law (above right), the distribution that models how there are greater amounts of unpopular places than there are popular places. A naive sampling distribution is shown on the left. A textbook machine learning approach is popularity biased; we observe popular places too often. By reweighting our examples, we can make our training set match Zipf’s Law. The degree of aggressiveness in our reweighting approach is what we internally call the “lambda factor.” This name comes from lambda, a variable we slide between 0 and 1 that provides a continuous transform between the two above distributions, allowing us to smoothly tune the aggressiveness of our model.
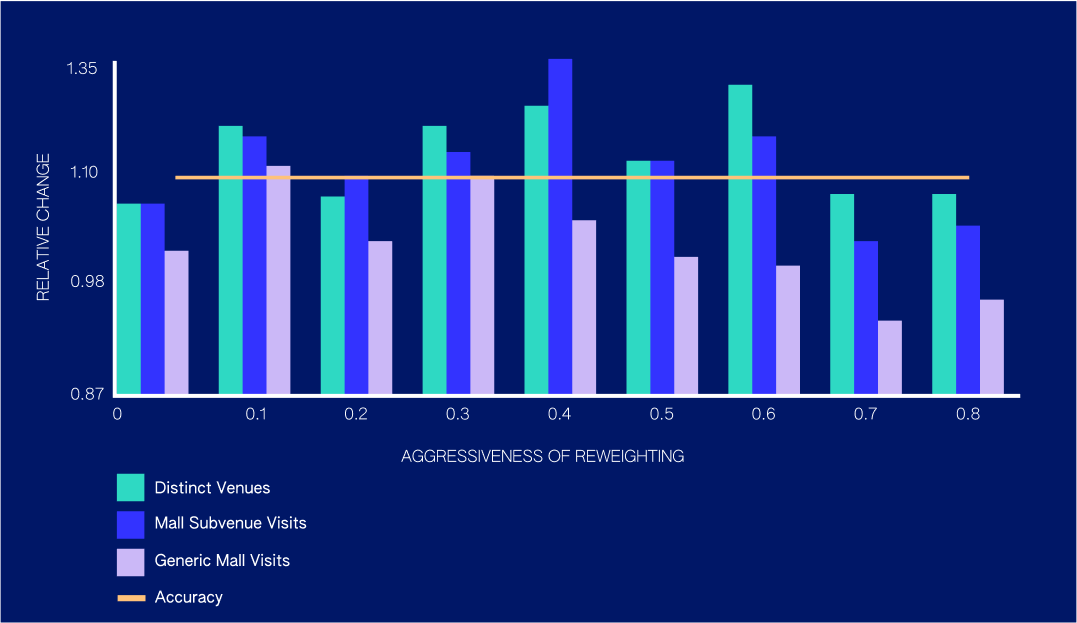
Overall, we were able to achieve a 12% increase in distinct venue detection while also improving our performance at stores within commercial complexes, while losing only 0.5% of our accuracy. Effectively, the model leans toward newer venues, but only in cases where the decision is close. Some venue categories traditionally see less consistent foot traffic volume (e.g., mattress stores, jewelry stores), and this method improves our ability to detect visits for some of these categories by 50% or more.
Joy Functions and the Pursuit of Specific and Diverse Venue Data
As we continue to improve our pioneering Snap-to-Place technology, we focus on a holistic view of the value of visits, so that we can continue to generate novel information about the physical world.
A subtle distinction that continues to impact our thinking is the difference between an explicit check-in and a confirmed visit prediction. The likelihood of a check-in happening and the likelihood of a prediction getting confirmed are not the same. For example, it is reasonable for someone to check-in at JFK Airport and also confirm our predicted visit at the same time to the Muji shop inside a terminal. These data points are different, but both correct because the choice of social broadcast biases the expression of the data.
One of our approaches to balancing this is to wrap our visit predictions in linear utility functions, which we call “joy functions.” When we make a prediction speculatively, we aim to predict where the device was in real life; we also factor in how likely it is that someone would agree with our prediction and how informative that data point will be if accurate. In this way, we ensure that we are learning only from true data points, while still encouraging our users to respond to predictions that are of higher value and contain greater information density. The more specific, diverse and novel a visit is, the more we learn about consumers and how they interact with the world. The accuracy of a prediction doesn’t capture all aspects of its value to our business and to client happiness, and joy functions help us capture more of that value.
The Takeaway
Snap-to-Place technology ties physical locations to meaningful venues and thus enables the connected view of the world we have at Foursquare. Our investment and commitment to machine learning continues to be a driving force behind our business, and our belief that the connectedness and insights of our data are more powerful than the sheer volume we possess.
Reviewed by: Ariel Eck


