We just launched Unfolded Studio, a new platform for geospatial analytics, which we described in our previous post Introducing Unfolded Studio.
While Unfolded Studio is now a production quality tool that is already being used by our by customers to solve geospatial problems, it only represents the initial foundations for the tool we have set out to to build.
We founded Unfolded to build a completely new kind of platform designed to solve the hard problems in geospatial analytics, and Unfolded Studio is our attempt to define what the future of geospatial tooling should look like.
We hope this post will give you a glimpse of our vision and make you as excited as we are, not only about what Unfolded Studio is today, but more so about what it will become!
A Changing Market
Why build a new geospatial analytics tool? It’s not only a question of opportunities created by new technology, but also by shifts happening in the market.
We believe that a big shift is taking place in the market for geospatial tools. Geospatial work used to happen primarily in GIS departments, however increasing amounts of geospatial analytics is now instead done in data science departments.
Data scientists work differently, with unique needs and pain points. They use different tools and need different integrations. Complex features built for legacy GIS use cases are often of limited value for these new geospatial users, because the problems they are facing are different.
Unfolded Studio does not target traditional GIS use cases. It is focused on big data analytics and solving hard geospatial problems from the perspective of data scientists and data analysts.
Geospatial Challenges
More than visualization and data management, a good geospatial platform should make it easy for its users to draw conclusions and extract actionable insights from their data.
Unfortunately, geospatial analysis is difficult. Datasets can be extremely large or organized in radically different ways. Geospatial joins are tricky even when datasets have the same geospatial structure. Heterogeneous joins (e.g. joining tabular and raster data) are harder still. And adding the time dimension to the mix takes the difficulty up yet another order of magnitude.
A good geospatial tool should be able to handle these difficulties in a way that is easy, intuitive and smooth, even when datasets are large. It should integrate with the data analytics workflows users are already employing and guide them towards the conclusions they are looking for.
In this post, we present three big geospatial problems that Unfolded is currently focusing on.
Problem 1: Handling Big Data
The GPU-accelerated deck.gl-based technology stack that powers Unfolded Studio can fluidly display million-row tables in the browser. However, real world datasets are often bigger. 100 million row datasets are no longer uncommon.
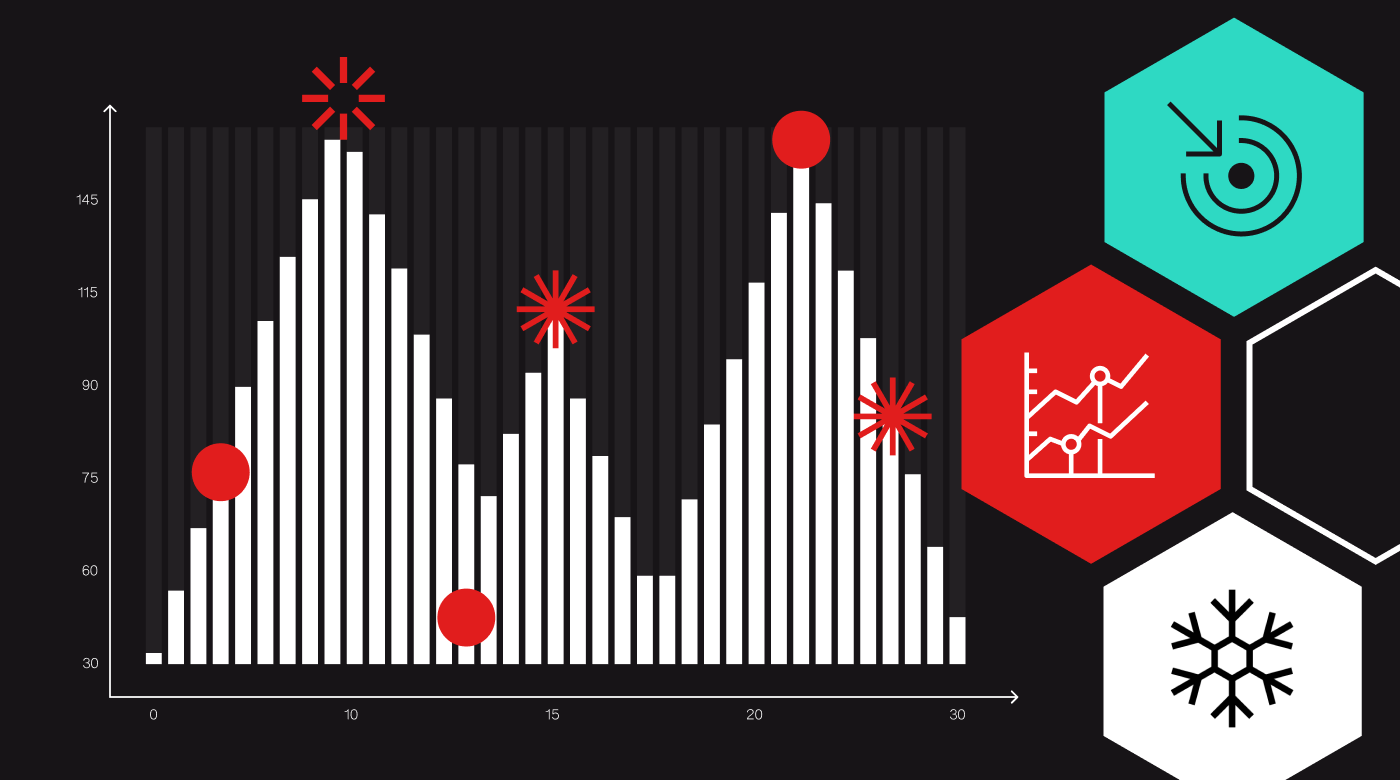
To effectively remove dataset size limitations, Unfolded is building an end-to-end architecture for processing very large datasets, with the goal of gradually making it possible to interactively work on billion-row datasets in Unfolded Studio.
A key focus for Unfolded is reaching interactive performance on very large datasets using inexpensive infrastructure. There are tools that can perform off-line batch processing on very large geospatial datasets, however the iteration cycles are slow, leading to low efficiency for users. There are also solutions that use special high-performance backends that come close to interactive performance, but cost tends to be very high, which significantly limits usage.
Problem 2: Geospatial Unification
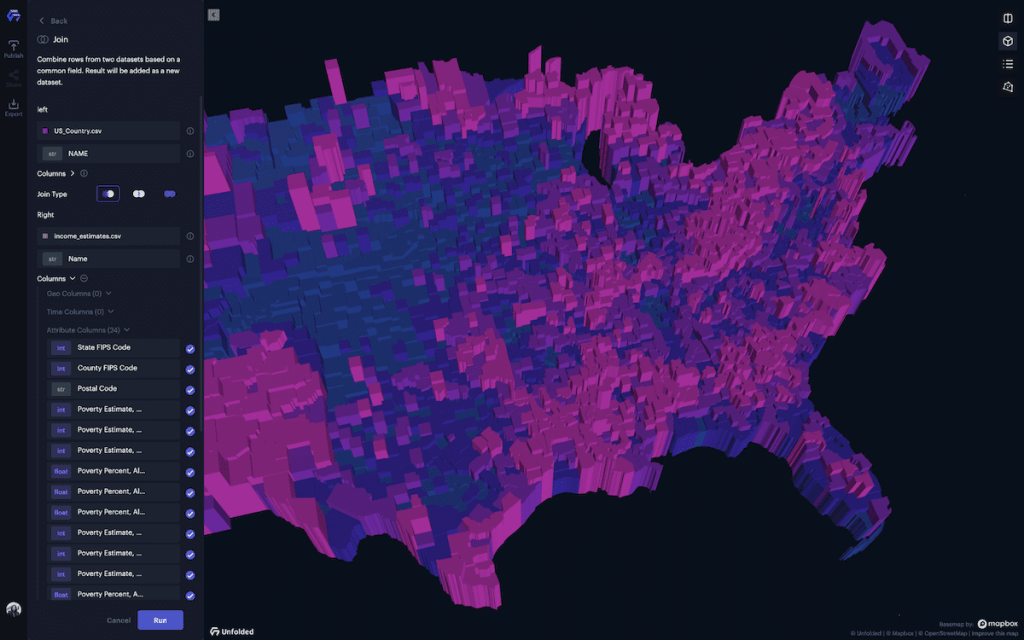
When working with geospatial data, users should be able to open the datasets they need, effortlessly join them and start looking for patterns, correlations and insights, without having to worry about where the data came from or how it is structured.
That’s why Unfolded Studio is being architected from the ground up for seamless geospatial unification. We aim to make spatial unification and geospatial joins seamless across not only the full spectrum of tabular datasets (such as point geometries, polygon geometries and implicit boundaries), but also across raster-based data sources.
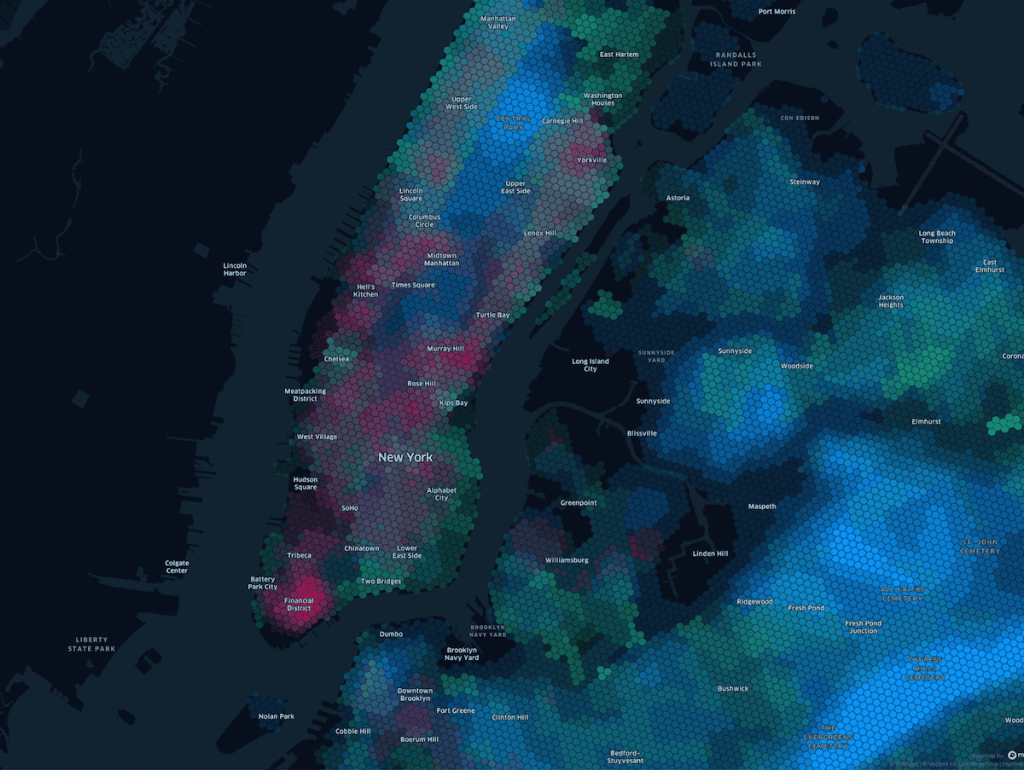
Our core mechanism for unification builds on the capabilities of the H3 hexagonal grid system, which we have been working on since its inception. Our goal is to unify data dynamically in the browser whenever dataset sizes are small enough, and in the cloud when required.
Note that Unfolded Studio already has industry-leading support for H3 and Placekey-indexed data, automatically recognizing and visualizing datasets equipped with such columns. In addition, custom columns and group by operations enable users to transform many datasets into H3 and Placekey forms, which enables them to be joined with other datasets.
Problem 3: Temporal Analytics
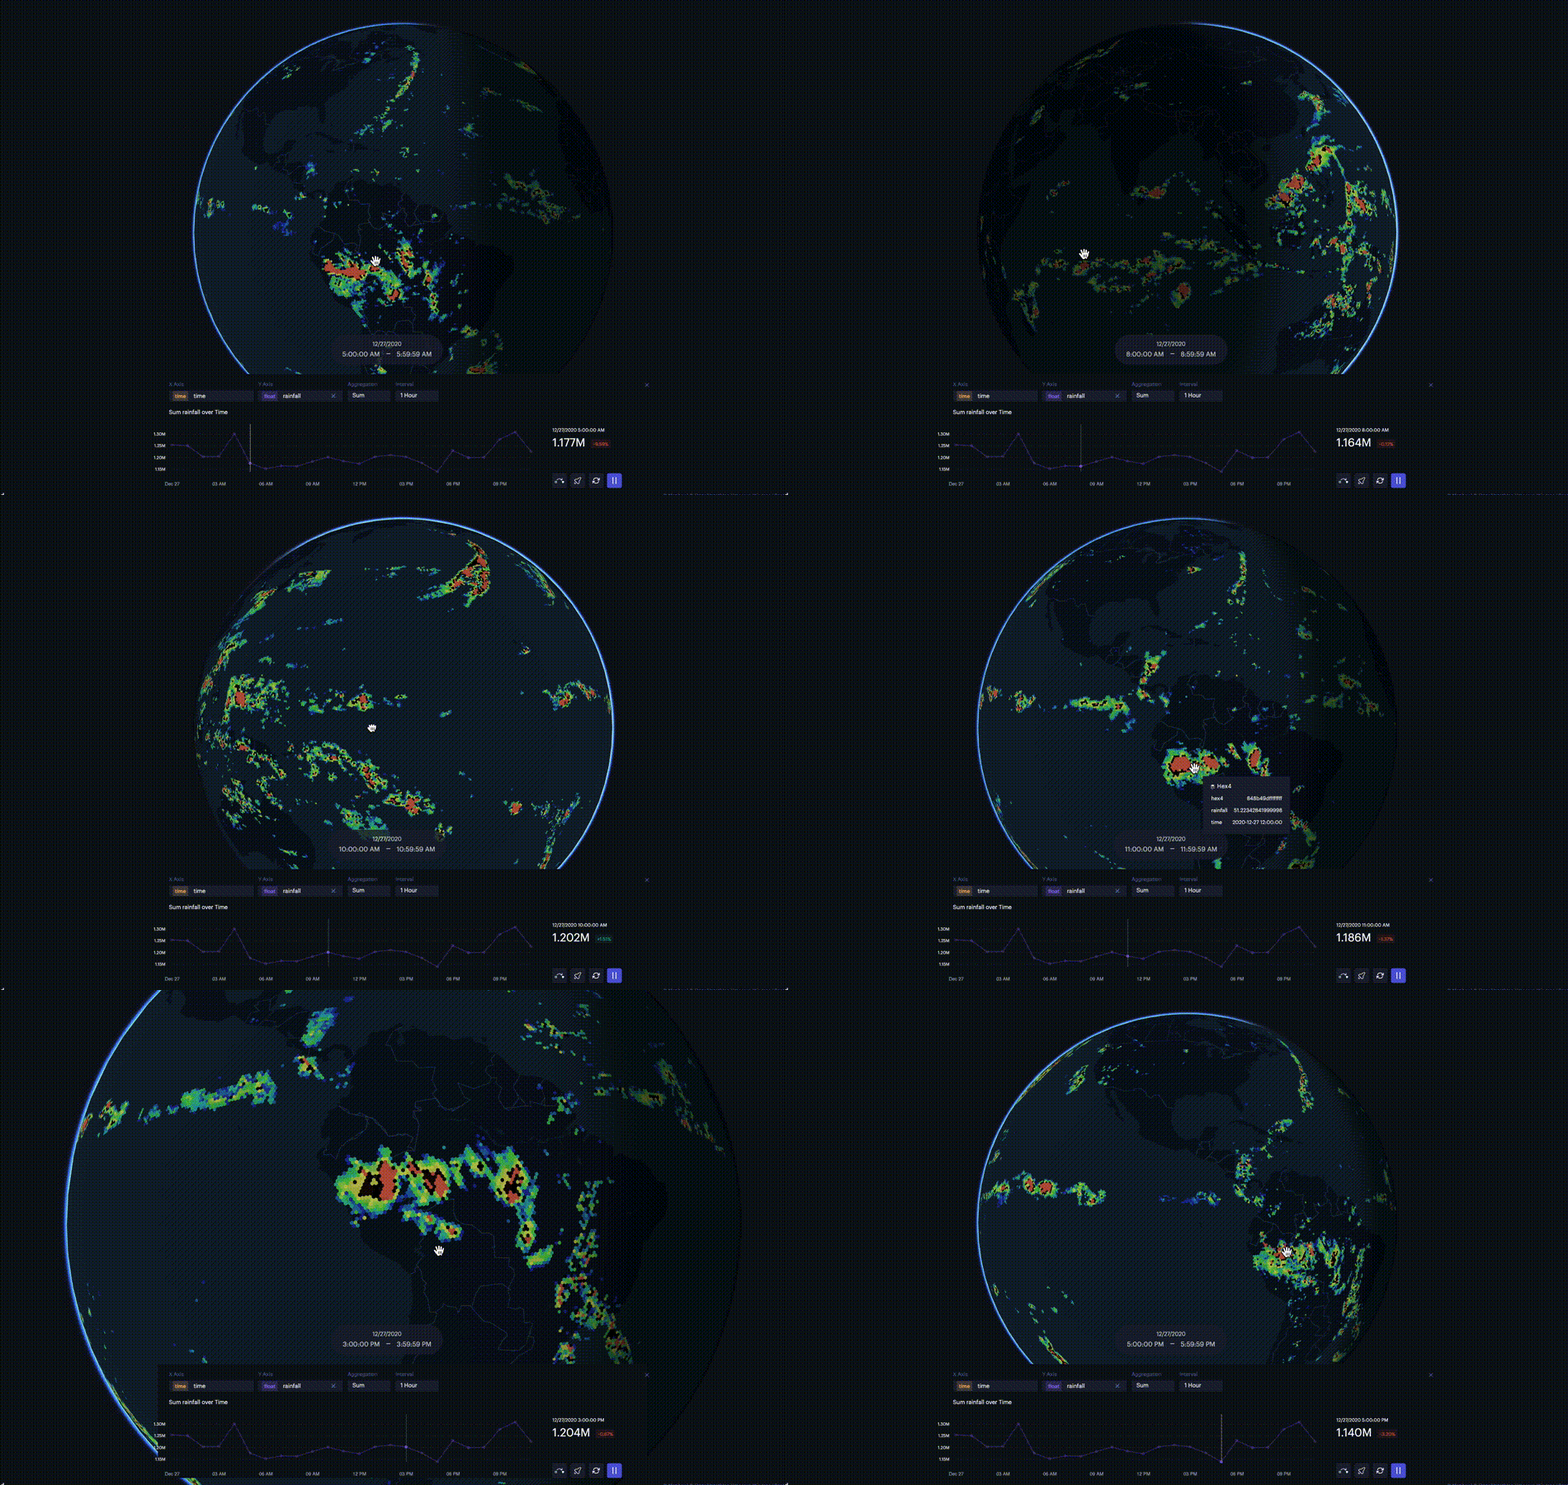
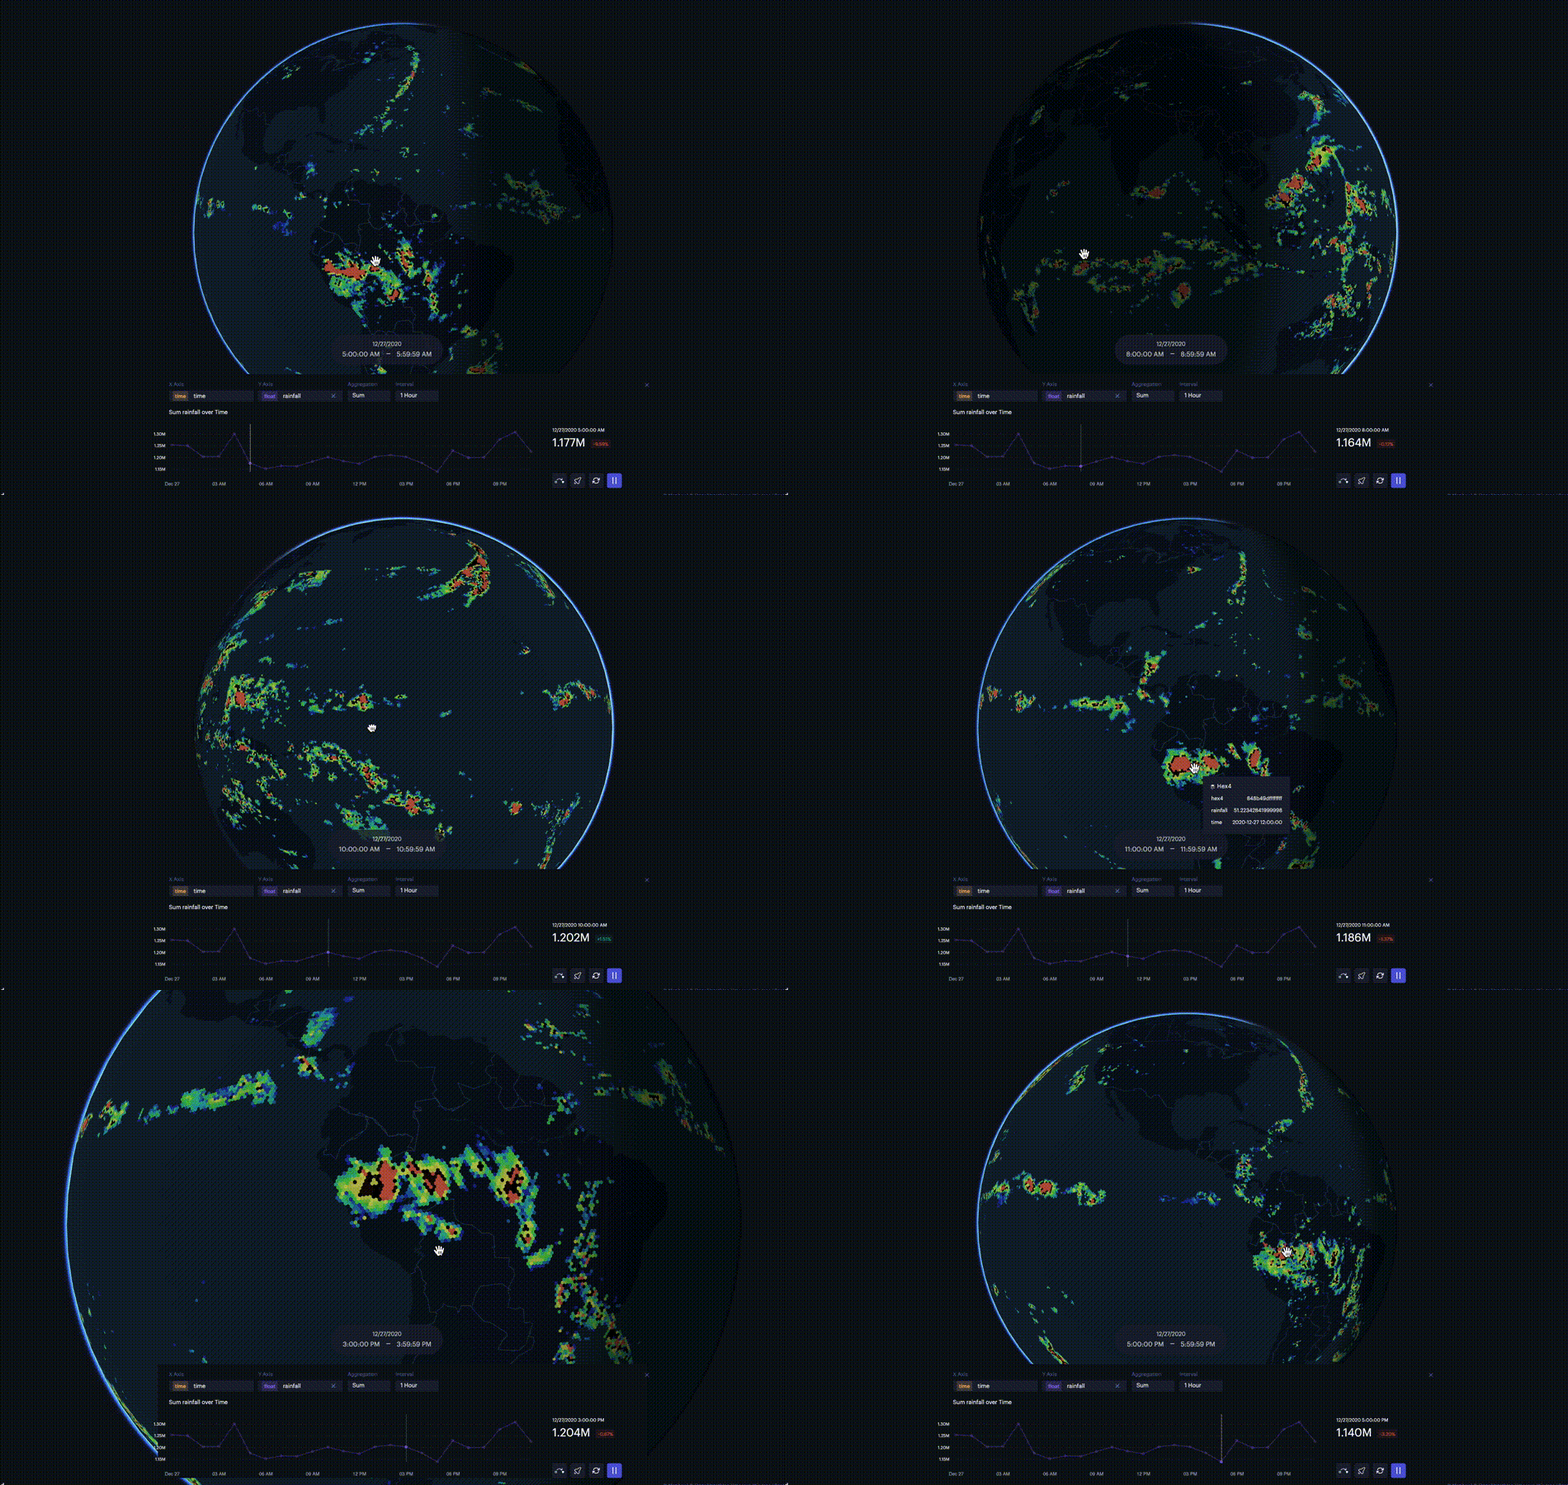
Another unique component of Unfolded Studio is strong support for the time dimension, meaning the ability to process, visualize and analyze datasets that describe changes over time.
Traditional GIS tools were designed for large, predominantly static datasets. For decades, such tools have been serving GIS departments across industry well. But today, the large geospatial datasets that are being analyzed by data science departments often have time components and data that connects multiple locations, effectively representing movement.
For such datasets, being able to visualize and analyze the time dimension is critical to making the right insights. For instance, GPS traces of delivery or transportation vehicles show the movement of objects over time.
Analyzing and visualizing factors like speed and congestion require tools that can handle the time dimension, and not only display but also animate datasets even when they get extremely large. Because the underlying technology stack behind Unfolded Studio (kepler.gl, deck.gl and H3) was originally developed at Uber to support some of the most demanding movement-related use cases in the business, like global ride sharing, delivery and logistics, Unfolded Studio already offers leading support for processing and animating time related data at large scales.

Going forward, we expect to add more advanced animation support for more data types, including very large datasets with pipelining services to help users work in real time with large data that undergo incremental updates.
We also expect to add advanced complementary animation features, including video capture from within Unfolded Studio with camera key frame animation and potentially integration with video post processing tools.
Start using Unfolded Studio today!
Intrigued by our vision for what the geospatial platform of the future should look like? We’d love to hear your thoughts. Sign up for a free Unfolded Studio account and join the Unfolded Community slack channel to get support and share your feedback.
