Since the COVID-19 pandemic began, we’ve been sharing how the virus is impacting foot traffic to a variety of places across the United States.
In recent weeks, states are starting to open back up and people are moving around in the physical world again. We’re seeing an uptick in visitation to numerous non-essential categories, perhaps unsurprisingly those that people have been missing most – retail, bars and gyms.
We’ll be monitoring foot traffic patterns closely over the coming weeks, so check back for more. For updates on nationwide and regional trends shared in past weeks, please visit Foursquare on the Amazon Data Exchange.
What Are The Latest Trends?
- Shopping for the home – Home and furniture stores have seen an uptick in foot traffic across all regions in the past week, especially in the Midwest – down only 10% as of June 12 (vs. down 20% last week).
- Heading back to the bars – Foot traffic to bars has continued to pick up more notably since Memorial Day weekend, with a 6-8% uptick across all regions in the past week.
- Hitting the gym – Foot traffic to gyms and fitness centers is starting to pick up again, especially in the South – down only 36% as of June 12.
A Closer Look At Retail Recovery
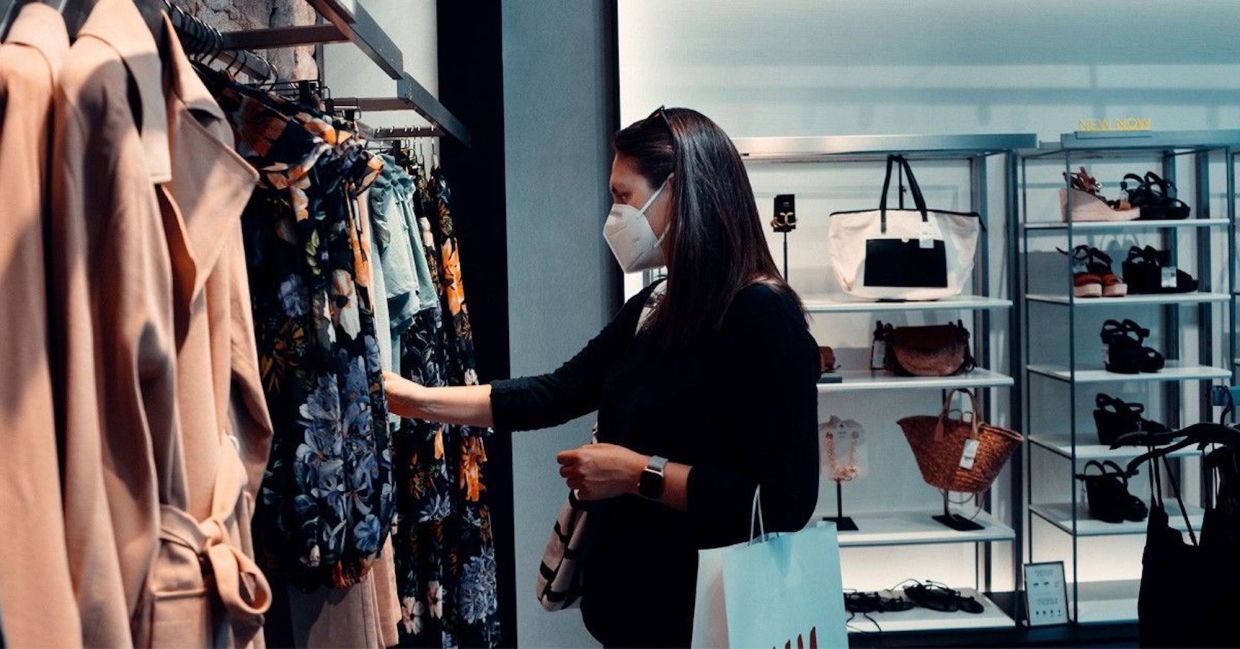
When it comes to retail, some specialty stores are recovering more quickly than others. Outdoor supply stores and sporting goods stores are actually seeing upticks in visits, coinciding with upticks to hiking trails and other outdoor activities. Office supply stores have also seen smaller relative declines in foot traffic, with visits down only -12% as of June 12, perhaps because consumers need supplies to work remotely and homeschool children. Visits to shoe stores are on the rise as well, down only 16% as of June 12. As mentioned above, home and furniture store traffic is also picking back up, now down only 10%.
Meanwhile, toy stores and kids stores have seen some of the largest relative declines in foot traffic during the height of the pandemic, and have been slower to recover. Visits to toy stores are still down 41% and kids stores are down 29% as of June 12. This may indicate consumers are happy to shop for their children online, rather than in brick and mortar stores. Clothing stores are still down 31% nationally, despite upticks in certain regions. Traffic to cosmetics stores and electronics stores also remains low, down 27% and 29% respectively as of June 12.
Digging Deeper Into Dining
We’ve also taken a closer look at fast food restaurants to better understand the trajectory of recovery. While QSR visitation on the whole is back to roughly pre-pandemic levels, location data indicates that recovery has actually varied widely by daypart. Foot traffic to fast food restaurants is slightly up around lunchtime and in the late afternoon. However, visits are still down significantly for breakfast, with consumers no longer visiting along their morning commute, as well as in late night hours, with fewer consumers grabbing a bite on their way home from nightlife spots.
Casual dining restaurants have seen similar daypart trends. Foot traffic is on the rise most in the late afternoon (now down only 52%), while restaurant visits are still down ~70% during late night hours. Based on these findings, happy hour promotions and afternoon snack menus may be key to restaurant recovery.
What Else Does The Data Show?
Here are some of our most recent topline findings by category:
- Alcohol: Liquor store traffic remains above pre-COVID-19 levels, up 15% as of June 12. Traffic to bars has continued to pick up since mid-April, with a notable uptick across regions since Memorial Day weeked (visits were down 21% nationally as of June 12, versus -27% the week prior). Bar visits are picking up particularly in the Midwest (down only 8% as of June 12).
- Auto Repairs: Visits to auto parts & services have continued to pick up this past week, up 5% nationally as of June 12 (and up 13% in the Midwest).
- Auto Dealerships: Visits to auto dealerships have increased significantly in the past few weeks – returning to pre-COVID levels nationally as of June 12 (versus down -2% in the week prior).
- Beauty & Self-Care: Visits to nail salons and barbershops/salons continue to pick up, but are still down 13-16% nationally from the week ending February 19 to the week ending June 12. Salon visits have picked up most in the Midwest this past week, down only 9% as of June 12.
- Casual Dining: Visits to casual dining chains have continued to increase in recent weeks, down only 42% nationally as of June 12 (versus 47-52% in the weeks prior). According to a survey of consumers in our always-on panel, 45% of casual dining visits are dine-in rather than takeout, (whereas 98% of casual dining visits were takeout in April and May 2020).
- Fast Food: Visits to fast food restaurants have fluctuated slightly in the past week, down 1% nationally as of June 12, but up 4% in the Midwest. Fast food fans are brand loyal– according to a survey of consumers in our always-on panel, 76% of QSR visitors plan to visit again within the next month.
- Entertainment: Visits to movie theaters have remained stable since April 1, down 63% nationally as of the week ending June 12. Theater visits are not likely to pick up again in the near future, as only 4-6% of consumers plan to visit a movie theater within the next month, according to a survey of consumers in our always-on panel.
- Fitness: Foot traffic to gyms has remained consistently low since around April 1, picking up more notably in recent weeks, especially in the South – down 36% as of the week ending June 12.
- Gas: Gas station visits continued to increase since mid-April, surpassing pre-COVID levels nationally as of June 12, and up 11% in the Midwest. According to a survey of consumers in our always-on panel, 57% of gas station visitors are shopping in convenience stores (not just filling up on gas).
- Hardware: While foot traffic to hardware stores is up significantly regardless of seasonality, visits have started to slow down across regions in recent weeks – up 54% nationally from the week ending February 19 to the week ending June 12 (vs. up 63% last week).
- Pets: Foot traffic to pet stores has continued to pick up since mid-April, down only 1% nationally as of June 12 (versus 2-8% in the weeks prior).
- Retail: Visits to clothing stores and shopping malls have continued to pick up since mid-April, down only 32-38% as of June 12 (versus 40-46% in the weeks prior), while visits to home/furniture stores are down only 17%.
- Shopper: Foot traffic to essential businesses where consumers buy food, drinks and household supplies foot traffic has been roughly normal since early April. However, we’re now seeing small declines in foot traffic to grocery stores (down 5%), as well as warehouse, big box, discount, drug/pharmacy stores (down 5-10% nationally as of June 12), perhaps because consumers are dining out rather than cooking at home, and shopping at specialty stores as they reopen.
- Telecommunications: Visits to wireless carrier stores have increased slightly since mid-April, down only 17% nationally as of June 12 (vs. -16% in the week prior).
- Travel: Consumers are still avoiding airports with visits down 68% nationally as of June 12, while hotel visits are continuing to pick up, down only 37%. Hotel visits are down significantly less in the Midwest (down only 18%).
- Financial Services: Foot traffic to banks continues to fluctuate week over week, somewhat in line with paydays. Visits were down 5% nationally as of June 12 (versus up 4% the week prior).
What’s Next?
According to the Foursquare Recovery Index, we’re seeing upticks in foot traffic to non-essential places week over week in many states, including Nevada, Florida, New York and Massachusetts. As businesses and places all over the country continue to open up, it remains to be seen what impact visitation will have on the overall health of the community.
[Legal]
Editor’s Note: Foursquare analyzes foot traffic patterns from more than 13 million Americans that make up our always-on panel. All data is either anonymized, pseudonymized or aggregated, and is normalized against U.S. Census data to remove age, gender and geographical bias. We’ve analyzed indexed foot traffic to various locations, using rolling 7 day averages to account for fluctuations in foot traffic by day of the week. Visits are projected based on user profile representation relative to census. These projection factors are updating regularly. These updates may cause slight shifts in indexed foot traffic week-to-week.


