Foursquare supplements market research based on movement data with location-based surveys to yield even deeper insights. Recent survey data reveals that 39% of respondents are back to the office 5 days per week, another 32% are working fully remotely, while 29% are visiting the office between 1-4 days per week and working remotely the rest.
And though 32% of employees are working fully remotely, only 11% of respondents report having relocated within the past two years – perhaps due to the ever-changing policies around remote work, or pay cuts for those who chose to relocate to a place without an office.
Location data can help us better understand where people are returning to offices regularly vs. where people are working remotely. These learnings can provide valuable insights for businesses, both in terms of decisions around their own employees (e.g. determining where to operate office locations) and in terms of how office culture impacts nearby patronage (e.g. determining whether to close a restaurant in a central business district due to declining foot traffic). From site selection and expansion strategies, to inventory planning, etc., these insights can help:
- Identify opportunities to open up new venues in a city that is seeing consistent office visitation throughout the week.
- Supply and demand planning or staffing based on foot traffic throughout the work week.
- Personalize marketing initiatives and/or content based on observed behavioral patterns by market.
Local Nuances
Location data shows just how important it is to make decisions with a deep understanding of local nuances, rather than based on national trends. For example, fewer than 18% of people in both Austin and Denver made one or more office visits this past year, while roughly 40% of people in Columbus (OH) and Los Angeles visited an office at least once. This data suggests that cities like Denver and Austin are likely bigger hubs for remote professionals, while a larger percentage of the professional population in places like Columbus, Los Angeles, San Antonio and Philadelphia have been visiting offices more often in recent months. To further support this theory, a report from Economic Innovation Group shows that San Francisco, Washington D.C., Austin and Denver all rank in the top eight cities with the highest share of remote professionals today.
Layering in this type of data with an understanding of existing venues per capita can help businesses assess the competitive landscape across different U.S. markets. For instance, San Antonio ranks toward the bottom of our list, with relatively fewer places of interest per capita compared to other major U.S. cities, including Denver and Austin. And as discovered in our analysis above, a relatively higher percentage of San Antonio’s professional population is visiting offices more often than in Denver and Austin. These are important learnings for businesses to consider when it comes to evaluating new opportunities for venue expansion (i.e. understanding the competitive landscape, opening venues in corporate vs. residential neighborhoods).
Visitation Trends
Location data serves as a valuable tool for businesses to prove or disprove and contextualize business performance, especially when it comes to use of office space.
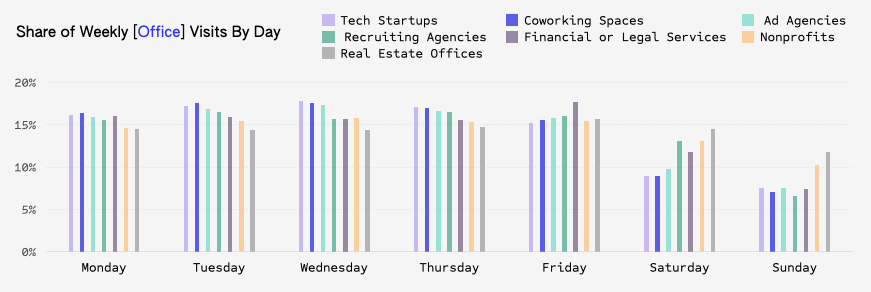
In our recent analysis, we set out to better understand how varying levels of office visitation have been impacting nearby businesses across major U.S. cities. Nationally, 58% of weekly office visitation occurs mid-week, Tuesday through Thursday. Fewer employees are starting or ending their work week in the office, as Monday and Friday combined account for less than 1/3 of weekly office visits (31%) in the U.S.
We found that tech startups, coworking spaces (such as WeWork) and advertising agencies tend to see a relatively higher share of weekly traffic occur mid-week, similar to the national trend, while financial and legal services, nonprofits and real estate companies tend to see weekly visitation more evenly distributed throughout the week. In other words, tech and advertising professionals are more likely to visit offices on select weekdays (hybrid), while finance and real estate professionals are more likely to visit offices consistently Monday through Friday, and often during the weekend.
Impacts to Patronage
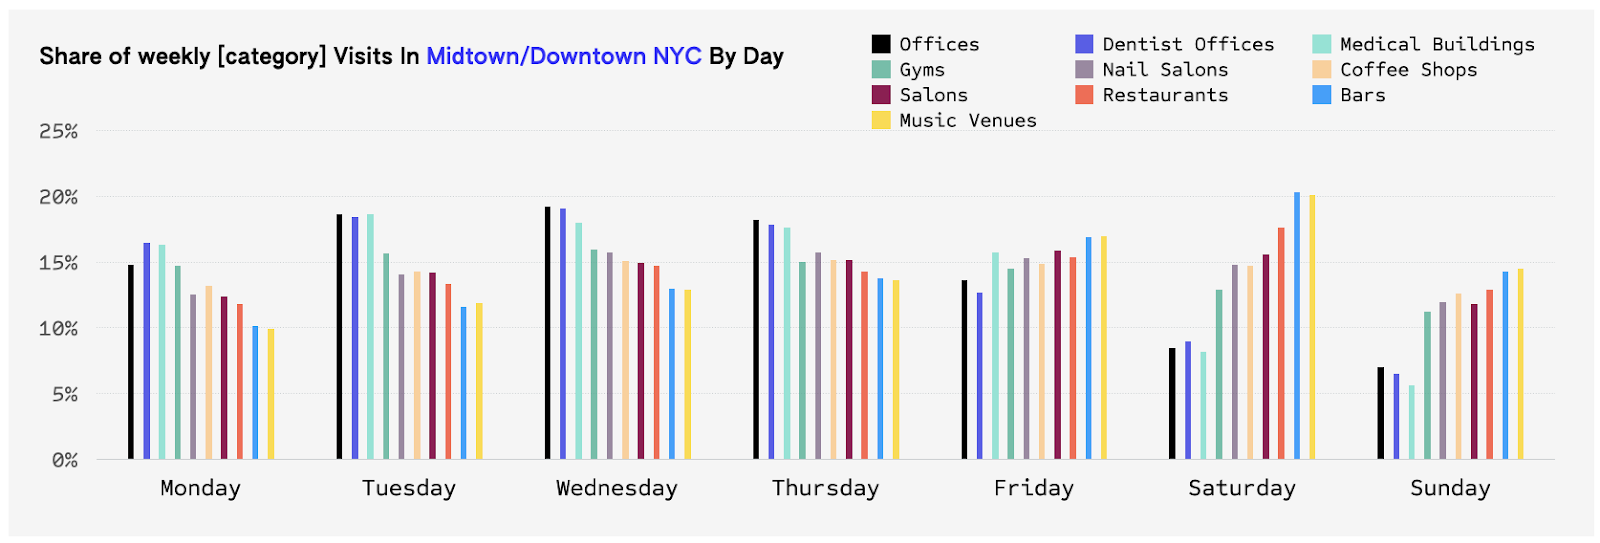
Many food and beverage brands are wondering how their business is being impacted by return to office trends (or lack thereof). Let’s take a look at midtown and downtown Manhattan. In comparing weekly office visitation side by side with weekly traffic to nearby dining and nightlife venues, medical buildings, gyms and salons, we noticed some fascinating trends emerge.
On a national level, our data reveals that 12% of office visitors are also visiting a nearby medical building within the same day, and 13% of office visitors are visiting a nearby gym or fitness studio before or after visiting an office. We suspect that these percentages might be even higher in downtown/midtown Manhattan, where gyms and medical buildings are seeing the highest weekly share of traffic on the same day as corporate offices in this area: Wednesday. Thus, our data suggests that office employees are likely to schedule medical appointments and fitness classes for days they plan to visit the office.
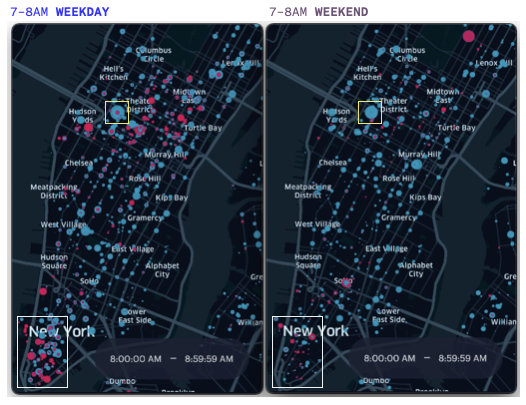
By leveraging Foursquare Studio, we were able to further compare gym visitation in Manhattan in the morning and evening hours of an average weekday vs. an average weekend. On weekdays, office visitors (pink) are largely contributing to gym traffic in FiDi, midtown and other prominent corporate neighborhoods, suggesting that gyms and fitness studios should consider opening locations within close proximity of office buildings in these areas to capitalize on this trend. Regardless of where people are working in Manhattan (from home or offices), New Yorkers are indeed more likely to visit gyms on weekdays vs. weekends.
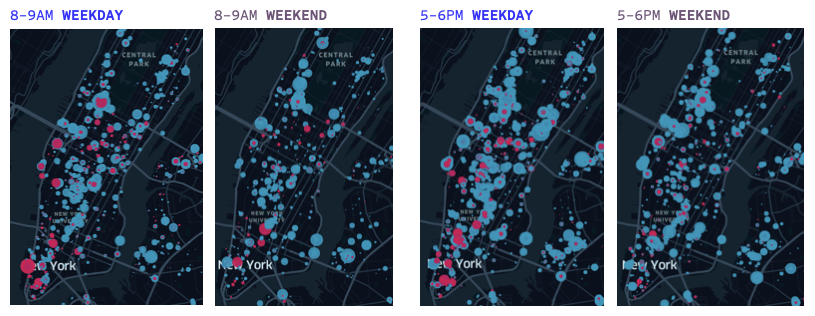
[the maps above depict foot traffic volume to gyms in Manhattan between 8-9AM & 5-6PM on an average weekday vs. an average weekend day in 2022, where pink = gym traffic from people who visited an office in the same day and blue = gym traffic from people who did not visit an office in the same day]
Again, using Foursquare Studio, we were able to look into Manhattan coffee shop trends by neighborhood. In the map below, FiDi coffee shops are likely to see more traffic on weekdays vs. weekends, especially from same-day office visitors (pink). However, in midtown, a particular Starbucks sees a similar volume of traffic between 7-8 a.m. on the average weekday and weekend. Furthermore, customers who came from or continued on to their office only accounted for a tiny portion of foot traffic volume for this location, regardless of the day. This data suggests that coffee shop patronage varies noticeably by neighborhood and time of day, and is not necessarily dependent on visitors also going to an office.
[the maps above depict foot traffic volume to coffee shops in Manhattan between 7-8AM on an average weekday vs. an average weekend day in 2022, where pink = coffee shop traffic from people who visited an office in the same day and blue = coffee shop traffic from people who did not visit an office in the same day]
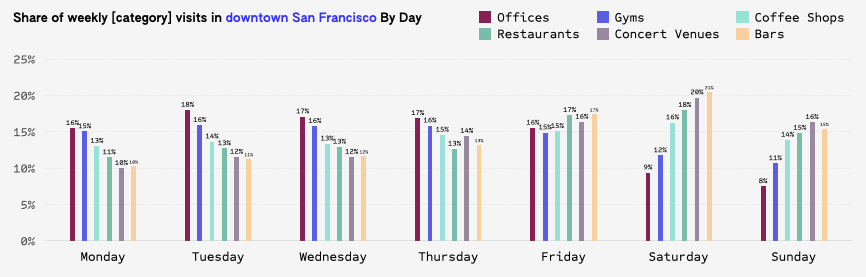
In downtown San Francisco, gyms and fitness studios are typically busiest on the same weekdays as offices in this area. Tuesday through Thursday account for 52% of weekly office visits, and 48% of weekly gym traffic in downtown San Francisco. Gyms in this area see less than 1/4 of weekly visits on weekends. And while downtown offices may see the most traffic mid-week, bars, restaurants and concert venues still attract customers to this area on weekends (Saturday and Sunday account for 33-36% of weekly traffic for each) in this area. This data suggests that gyms in downtown SF are heavily dependent on weekday office employees, while dining and nightlife venues in this area are not. Coffee shop visitation in downtown SF remains fairly consistent throughout the entire week, with each weekday accounting for somewhere between 13-16% of total weekly traffic.
Inevitably, more Americans will head back to the office this year, making it even more essential for all businesses to understand the competitive landscape and keep a pulse on changes in consumers’ daily routines, commuting preferences and consumption patterns.
Today, nearly 70% of employed professionals are visiting offices at least once per week, according to Foursquare survey data. But when it comes to office visitation, not all markets are the same. In order to succeed, businesses should lean into key learnings gleaned from our foot traffic data, like where today’s top hubs are for remote professionals, office visitation by day of week or cross-visitation patterns between offices and other nearby businesses.
In conclusion, this analysis emphasizes the role of location data in uncovering trends in consumer behavior, assessing the competitive landscape and unlocking unique opportunities for venue expansion. Ready to learn more? Check out the full report, in which we also explore related topics such as the impact of inflation on commuting, return to office incentives and more!


