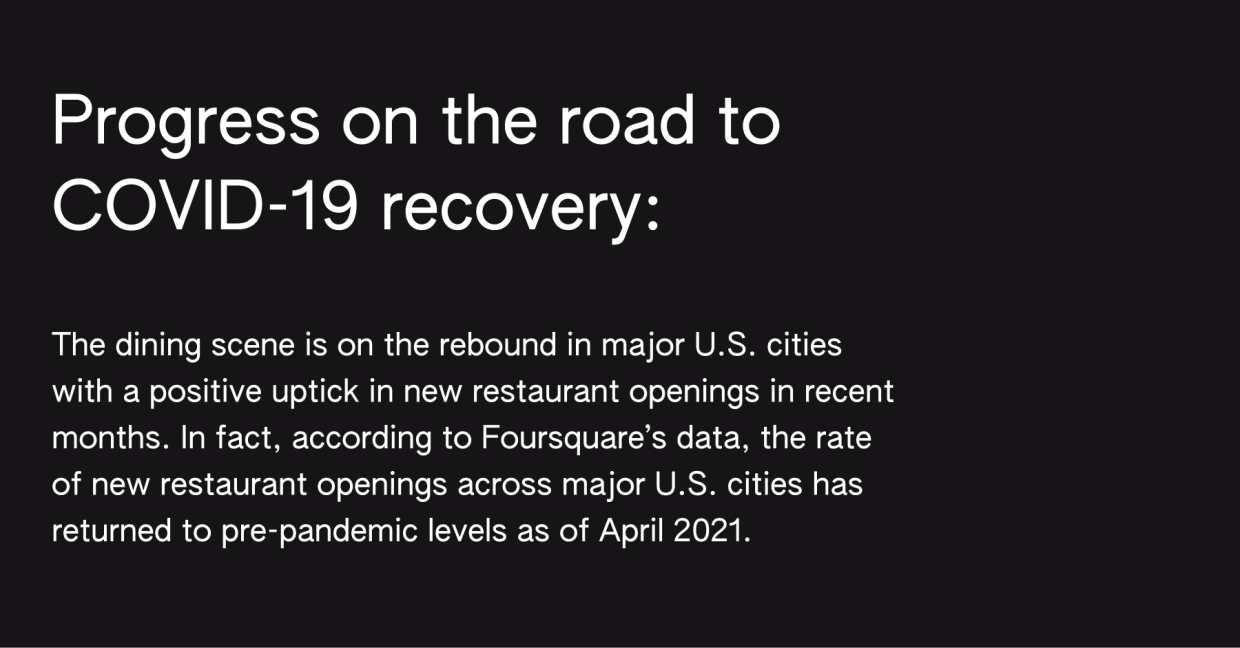
Take a walk down any street in New York City, and it’s easy to see that restaurants were hit hard by the pandemic. But while many operations boarded up for good, hundreds of new restaurants opened up amidst times of great uncertainty – proving that the dining industry is resilient and making a healthy rebound.
What’s more, by taking a closer look at the restaurant opening trends over the course of 12 months using location data, you can better understand which cities were hit hardest, which fared the best, and when the hint of rebounds began.
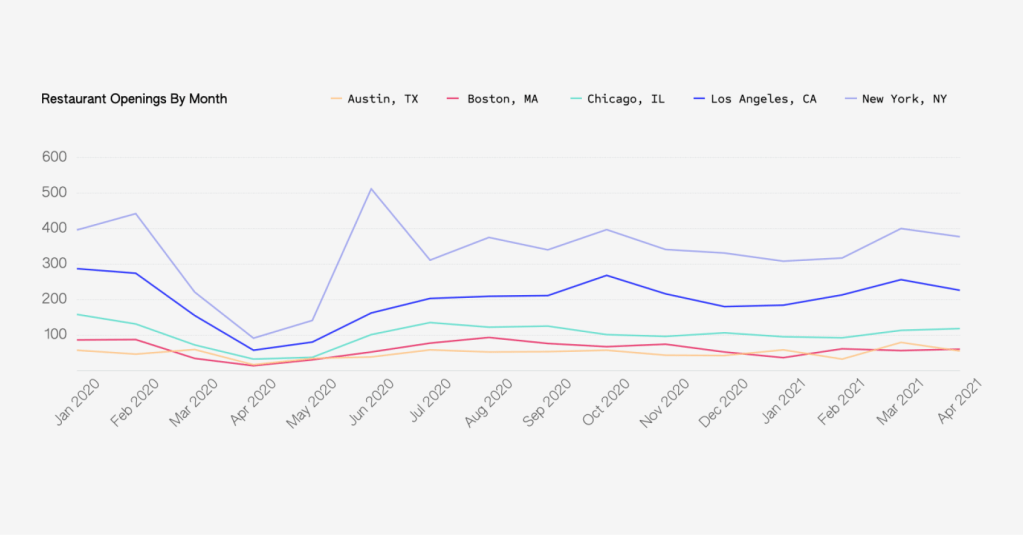
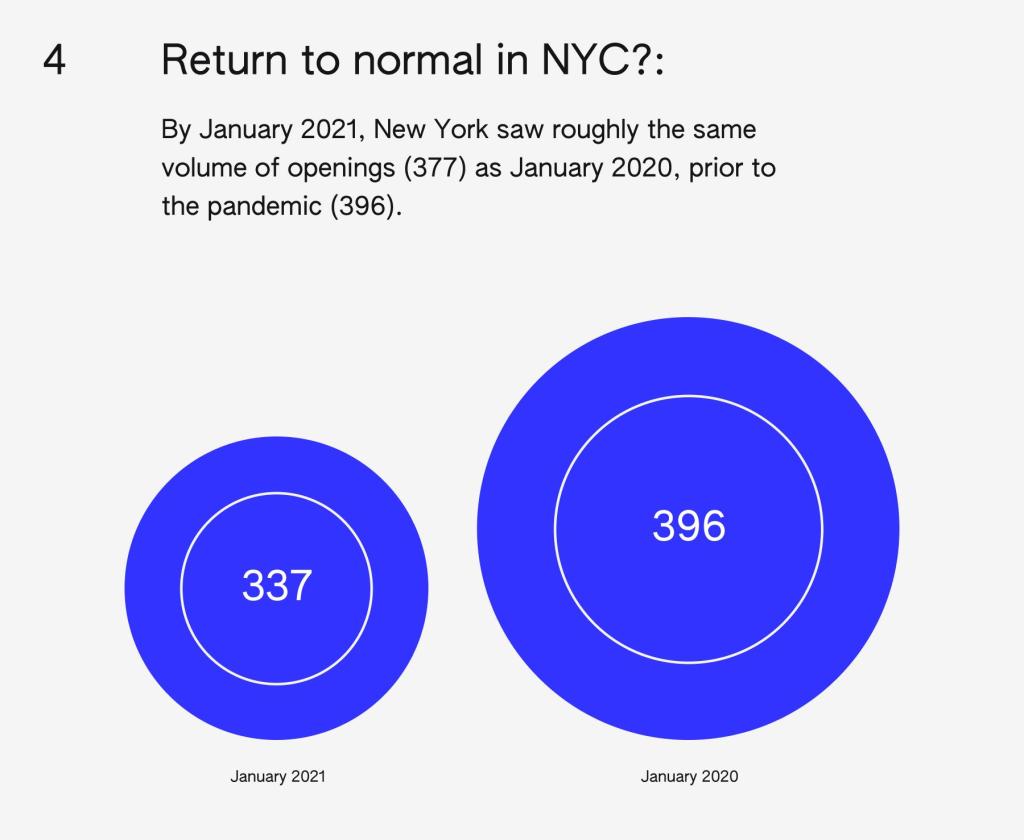
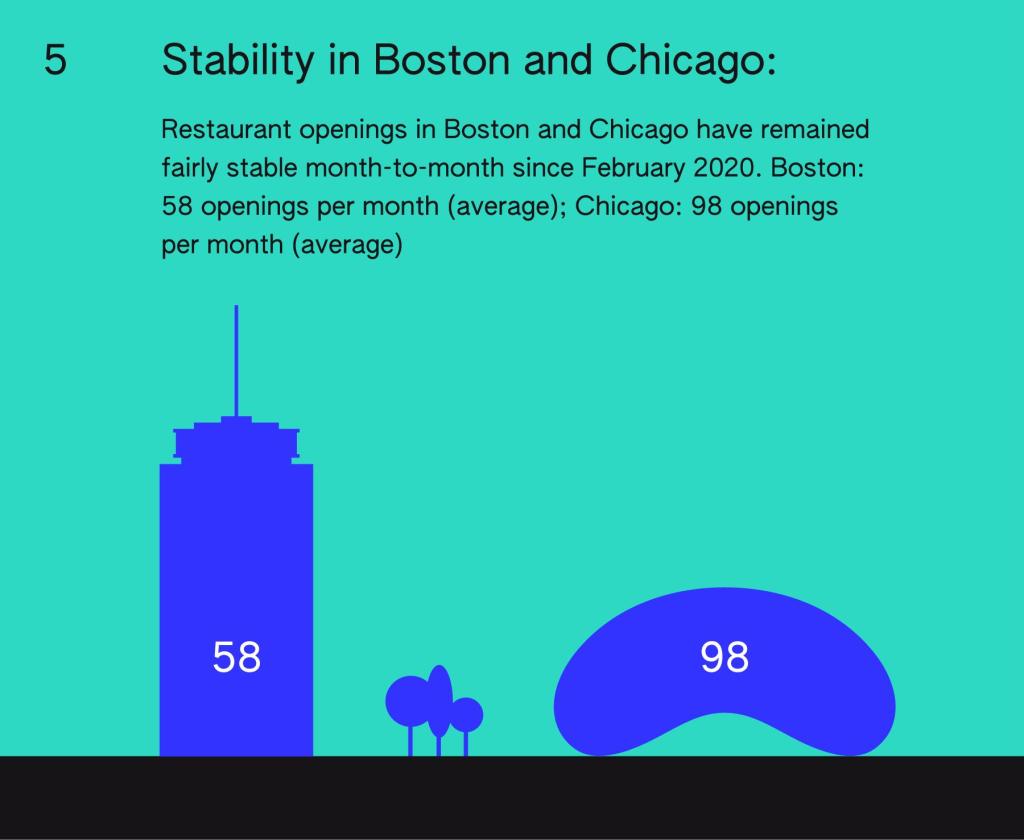
Check out the infographic below to see restaurant-opening trends in NYC, Boston, Los Angeles, Chicago, and Austin between March 2020 and April 2021.