At Foursquare, our data scientists are often called upon to analyze real world trends; we use Big Data to determine how commercial fortunes are rising or falling. This year, politics and business are intersecting, as one of the presidential candidates, Donald Trump, has extensive properties including casinos, hotels, and golf courses. Has his campaign been good for Trump-branded business?
We have experience tackling these types of questions with a high degree of accuracy. Based on our foot traffic intelligence covering over 50 million users a month, we predicted Apple iPhone 6s sales, a hit Q4 for McDonald’s all-day breakfast, and a tough Q1 for Chipotle. Time and again, our predictions have been proven on-target once these companies announced their earnings.
Reporters have lately been asking us if our foot traffic data can shed light on visits to Trump properties, so we decided to take a closer look. To be clear, as a technology company, we’re not in the game of taking a stance on political questions. But we are interested in the power of data to illuminate cultural trends. So let’s look at the numbers.
Have The Donald’s politics trumped Trump businesses?
It turns out the data is fairly clear: Since Donald Trump announced his candidacy in June 2015, foot traffic to Trump-branded hotels, casinos and golf courses in the U.S. has been down. Since spring, it’s fallen more. In July, Trump properties’ share of visits fell 14% year over year, for instance.
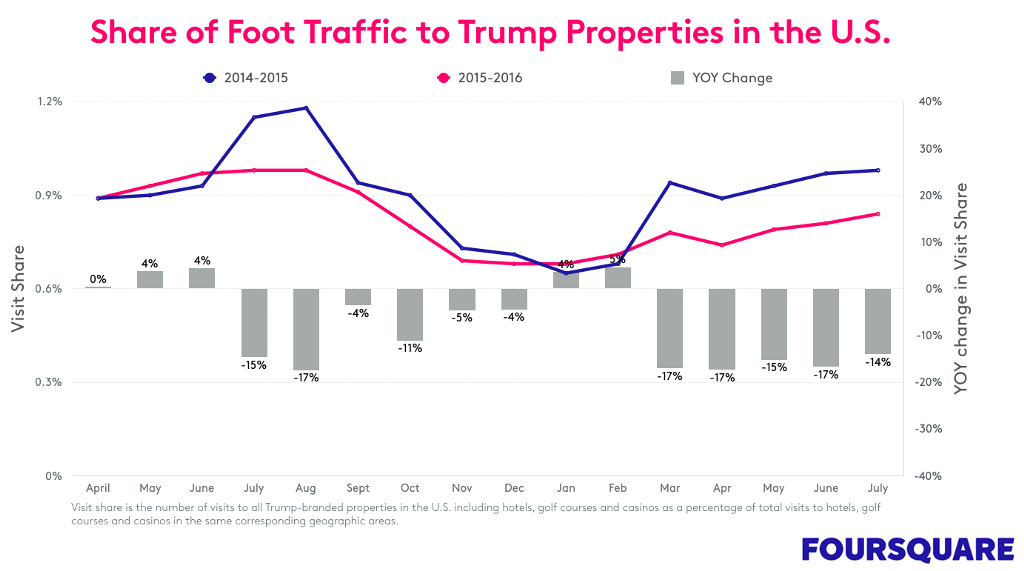
There has been an interesting arc over the last year. Before Trump announced his presidential bid, foot traffic to his properties was steady year-over-year — and maybe even saw a small uptick. After he entered the race, his branded properties failed to get their usual summertime traffic gains. In August 2015, the share of people coming to all Trump-branded properties was down 17% from the year before.
These losses stabilized to single digits for a number of months, but as Primary voting season hit full swing in March 2016, share losses grew again. Trump properties did not get their usual springtime bounce of travelers and locals. March share was down 17% once more.
The properties that were hardest hit were the Trump SoHo, Trump International Hotel & Tower Chicago and Trump Taj Mahal, down 17–24% in raw foot traffic this past year as compared to the previous year. Incidentally, Trump Taj Mahal just yesterday announced that it will be closing its doors after Labor Day, citing an ongoing employee strike as the reason; our foot traffic report shows the problems ran deeper.
We also decided to look at how foot traffic might differ between “blue state” and “red state” locations. Trump properties include a number of award-winning hotels (particularly Trump International Hotel & Tower Chicago). However, his hotels, casinos, and golf courses are mainly located in reliably “blue” Democratic states, and depend highly on guests and visitors who live in the region.
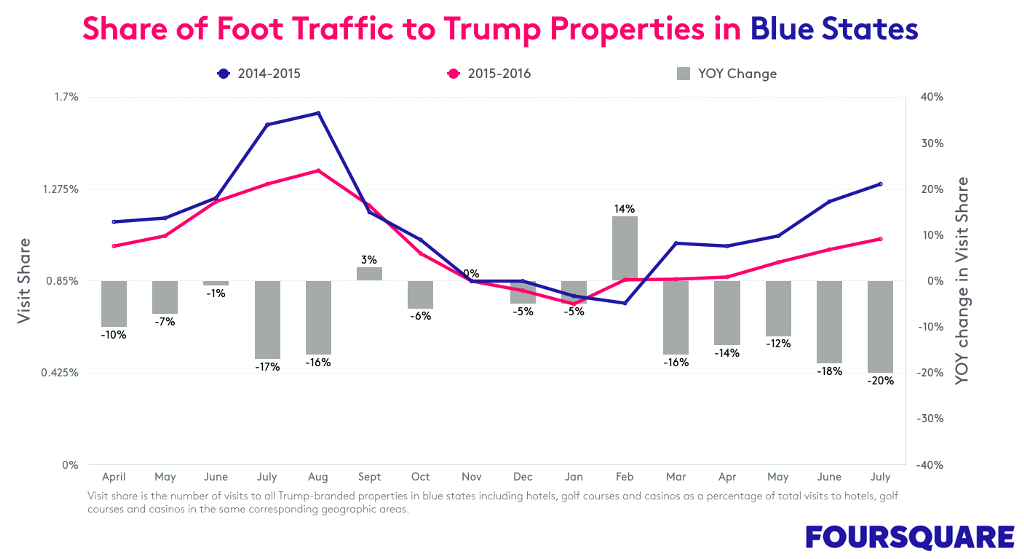
Breaking out Blue States, the loss in foot traffic runs deeper than the national average. For the past five months, Trump’s blue state properties — spread between New York, New Jersey, Illinois, and Hawaii — have taken a real dip, with diminishing visits starting in March and a widening gap that continues straight through July, when share fell 20% versus July 2015.
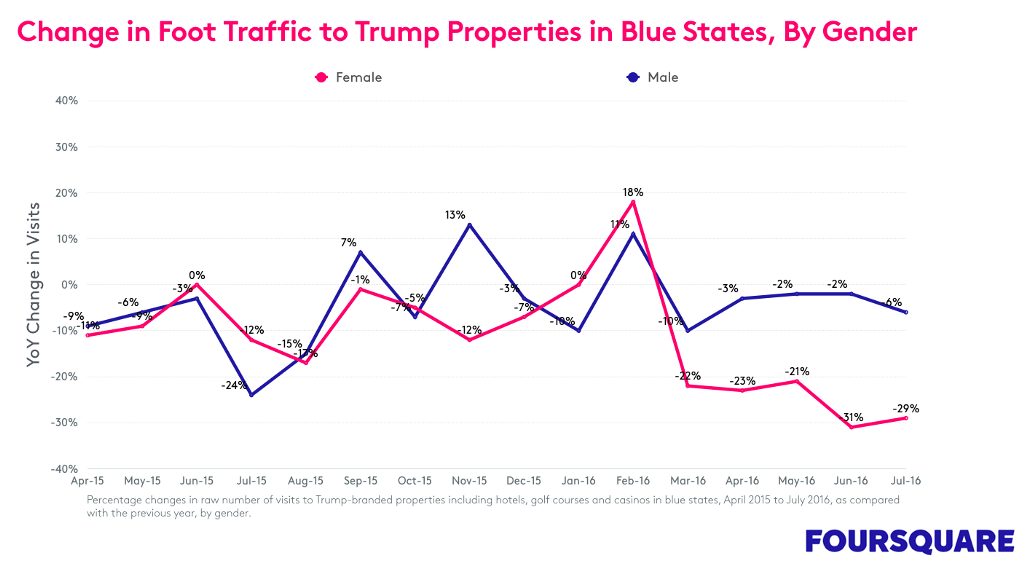
When we dissect this traffic further, we see that the market share losses have been driven by a fall-off among women. Trump properties have seen a double-digit decrease in visits from women this year, with a gap that widened starting in March 2016. (The one anomaly was February, for unclear reasons.) In July, visit share among women to Blue State properties was down 29%. This seems to reflect the gender division in the polls among American women.
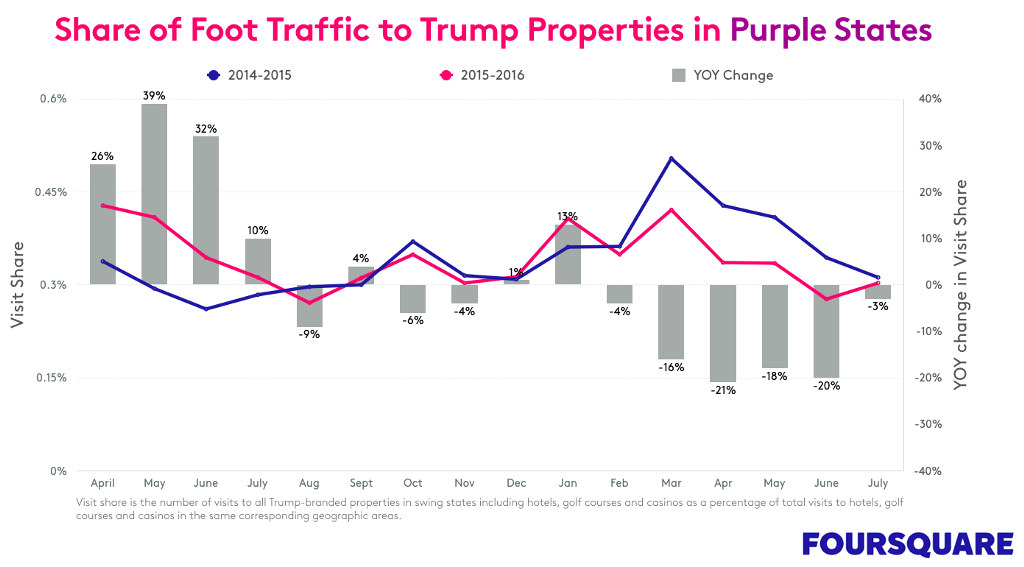
Foot traffic for Trump-branded properties in purple ‘swing states’ tells a different story. These states have fluctuated greatly over the campaign. They have seen share loss, but it’s more favorable territory for the Trump brand.
When Trump was battling for the nomination against his final competitors from March to May, fewer people were visiting Trump properties in Las Vegas and Miami. Sentiment pivoted once more around the Republican Convention in July. July’s bounce from -20% share in June to -3% in July in Purple State locations is notable.
We Leave It to the Pundits to Interpret All This
As a location intelligence company, helping both consumers and businesses make smarter decisions in the real world, our job is simply to report the data.
For fans of Trump, the business losses may simply reflect the cost of sticking by his campaign statements and beliefs. For critics of Trump, the fact that more people are staying away from Trump-branded properties may reflect people “voting with their feet.”
Additionally, many Trump-branded properties have different owners and have licensed the Trump brand, so the economic impact on Mr. Trump himself may be very small in such cases.
Regardless of how you feel about the election, we hope our data analysis encourages more people to pay close attention, and illuminates how technology is opening up new kinds of societal understanding based on mobile usage.
A Word About Methodology and Market Share
At Foursquare, we understand foot traffic trails from more than 50 million monthly global users of our consumer apps (Foursquare and Swarm) and our websites, which people use to explore the world and check in. These location-based apps help us to see — always anonymously and in the aggregate — trends and other notable shifts.
To analyze foot traffic patterns to the dozens of Trump-branded hotels, casinos and golf courses in this study, Foursquare looked at explicit check-ins as well as implicit visits from Foursquare and Swarm app users who enable background location and visit these locations in the U.S.
Like pollsters and data scientists have been doing for decades, we normalize our data against U.S. census data, ensuring that our panel of millions accurately matches the U.S. population to remove any age or gender bias (though urban geographies are slightly over-represented in our panel). Foursquare’s proprietary understanding of Place Shapes and our ability to detect when mobile phones enter or exit over 100 million businesses and places around the world is the foundation of Place Insights, our product for analysts and marketers.
In this analysis we looked at “market share,” measuring how visits to Trump properties changed over time relative to competitive properties in the same area. We do this so we can best understand shifts within the hotel, casino, and golf course markets. For example: Trump Soho’s visits are reviewed alongside visits to all hotels in the New York City DMA, so when there’s a seasonal dip, we’re not attributing it as a dip in absolute visits. We frequently look at market share in our Place Insights product for marketers, to understand how a company, such as a fast food chain or a hotel group, is winning or losing against its competitive set.
In our research, we also cross-checked our market share analysis against absolute visits, to ensure that the dip in foot traffic share was not due to a sudden increase in traffic to non-Trump venues for reasons unrelated to the Trump properties. In this view, again we see the same decrease in visits to Trump properties by about 10% overall this past year as compared to the previous year. So there’s a clear indicator that visits to Trump properties are, indeed, down.
Whether the loss in visits is coming from sightseers versus paying hotel guests is unclear. Traffic does not always equate with revenue. We do not claim to know the relationship between reduced walk-in visitors and reduced revenue to the properties, especially since these Trump properties do not publish their historical financials to establish correlations over time.
The next several months will be telling for so many reasons. Trump International Hotel opens in Washington, D.C. in September 2016, just before the presidential election follows in November, and the impact of Trump’s campaign on its opening success is yet to be seen.
If you’re interested in further analysis from Foursquare’s Place Insights, visit foursquare.com.


