
Since the COVID-19 pandemic began, we’ve been sharing how the virus is impacting foot traffic to a variety of places across the United States.
This week, we’re taking a closer look at Georgia, using the state as a case study to understand how consumers respond when businesses are allowed to reopen. Recovery will mean officials permit businesses to reopen, businesses themselves choose to reopen, and consumers choose to visit those businesses.
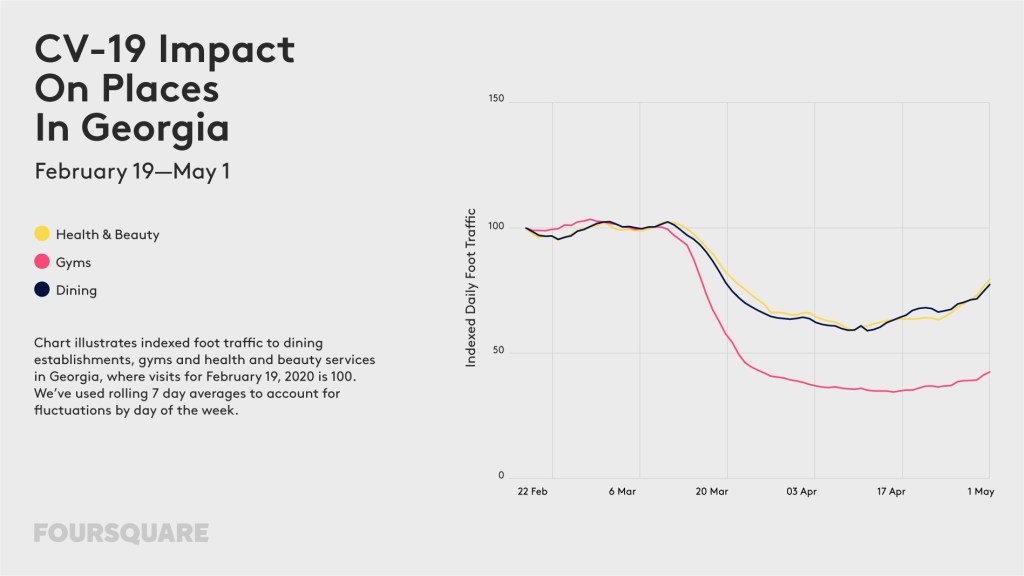
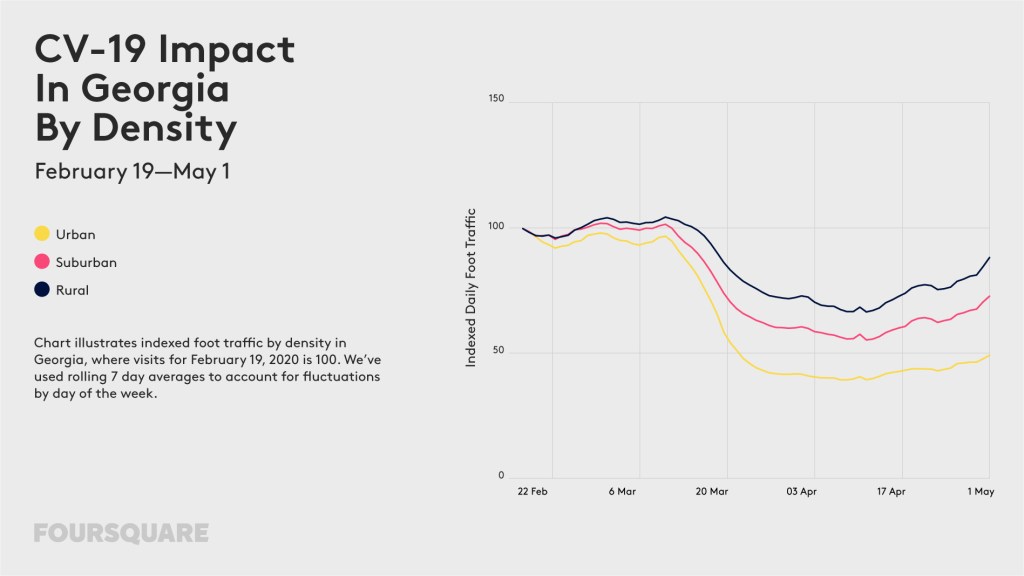
Georgia began reopening non-essential businesses on Friday, April 24. Since then, visits to health and beauty services, gyms as well as restaurants have seen significant upticks. Notably, restaurant visitation rose the most in rural and suburban areas. There was some increase in foot traffic to dining rooms in urban areas, but visitation didn’t jump nearly as drastically.
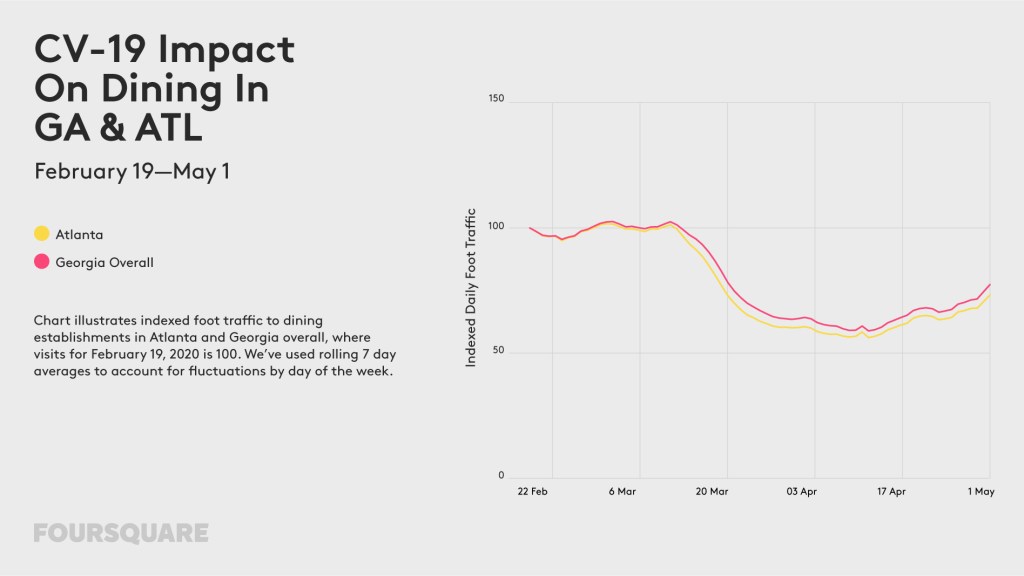
Though Georgia’s shelter-in-place order ended April 30, leaders of more populous cities like Atlanta are still advising residents to stay home. In all places analyzed, foot traffic in Atlanta remained lower compared to rural areas and the state overall.
What Comes Next?
As states plan their paths to reopening, will the patterns we’re seeing in Georgia be reflected nationwide?
This data could be seen as an indicator of what’s to come, though there will certainly be variance at the state, business and individual level. Expect visits to wellness and self-care places like hair salons and gyms to spike sooner than entertainment venues, and for restaurants to see more people dining-in once permitted to do so.
What remains to be seen is if and when these increases will level out, and what places will see upticks in visitation next. While places like movie theaters and bowling alleys were also permitted to re-open as of Monday, April 27, foot traffic to these places is still consistently low.
We’ll be monitoring foot traffic patterns closely over the coming weeks, so check back for more. For updates on nationwide and regional trends shared in past weeks, please visit Foursquare on the Amazon Data Exchange.
Digging Into The Data: Personal Care, Gyms and Dining
In the analysis below, we examine some of the places allowed to reopen in Georgia to determine how quickly visitation will return to “normal.” Unsurprisingly, visits to health and beauty services – hair salons, barber shops, nail salons, tattoo parlors, and spas – quickly jumped up to 80% of pre-pandemic levels, perhaps indicating that Georgians were long overdue for a haircut. Restaurants also returned to more than 75% of “normal levels” once dine-in service was allowed again. Gym visitation rose as well – though still below pre-pandemic levels, gym visits were down less than 60% in the week ending May 1, versus 65-75% declines in the weeks prior.
Taking A Closer Look At Dining
While many restaurants have remained open for pickup, drive through and delivery since the pandemic began, dine-in foot traffic is an excellent indicator of consumers’ comfort level in returning to their daily activities. Dine-in service was permitted in Georgia as of Monday, April 27, subject to specific social distancing and sanitation mandates.
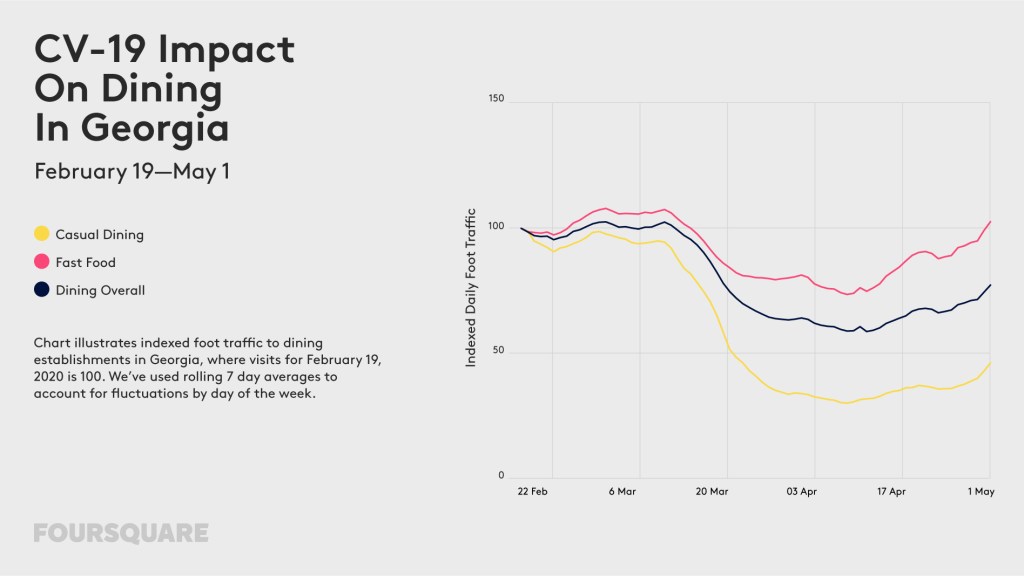
Restaurant visitation in Georgia did not immediately spike once restrictions were lifted, but our data showed significant upicks in traffic on April 30 and May 1, with visits reaching roughly pre-pandemic levels on Friday May 1. This may indicate that restaurants in Georgia did not choose to open immediately once allowed to do so, and instead may have taken a few days to prepare themselves for new protocols and procedures.
Analyzing specific types of restaurants, we see that fast food traffic in Georgia has returned to pre-pandemic levels, whereas casual dining restaurants that typically rely more on dine-in traffic are significantly lower.
Upticks in Georgia restaurants’ traffic have been largely driven by rural and suburban areas, with much smaller changes observed in densely populated zip codes. Restaurant visits in rural areas reached 88% of pre-pandemic levels, whereas restaurant visitation in urban areas of Georgia was still at 50% as of May 1.
While restaurants in Atlanta saw upticks in foot traffic once dine-in service was permitted starting April 24, traffic rose slightly less in the city versus the statewide trend.
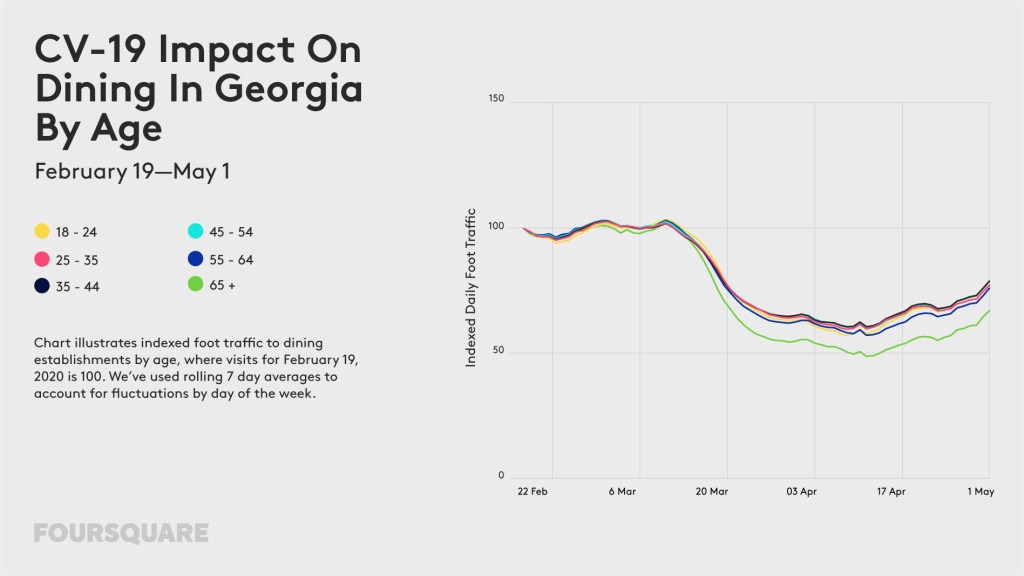
Older audiences over 65 years old have been much slower to start visiting restaurants in Georgia again compared to other age groups.
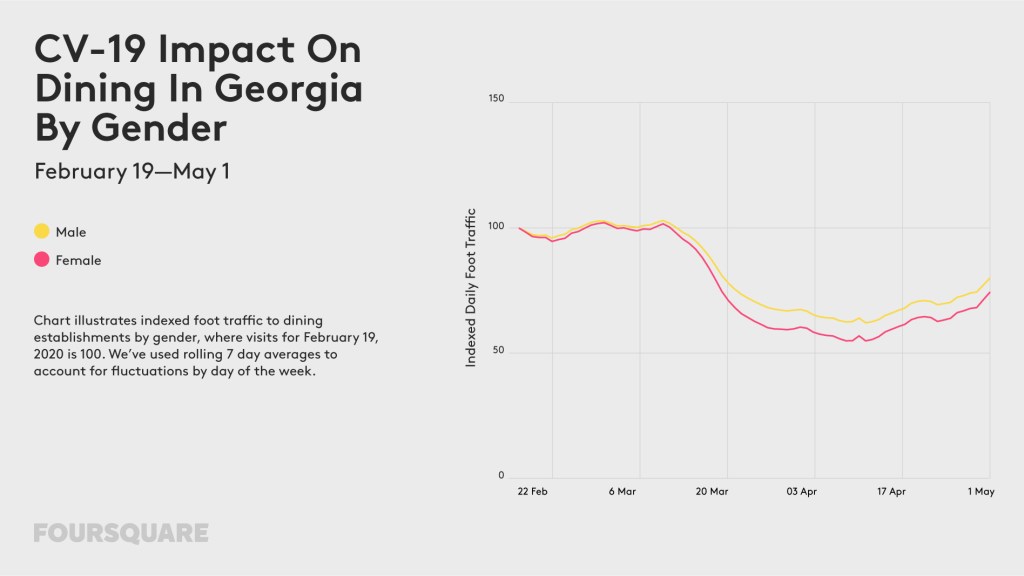
Men have been quicker to start visiting restaurants in Georgia again compared to women.
Our Methodology
We use indexed foot traffic to demonstrate the relative decline in visits to different types of places, where average daily visits in the benchmark period are 100. We analyze data on a rolling 7-day basis to reduce the effects of foot traffic trends influenced by certain days of the week (for example, bars and clubs experience an uptick on Fridays and Saturdays).
So, to explain this in an example, an 81 index to fast food restaurants for May 6 indicates that foot traffic on May 6 was 19% lower than the daily average for the first week analysis, February 13 – February 19.
We used February 13 – February 19 as the first 7-day period benchmark for analysis because February 19 is when we last estimated foot traffic to be roughly normal for the categories analyzed. You’ll see us reference this period as “the week ending February 19.”
In order to isolate behavioral changes on the exact dates when businesses reopened, we also analyzed trends this week using daily indexed foot traffic (without rolling 7-day sums).
Editor’s Note: Foursquare analyzes foot traffic patterns from more than 13 million Americans that make up our always-on panel. All data is either anonymized, pseudonymized or aggregated, and is normalized against U.S. Census data to remove age, gender and geographical bias.
The charts above illustrate indexed foot traffic to various locations. We’ve used rolling 7 day averages to account for fluctuations in foot traffic by day of the week. Visits are projected based on user profile representation relative to census. These projection factors are updating regularly. These updates may cause slight shifts in indexed foot traffic week-to-week.
Casual dining restaurants analyzed include casual dining chains in National Restaurant News’ Top 500 Chains.


