In our previous blog post, we explored how the modern data platform is an unbundled version of a traditional warehouse. While this unbundling enabled independent evolution of each of the component systems, it introduced significant complexity in managing the interactions between these components to get a coherent view of the entire system. A year ago, at Foursquare, we found ourselves teetering on the edge of disarray as a result of these decoupled systems. In this blog post, we will share the journey we started on to transform our data platform from a labyrinth of disconnected systems to an efficient streamlined machine. We will begin by describing the initial state of our data platform & the challenges we faced, outline our vision for an ideal developer experience, and walk through how we took a methodical approach that brought order to a once fragmented state of systems.
About Foursquare
Foursquare is a geospatial data and services company. We ingest data from various first-party and third-party sources, apply our own models & algorithms to build proprietary geospatial datasets and make them available for both the internal and external customers as various data products through different delivery channels. We process billions of records every day, including GPS pings, Place Inputs, and Ad Impressions. The internal customers consuming these datasets use them to build customer facing data products & applications. The geospatial nature of our data adds an extra layer of complexity, requiring specialized processing and storage solutions to handle location-based information efficiently at scale.
The Fragmentation: Challenges in our Data Platform
A year ago, when we started this journey, Foursquare had all the components of a modern data platform: an S3-based data lake, homegrown ingestion and delivery systems for data flow, multiple fragmented metastores (like Hive and Glue) cataloging various dataset subsets, diverse orchestration systems (such as Luigi and Airflow), and a selection of compute engines (including Databricks, EMR/Spark, and Athena) to support different access patterns. While we made incremental improvements to these component systems over the years, we lacked central visibility that made it difficult to answer questions such as:
- What are all the datasets we have within our data lake? And which ones are production vs staging?
- Who has access to each of those datasets – whether it is employee or system accounts?
- Are there multiple copies of the same dataset and if so, where do those copies exist?
- Which datasets does a specific customer facing data product depend on?
Business Implications
This lack of visibility manifested itself in ways that had serious business implications, beyond just basic auditability of the system:
- Increased costs due to untracked/redundant internal datasets: Our S3-based data lake relied on tedious, error-prone processes to distinguish production data from intermediate/test datasets. Adopting a conservative approach, we often retained unnecessary test datasets, leading to increased storage costs. Periodic cost-efficiency drives to delete unused datasets, while helpful, depended heavily on tribal knowledge across teams and took away resources from product development.
- Slower release cycles due to fragmented lineage tracking: We used multiple orchestration systems with fragmented lineage tracking for building our data pipelines. As a result, we did not have an easy way to stitch together the provenance of a dataset. This lack of visibility into the downstream dependencies slowed down our releases as we relied on manual processes and extensive communication with our internal stakeholders to identify dependencies for rolling out any major changes.
- Hindered innovation due to data invisibility: The challenges in dataset discovery significantly hindered innovation and led to inefficiencies across our data science teams. Data scientists often found themselves recreating existing datasets or avoiding potentially valuable features altogether, simply due to the difficulty in finding and accessing the right data.
- Hampered developer productivity due to complex permissioning system: Our diverse compute engines and low-level access controls based on S3 buckets and IAM roles created significant challenges for engineers. Difficulty in determining appropriate IAM roles for local versus production job execution led to frequent permission errors, difficulties in replicating production environments, and increased time spent on access management rather than feature development. This complexity also introduced potential compliance/security risks from the use of over-permissive roles as workarounds, which in turn had to be addressed by other custom tooling.
Like most companies our size, we relied on a combination of tribal knowledge, custom tooling and heroic engineering efforts to overcome the shortcomings of our data platform.
To Control: Envisioning the Ideal Developer Journey
As our data platform’s challenges grew beyond quick fixes and workarounds, we realized it was time for a fundamental shift. We asked ourselves: “What would an ideal developer experience look like in a truly modern, efficient data platform?” This question guided our redesign efforts. We envisioned a seamless, user-friendly ecosystem where developers could easily interact with our data platform at every stage – from ingestion to governance and compliance. Our goal was to transform our fragmented data landscape into a cohesive, efficient system that would maximize the utility of our data assets.
To bring this vision to life, we mapped out a comprehensive developer journey that addressed each critical touchpoint in the data lifecycle. We will now examine the key elements of this ideal developer journey:

1. Data Ingestion: The journey begins with the ingestion of data into the data lake. As data is ingested from various sources, the platform automatically creates entries in the central data catalog. These entries include essential metadata such as the data’s schema, source, ingestion timestamp, and storage location. This automated process ensures that newly ingested data is immediately discoverable.

2. Data Discovery: Developers explore the self-service data catalog, which includes the newly ingested datasets. This centralized repository provides a comprehensive view of all data assets, organized into logical domains. Rich metadata, including tags and structured properties, enhances discoverability and understanding of datasets.

3. Data Access: Upon identifying relevant datasets, developers request access through a unified permission management system. This high-level interface abstracts away the complexity of traditional, low-level IAM controls. This system manages permissions across various compute environments, ensuring consistent and secure access to various datasets.

4. Data Exploration: With granted access, developers can explore datasets using their preferred compute environment. The platform supports multiple compute options, allowing developers to choose the most suitable tool for their task, whether it’s SQL-based analysis, machine learning, or complex data processing.

5. Data Processing: Developers create and manage data pipelines to process and transform data. These pipelines are tracked in the control plane, providing clear visibility into data lineage, dependencies, and the overall data flow across the organization.

6. Data Provenance: As developers work with and transform data, the platform automatically tracks and records the complete lineage of each dataset. This includes capturing information about the origin of the data and the sequence of processes that led to its current state. Developers can easily access this provenance information, allowing them to understand the full context and journey of the data they’re working with.

7. Data Monitoring: Developers have access to the key metrics associated with datasets such as freshness, volume and specific quality metrics at a glance. Furthermore, they are able to look at how these metrics changed over time.

8. Data Sharing: Developers are able to distinguish between datasets internal to specific product/team versus ones that are intended to be shared for consumption by other teams. An additional requirement is to explicitly track datasets that are shared with external customers.

9. Governance and Compliance: Admin users of the platform are able to perform audits on permissions from time-to-time. They are also able to identify datasets that need to adhere to compliance policies based on the type of data they are carrying.
Implementing the Vision: Foursquare’s Data Platform Control Plane
To fulfill all the aspects of the developer journey outlined above, we realized we first needed to invest in a control plane for our data platform that brought together three distinct facets: a) a data catalog that served as a source of truth for all the datasets in the data lake, b) a data lineage tracking mechanism that allowed us to understand the relationships between various datasets and c) a federated permission management system that encapsulated the compute engine specific lower level controls with a higher order access control system.
Most big data platforms like Amazon, Snowflake and Databricks bundle these aspects to create a coherent user experience within their platforms. But being in the geospatial domain, we often need to work with specialized compute engines and interoperability with such bespoke systems is not always straightforward. For instance, you cannot benefit from getting an end-to-end lineage of your datasets, if you also use compute systems outside of these platforms for generating some intermediate datasets in that lineage.
After evaluating several options including Databricks Unity Catalog and AWS’ Amazon DataZone, we chose DataHub as the control plane for our data platform and partnered with Acryl Data, which offers DataHub Cloud, a premium hosted version of DataHub. There were two primary reasons why we could not pursue the other options. At the time of our evaluation, a) some of the constraints in those platforms made working with compute systems not native to their platform difficult and b) some of the features such as lineage tracking, were not available at the point we started our integration. Another important thing that worked in DataHub’s favor is the rich and flexible taxonomy it offered for modeling the various aspects of a data platform.
Implementation Considerations
With DataHub selected as our control plane solution, we moved into the implementation phase. This transition brought two critical challenges to the forefront: First, how should we organize the metadata corresponding to the vast amount of datasets in our control plane to ensure clarity and usability? Second, how could we ensure that this metadata remains consistently accurate and up-to-date? We will now examine how we approached these crucial aspects of our implementation.
Metadata Organization
Organizing the assets in the data platform in an opinionated and structured way is one of the important decisions we had to make. This is also the reason why meta stores like Hive are not sufficient to implement a control plane as the users will be lost in a vast pool of tables without the ability to identify the key datasets.
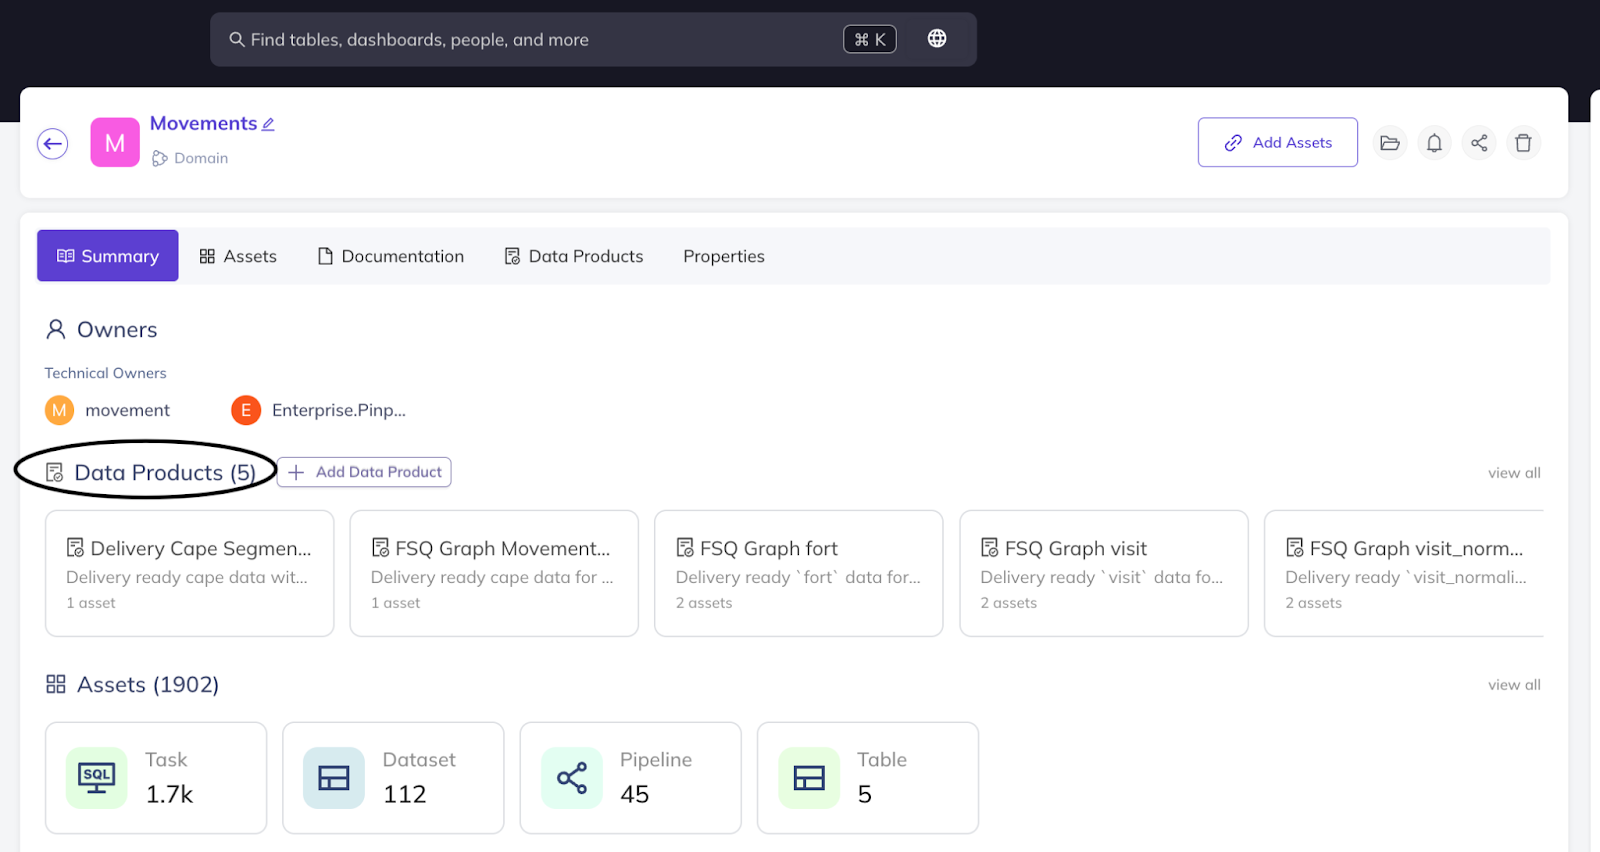
Here’s the taxonomy we aligned on: A Dataset is a foundational building block of our data platform. A Dataset is a collection of records adhering to a specific schema stored at a specific location within our data lake. A Dataset can have one or more clones associated with it. Clones are exact copies of a Dataset with the same schema and records but stored in different locations. For example, we might clone our S3 Places Dataset in Redshift for faster querying. Clones allow us to track the different manifestations of the same dataset. These Datasets and their clones are organized into Domains, which are logical groupings often aligned with our product lines. Our Movements Domain, for example, houses our visits datasets. Some of these datasets are blessed for consumption by other domains, and are referred to as Data Products. A Data Product is specifically a collection containing the specific dataset blessed for consumption and all of its clones. Every Dataset has an associated Pipeline (a series of data processing tasks) through which it gets generated. This pipeline is used to track the lineage across our datasets. We use Tags to label our datasets with searchable metadata.
Metadata Synchronization
The other key decision we had to make was to figure out how to keep the control plane in sync with the source of truth. The information in DataHub had to be as close to the source of truth as possible, which implied that we had to go all the way to the system that generated these datasets to ensure they are automatically published to the catalog, instead of having a separate process to pull the data into DataHub. We did try an approach in the past where we pulled information into DataHub from various sources and it very soon became an unmanageable system as it required additional processes to reconcile the changes between pulls.
As we proceeded down the path of keeping data in sync by closely aligning with the source, the orchestration system where the data pipelines get written was a natural injection point for us. We landed on Airflow as our orchestration system, working with a partner called Astronomer to improve the local development experience and eliminate the burden of having to host Airflow ourselves. While it may seem like a trivial decision, this unlocked a lot of efficiency and productivity on our end.
We invested in building the bridge between Airflow and DataHub to make this synchronization seamless for our developers building data pipelines and this helped us accelerate the adoption of our control plane.
Early Wins: Transforming Our Data Landscape
The implementation of our control plane has yielded tangible benefits, demonstrating substantial progress towards our envisioned ideal developer journey. Within a relatively short time frame, we have observed several key improvements across various aspects of our data ecosystem:
Data Discovery
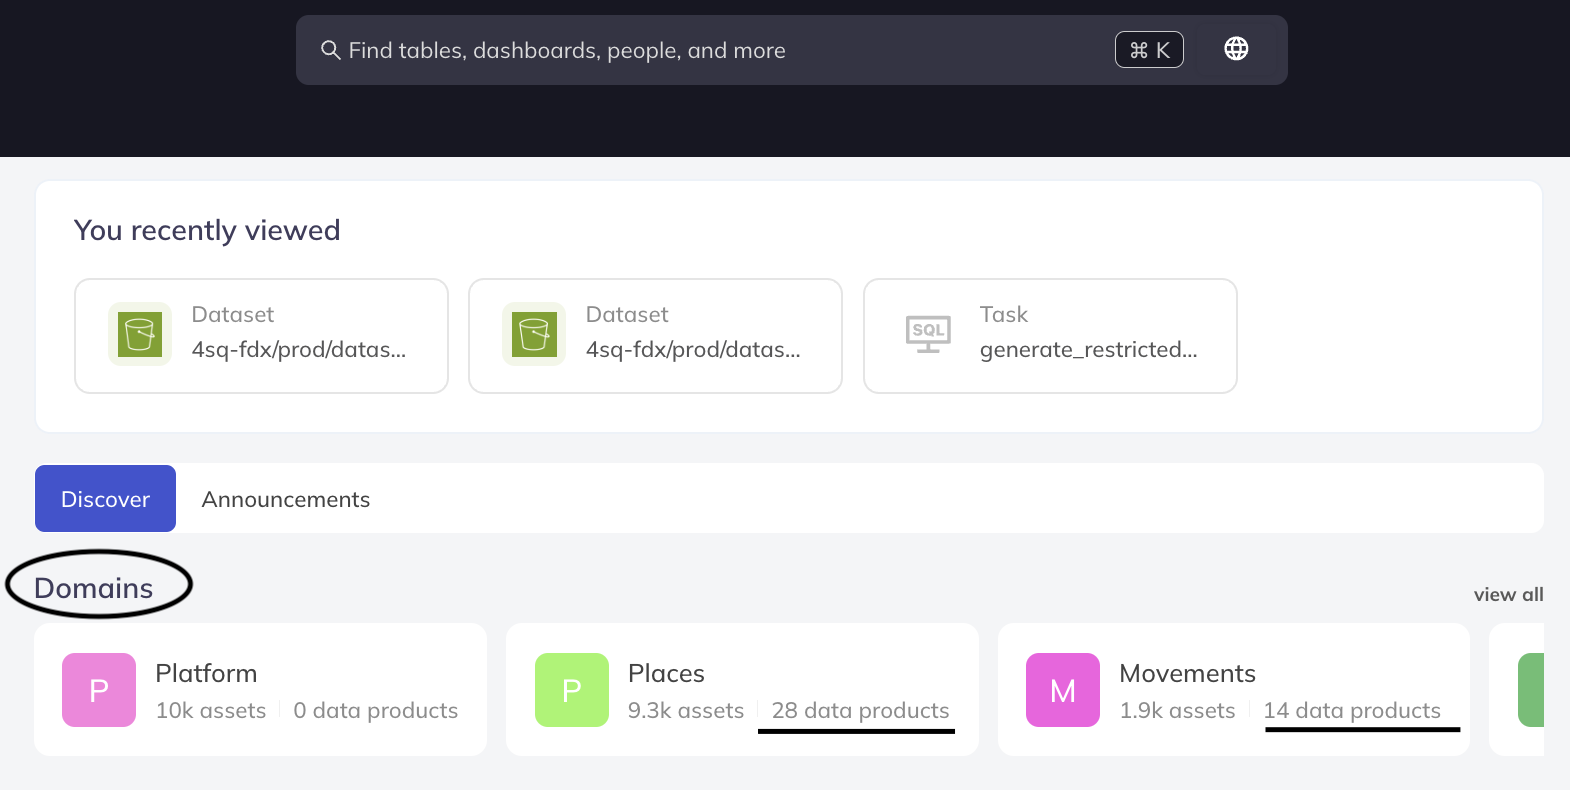
We drove the adoption of our control plane, allowing teams to discover datasets and data products by domains or search for them by attributes. In the below images, you can see how we are able to browse by domains and data products. Specifically, if you look at the overall number of assets (9.3k) compared to the data products (28) in the Places domain, it is evident why this control plane makes it easier to find relevant assets from the vast pool of datasets.
Success Story: The Movements data science team leveraged a land parcels dataset from the Places domain in their Visit detection models, demonstrating improved cross-team data utilization.
Data Exploration & Processing
We enabled one-click access to datasets for ad-hoc querying and provided auto-generated sample code in documentation to quickly incorporate the datasets into their data pipeline. In the below image, you can see the schema in the browser and a link at the top right corner that links into a Databricks notebook pre-populated with sample queries on that dataset.

Success Story: Our teams reported a reduction in data discovery and access time from the order of days to minutes.
Data Lineage
We enabled teams to get easy visibility into the upstream and downstream dependencies of their datasets. In the below diagrams you can see both a graphical and tabular representation of the dependencies of a specific dataset.


Success Story: Our Visits team tracked internal consumers of their dataset, facilitating planning for column deprecations.
Continuing the Journey: Next Steps in Our Data Evolution
While we’ve made significant strides, some aspects of our ideal journey are still in progress:
- Data Access: We are developing a simplified permissioning model to federate permissions across different compute systems. A proof of concept has been completed, and we’re finalizing a rollout plan.
- Data Monitoring: We are focused on enhancing our data monitoring capabilities by making key dataset statistics easily accessible in DataHub and integrating automated anomaly detection tools.
Outside of the control plane efforts, we’re investing in the data plane by adopting open table formats like Delta and Iceberg where applicable, and standardizing on a single metastore to eliminate raw S3 bucket access.
Mapping the Future of Geospatial Intelligence
Our journey to transform Foursquare’s data platform has yielded remarkable results. By implementing a comprehensive control plane for our data platform, we’ve accelerated innovation, enhanced collaboration, and streamlined compliance. Data discovery and access times have shrunk from days to minutes, unlocking new potentials across our teams.
As AI and machine learning continue to reshape the tech landscape, the importance of well-managed, accessible data becomes even more critical. Our evolved data ecosystem doesn’t just improve our internal operations—it positions us to harness the full power of AI in geospatial analysis. In the rapidly evolving world of location technology, this enhanced data infrastructure ensures Foursquare remains at the forefront, ready to map the AI-driven opportunities of tomorrow.
Foursquare Data Platform is led by Arthur Wolf and our core team includes Izzy Hayden, Danielle Damon, Changliang Cao, Tony Zhang, Francesco Macagno, Cary Cherng, Aleksey Morozov and Nicholas Pena.
Redefine the future of location intelligence
Interested in joining the team that’s reinventing the modern data platform? Check out open engineering roles at Foursquare today.
Authored By: Vikram Gundeti