
Fleet Visualization
Fleet visualization involves the playback and study of the movement of entire fleets. Such visualizations can be a powerful analytic tool, allowing viewers to pinpoint congestion, understand incidents, and improve the overall efficiency of fleets.
Businesses involved in mobility, transportation, and logistics are increasingly collecting data that contains a range of positions tracing the movement of a collection of entities over time. For such collections of moving entities (such as cars, people, and airplanes), it is incredibly useful to analyze what happens during that movement — not just at the start and end points.
On the Studio Platform, fleet visualization is best achieved through the Trip Layer.
Input data
Like any complex tool, fleet visualizations are far more useful if they are quick and easy to create.
The Studio platform can quickly transform CSV tables with just a few columns of data into highly detailed animated fleet visualizations.
Data columns used in a fleet visualization include:
| column | required | type | description |
|---|---|---|---|
timestamp | Yes | string, number | A timestamp in milliseconds, date strings, or other support date format. |
longitude&latitude | Yes | number,point | A number representing the position of the moving entity (typically in degrees). |
vehicle IDs | Yes | number, string | A unique identifier for the moving entity (typically a number or string). |
Elevation | No | number | The elevation of the moving entity (typically in meters). |
Direction | No | number | The direction of the moving entity (typically clockwise from north). |
Speed | No | number | The speed of the moving entity (typically in kph or mph). |
| Any other metadata | No | any | Any other piece of metadata that can be applied to the visualization. |
The above example uses a simple CSV table containing rows with latitude and longitude positions, time stamps, and flight icao24 codes (a unique 24-bit aircraft identifier used as the vehicle ID).
Excerpt from the dataset used in the above example:
| icao24 | lat | lon | timestamp | remarks |
|---|---|---|---|---|
| 39840f | 42.0846 | 11.5085 | 1567555680 | Origin |
| 39840f | ... | ... | ... | Time stamps & coordinates during flight |
| 39840f | 48.9928 | 2.5645 | 1567559880 | Destination |
| 39840e | 48.1327 | 2.3195 | 1567555200 | Origin |
| 39840e | ... | ... | ... | Time stamps & coordinates during flight |
| 39840e | 42.0914 | 2.985 | 1567557960 | Destination |
Visualization Features
An effective fleet visualization should convey a strong situational understanding to the analyst.
The Studio platform combines a wide range of advanced visualization techniques such as fading movement trails, 3D vehicle models, realistic geospatial environment options, and metadata presented as labels next to each vehicle.
Trails
You can visualize the recent movement of vehicles through trails.
The trail feature is highly configurable in the Studio platform, allowing you to visualize metadata in meaningful ways.
Animated fleet visualization showing altitude over the English Channel.
(Red = lower altitude; White = higher altitude.)
You can customize the trails' length, color, stroke, and fade. With the Billboard feature enabled, trails are oriented toward the camera.
3D Models
You can use 3D models to represent each vehicle, dramatically increasing viewer engagement.
The Studio platform offers a range of built-in 3D models:
| Name | Icon |
|---|---|
| Airliner |  |
| Airplane |  |
| VTOL |  |
| Glider |  |
| Helicopter |  |
| Car |  |
| Truck |  |
| Scooter |  |
| Custom |  |
Note: You may also import 3D models (via the glTF 2.0 standard) if the above built-in models are not sufficient. Settings are provided to rotate and scale imported models.
3D models gracefully traverse maps thanks to several techniques applied to them, such as:
-
Position Interpolation: A technique that continuously interpolates a vehicle's location between known positions. This feature eliminates the choppy behavior that occurs when vehicles "jump" between known positions.
-
Direction Inference: A technique that automatically calculates the orientation of the vehicle based on available data. While the Trips Layer allows direction to be controlled by your dataset, datasets with only intermediate positions will automatically have the vehicle's direction calculated and displayed.
-
Elevation: the altitude of Airplanes, VTOLs, drones, and even birds can be visualized if the dataset contains a
zcoordinate.
Per-Vehicle labels
You can assign labels to each vehicle in your fleet. These labels can expose a new layer of information while identifying specific vehicles within a fleet.
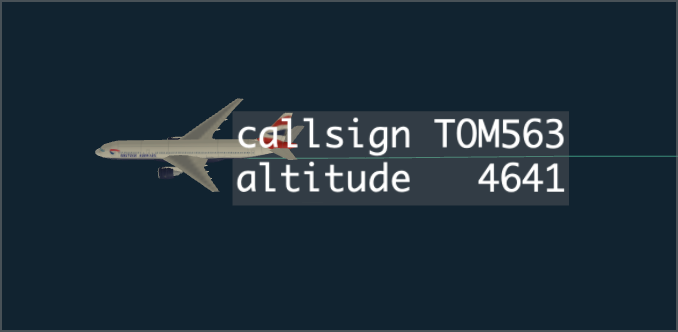
A label applied to an airliner showing its call sign and altitude.
Label features include:
-
Moving per-unit "tooltip": Exposes critical metadata next to each vehicle, such as its ID, speed, remaining fuel, or other static/dynamic metadata.
-
Tooltip formatting: Controls the formatting of per-object tooltips, such as columns shown, font size, text/background color, and label anchoring/alignment.
-
Value Interpolation: Smooths a moving entity's tooltip values during animation. Displayed values are interpolated between the discrete positions from the input data. For instance, speed values can be interpolated between two provided points, giving users an estimated speed at any given position throughout an animation.
Advanced Techniques
While animating an entire fleet is powerful in its own right, combining fleet visualizations with other animated datasets can expose key correlations that may otherwise be hard to spot.
The fleet animation can be one of many layers in your visualization. Use the Studio Platform to expose supply-demand balance, understand the relationship between average speed and accidents, or overlay weather patterns to uncover valuable insight.
Integrate Into Your Infrastructure
Using the Studio Data SDK, form deep integrations with your own infrastructure. Users can automate the creation of fleet visualizations from incoming datasets, and customer tools and dashboards can link to automatically-generated Studio maps.
Alternatively, you can utilize integrations such as the Studio Grafana Plugin to display visualizations in monitoring dashboards.
Share
Like all Studio maps, fleet visualizations can be published and shared via URL, either openly or under password protection.
Additionally, the Export Video feature allows you to capture highlights from a fleet visualization and share them however you wish.
Interactive Examples
Below are several interactive examples that use the Trip Layer to achieve airline fleet visualization. Click Explore in Studio to check out the map's configuration.
The above example (used throughout the above sections) uses a simple CSV table containing rows with latitude and longitude positions, time stamps, and flight icao24 codes (a unique 24-bit aircraft identifier used as the vehicle ID).
The same example above utilizing custom styling to replicate the style of an air traffic control display.
The above example visualizes two hours of flight trajectories collected by OpenSky Network. The flights and its trails are colored by the country origin.
Updated about 1 year ago