
Enrich with Hex Tiles
Hex Tiles can be joined to other datasets to enrich them with contextual information.
Enriching datasets with Hex Tiles is achieved through a join operation. Join operations with Hex Tiles are always left or inner joins, with the Hex Tile dataset on the right.
Enrich With Hex Tiles in Studio
Studio supports joining non-tiled datasets with Hex Tile
datasets.
1. Add the Hex Tile to the map in Studio.
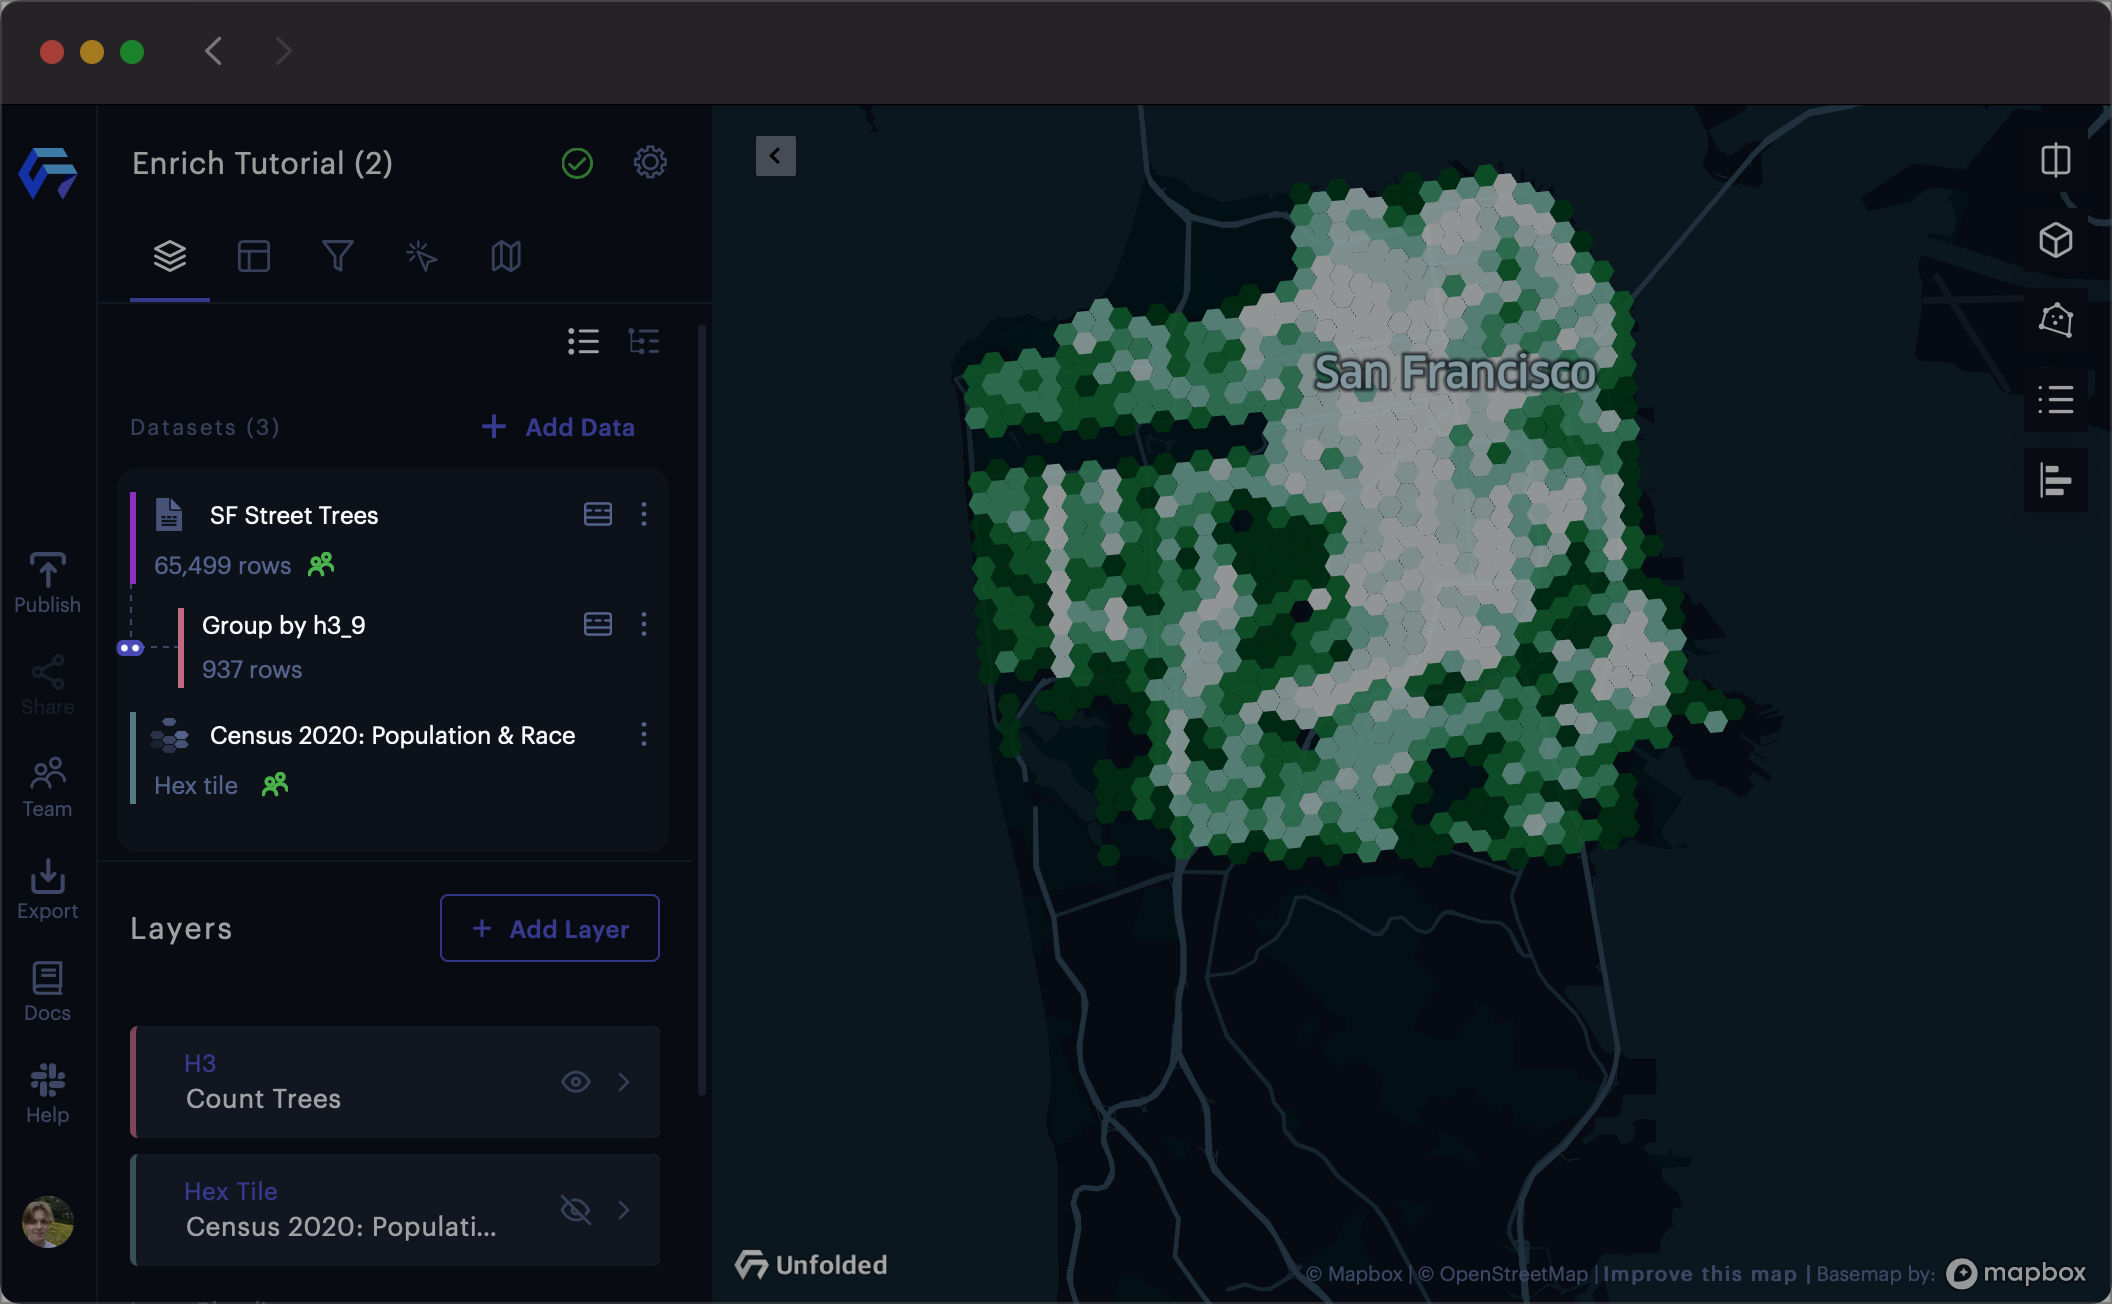
A Hex Tile dataset containing income data and a target dataset containing tree counts.
2. Click ⋮ More Options >> Join on the target (non-tiled) dataset.
3. Select the Hex Tile dataset to join against.
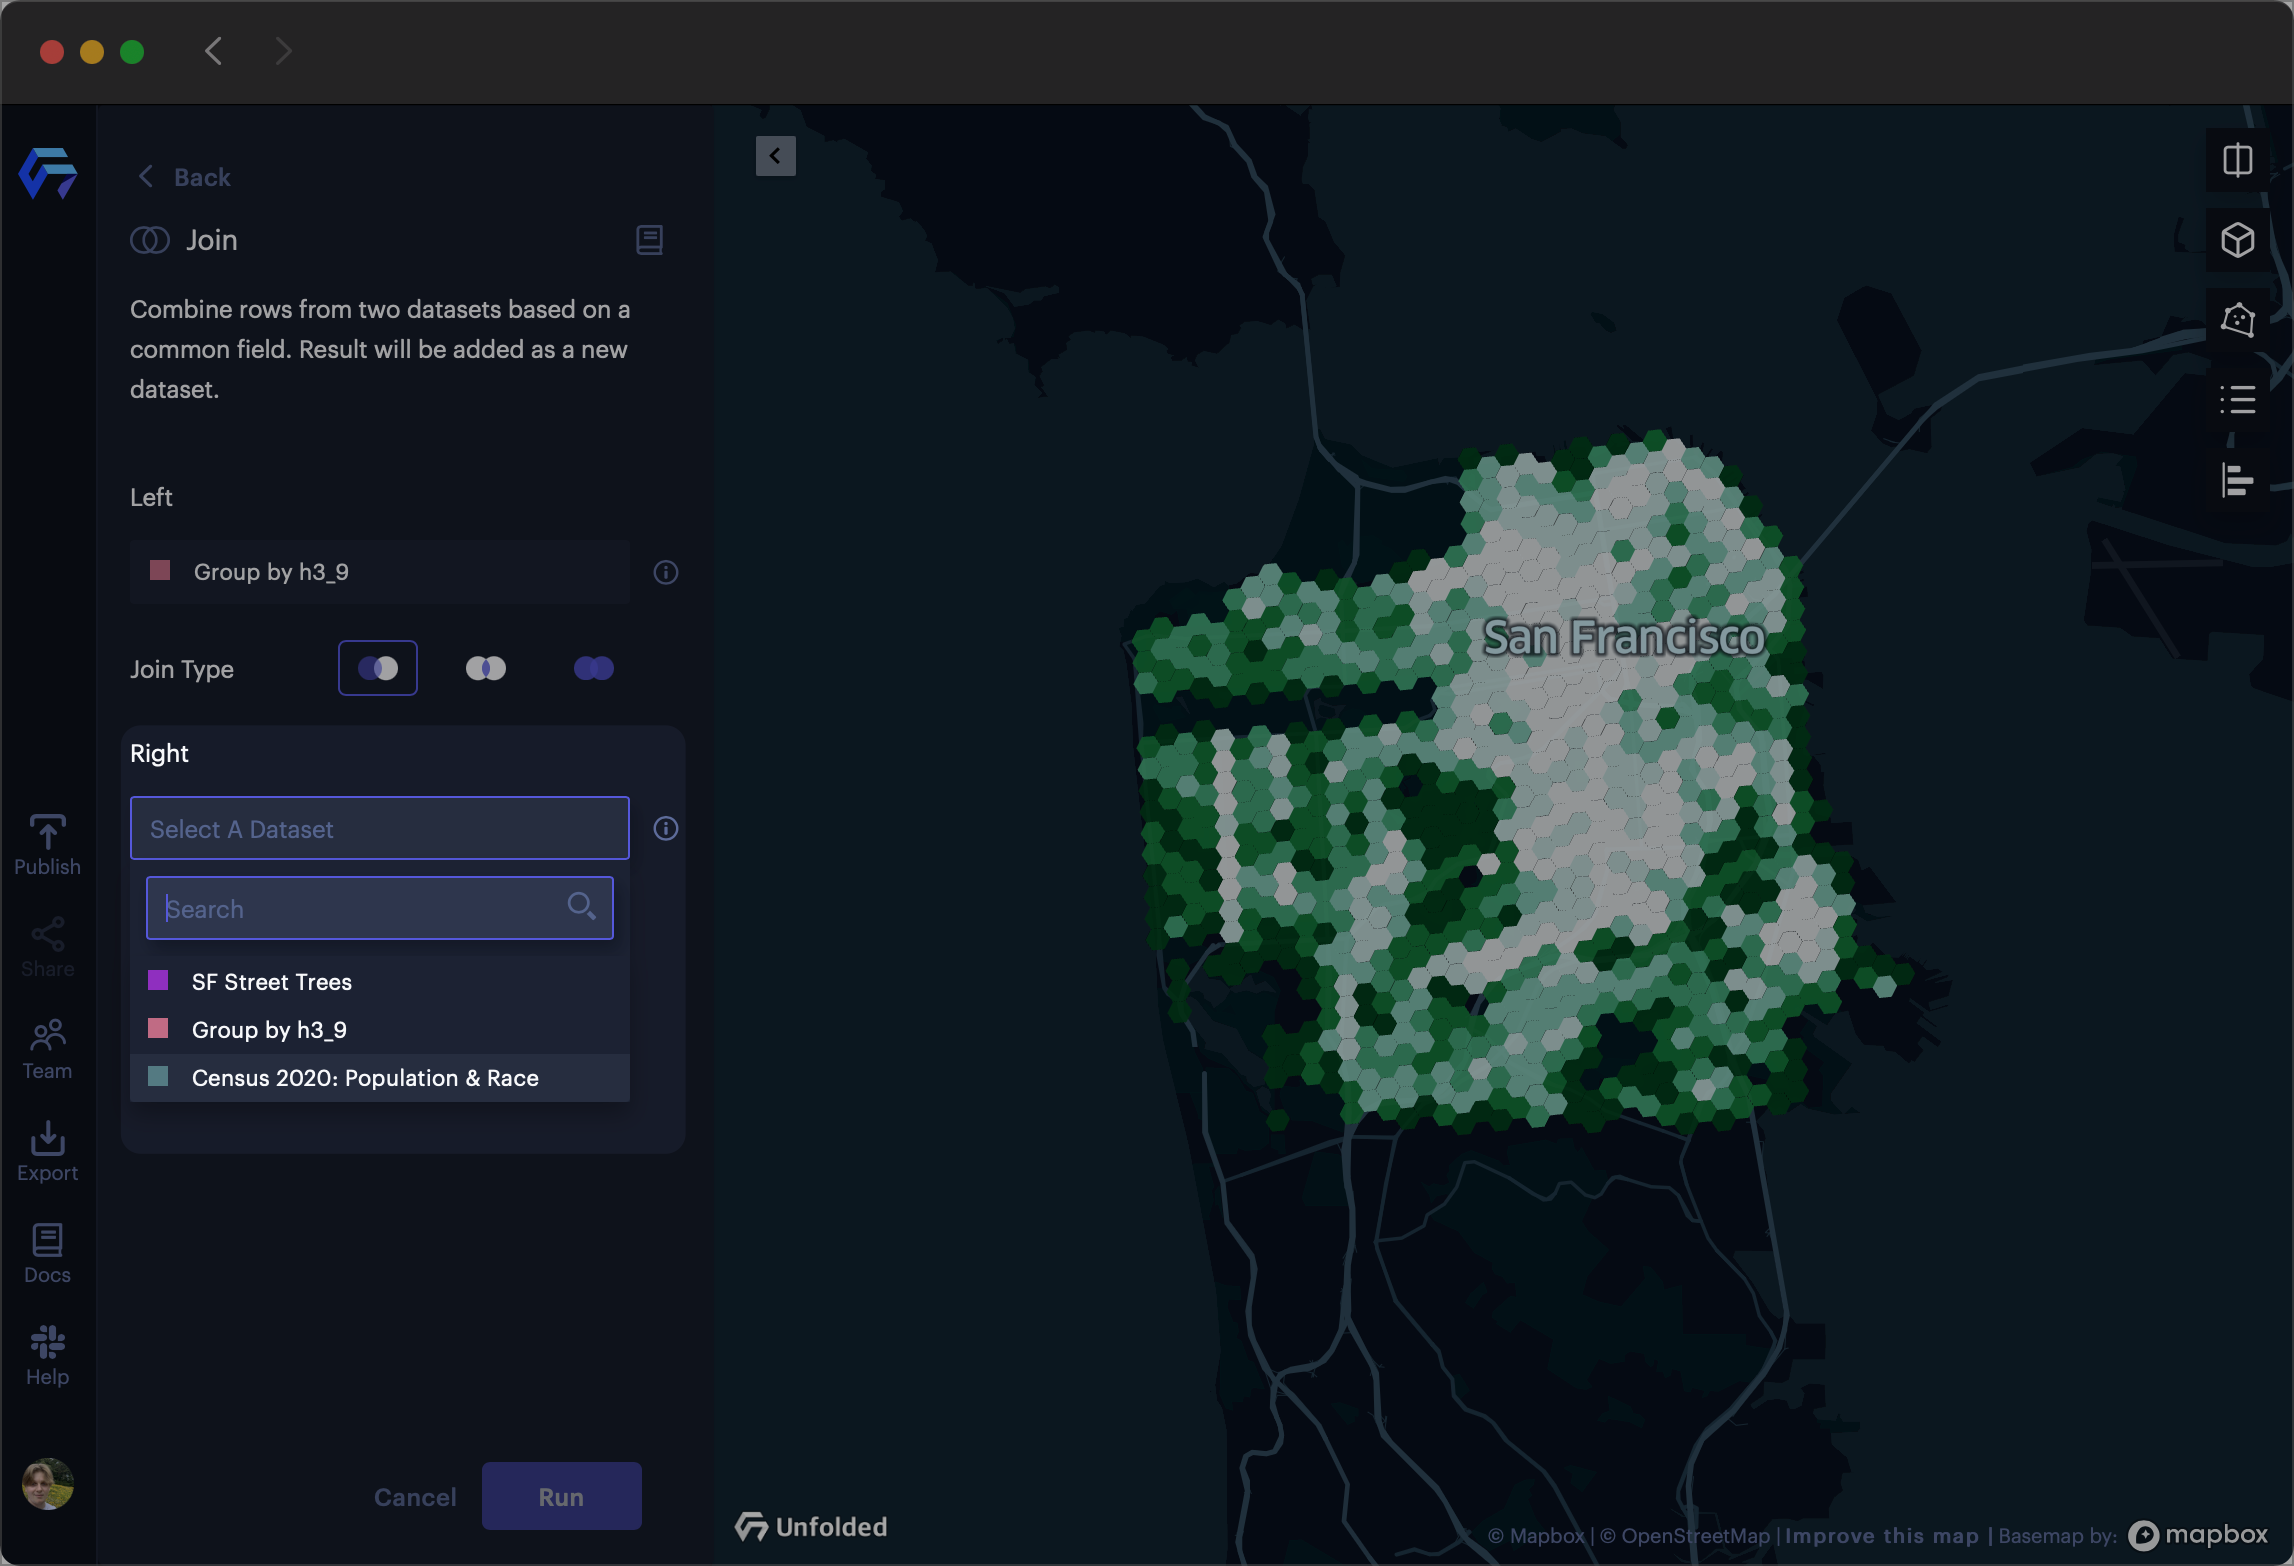
Selecting the "Census 2020" Hex Tile dataset.
4. Select the column to use for joining on the non-tiled dataset.
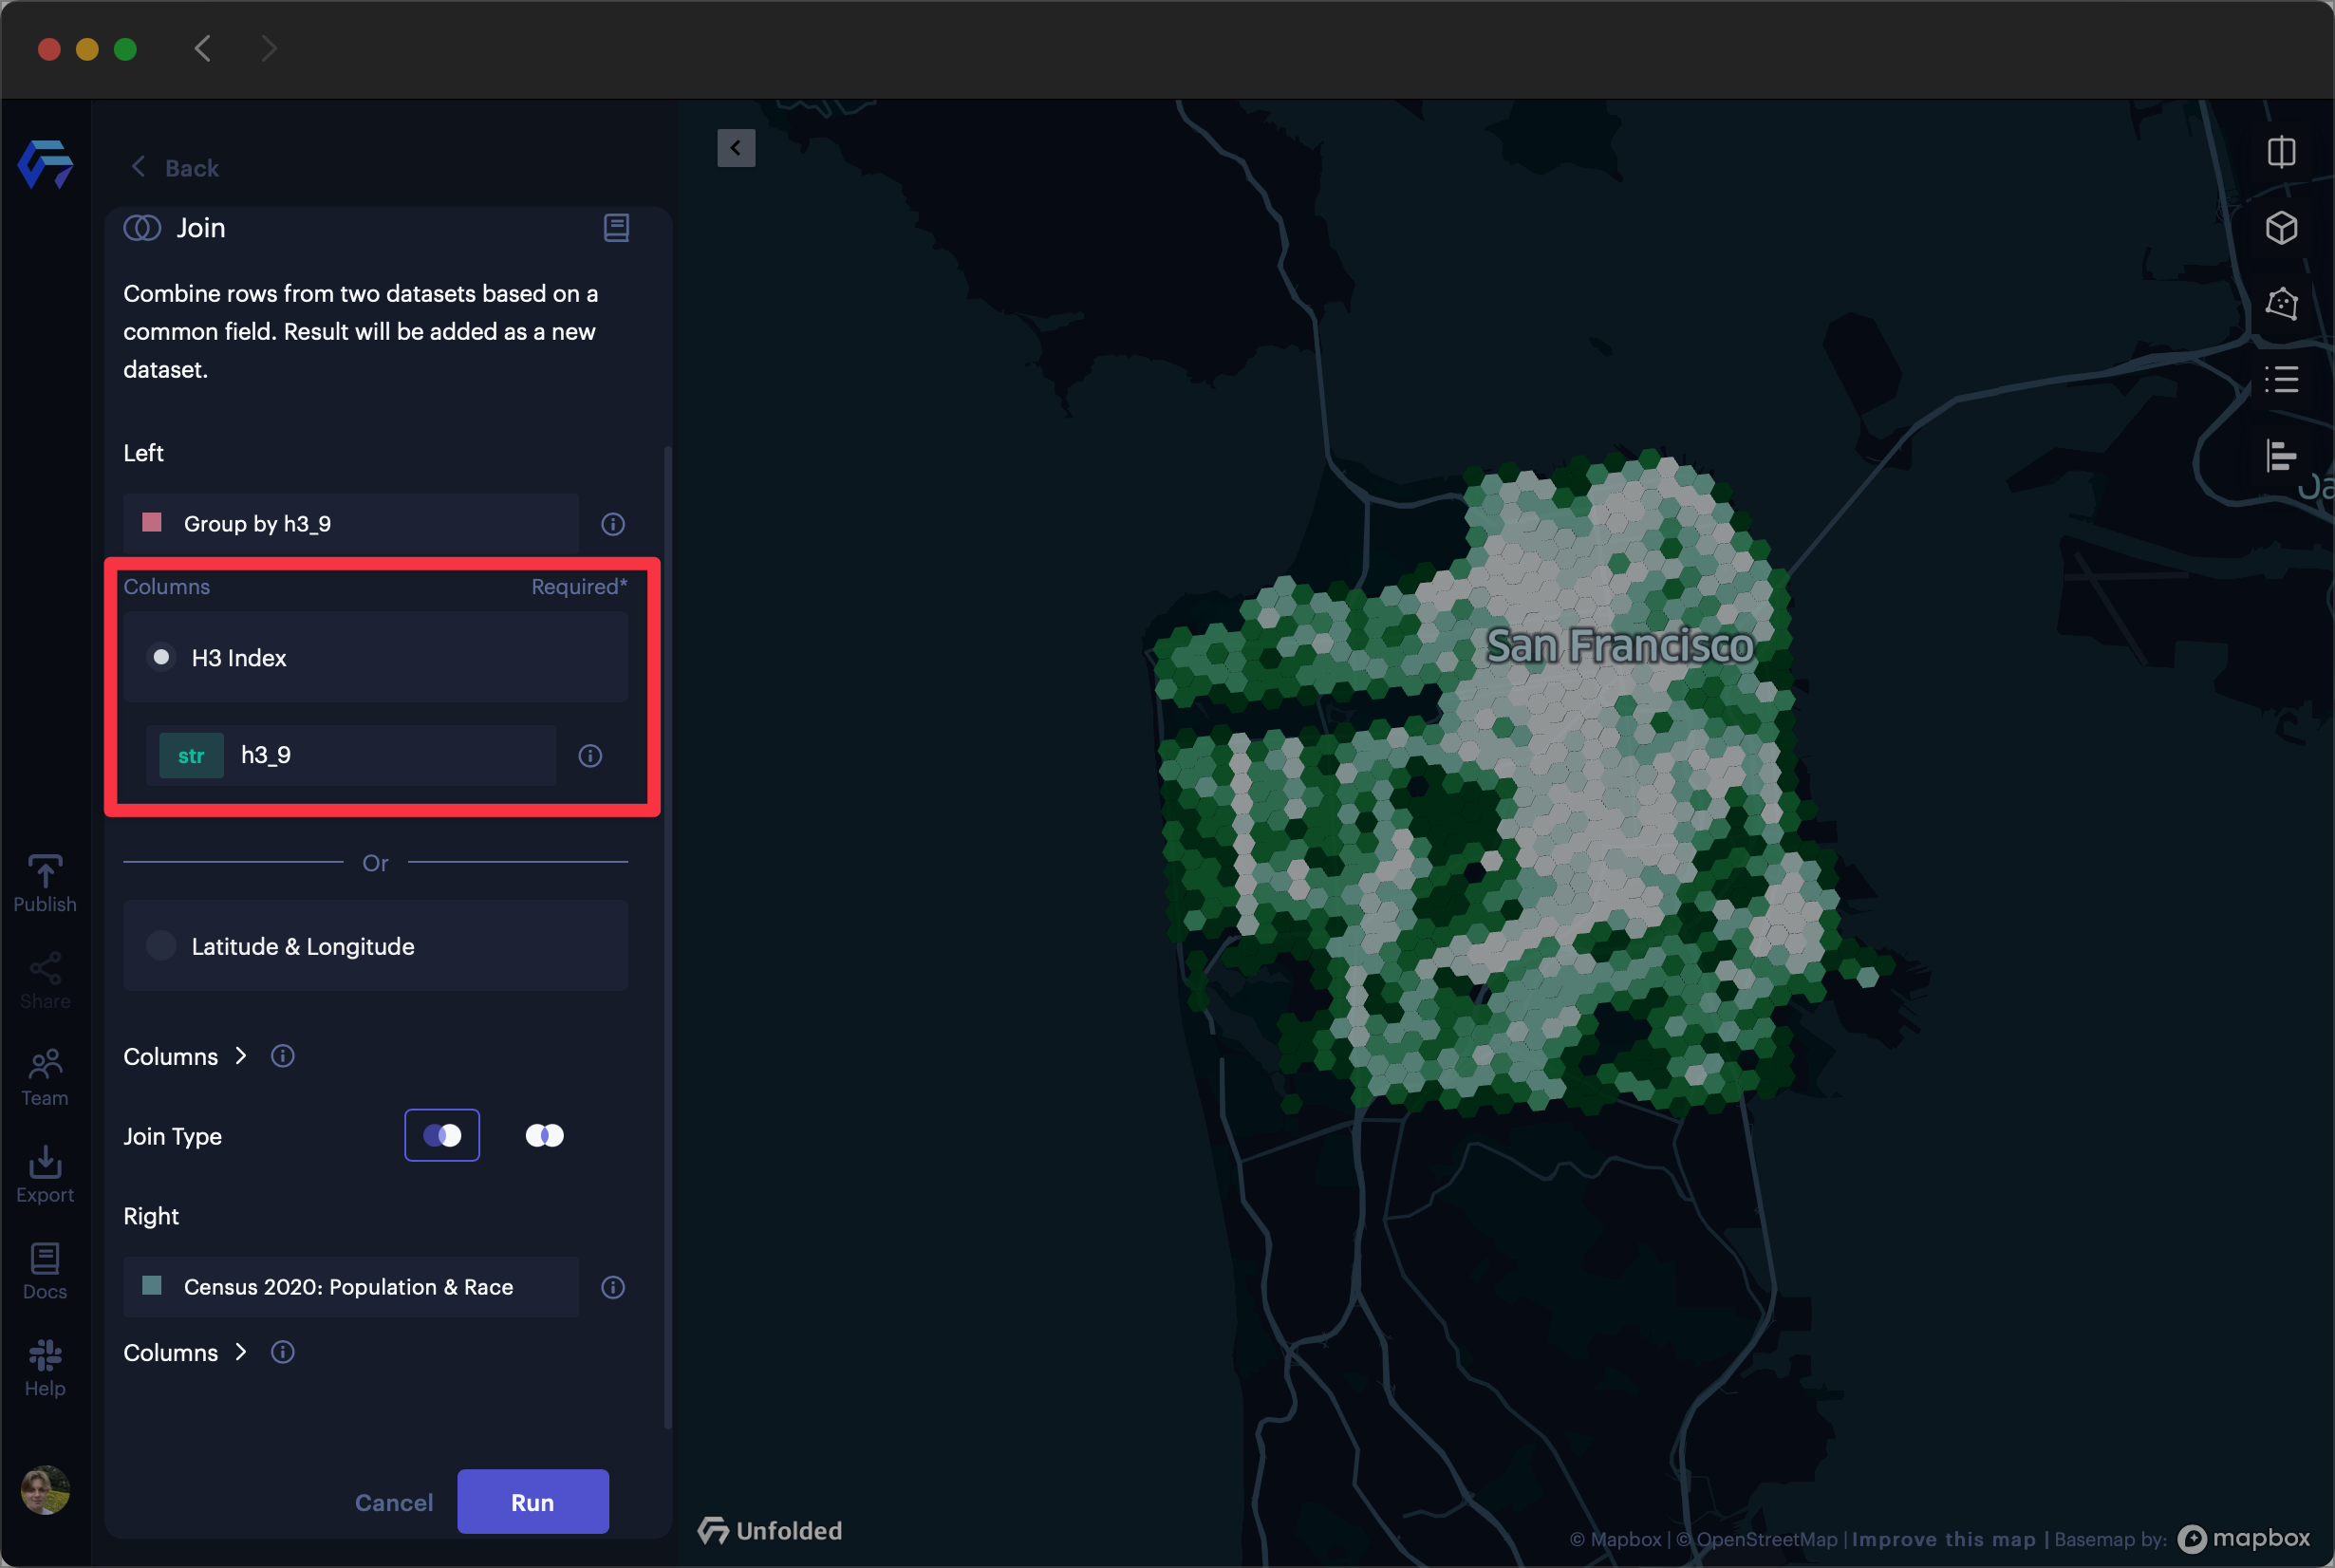
Selecting a column containing h3 indexes of tree locations in San Francisco.
The following types of columns can be used for joining with Hex Tiles:
- H3 indexes, if available in your target dataset.
- Latitude and longitude coordinates, which will be indexed to the appropriate H3 cell at the finest resolution supported by the Hex Tiles.
- Time, (required only for temporal Hex Tiles).
5. (Optional) Select the Hex Tile columns to use for enrichment. By default, all columns are included.
6. Click Run to initiate the join operation. You will see a preview of the joined dataset with columns from the Hex Tiles. Press Confirm to add the new joined dataset to your map.
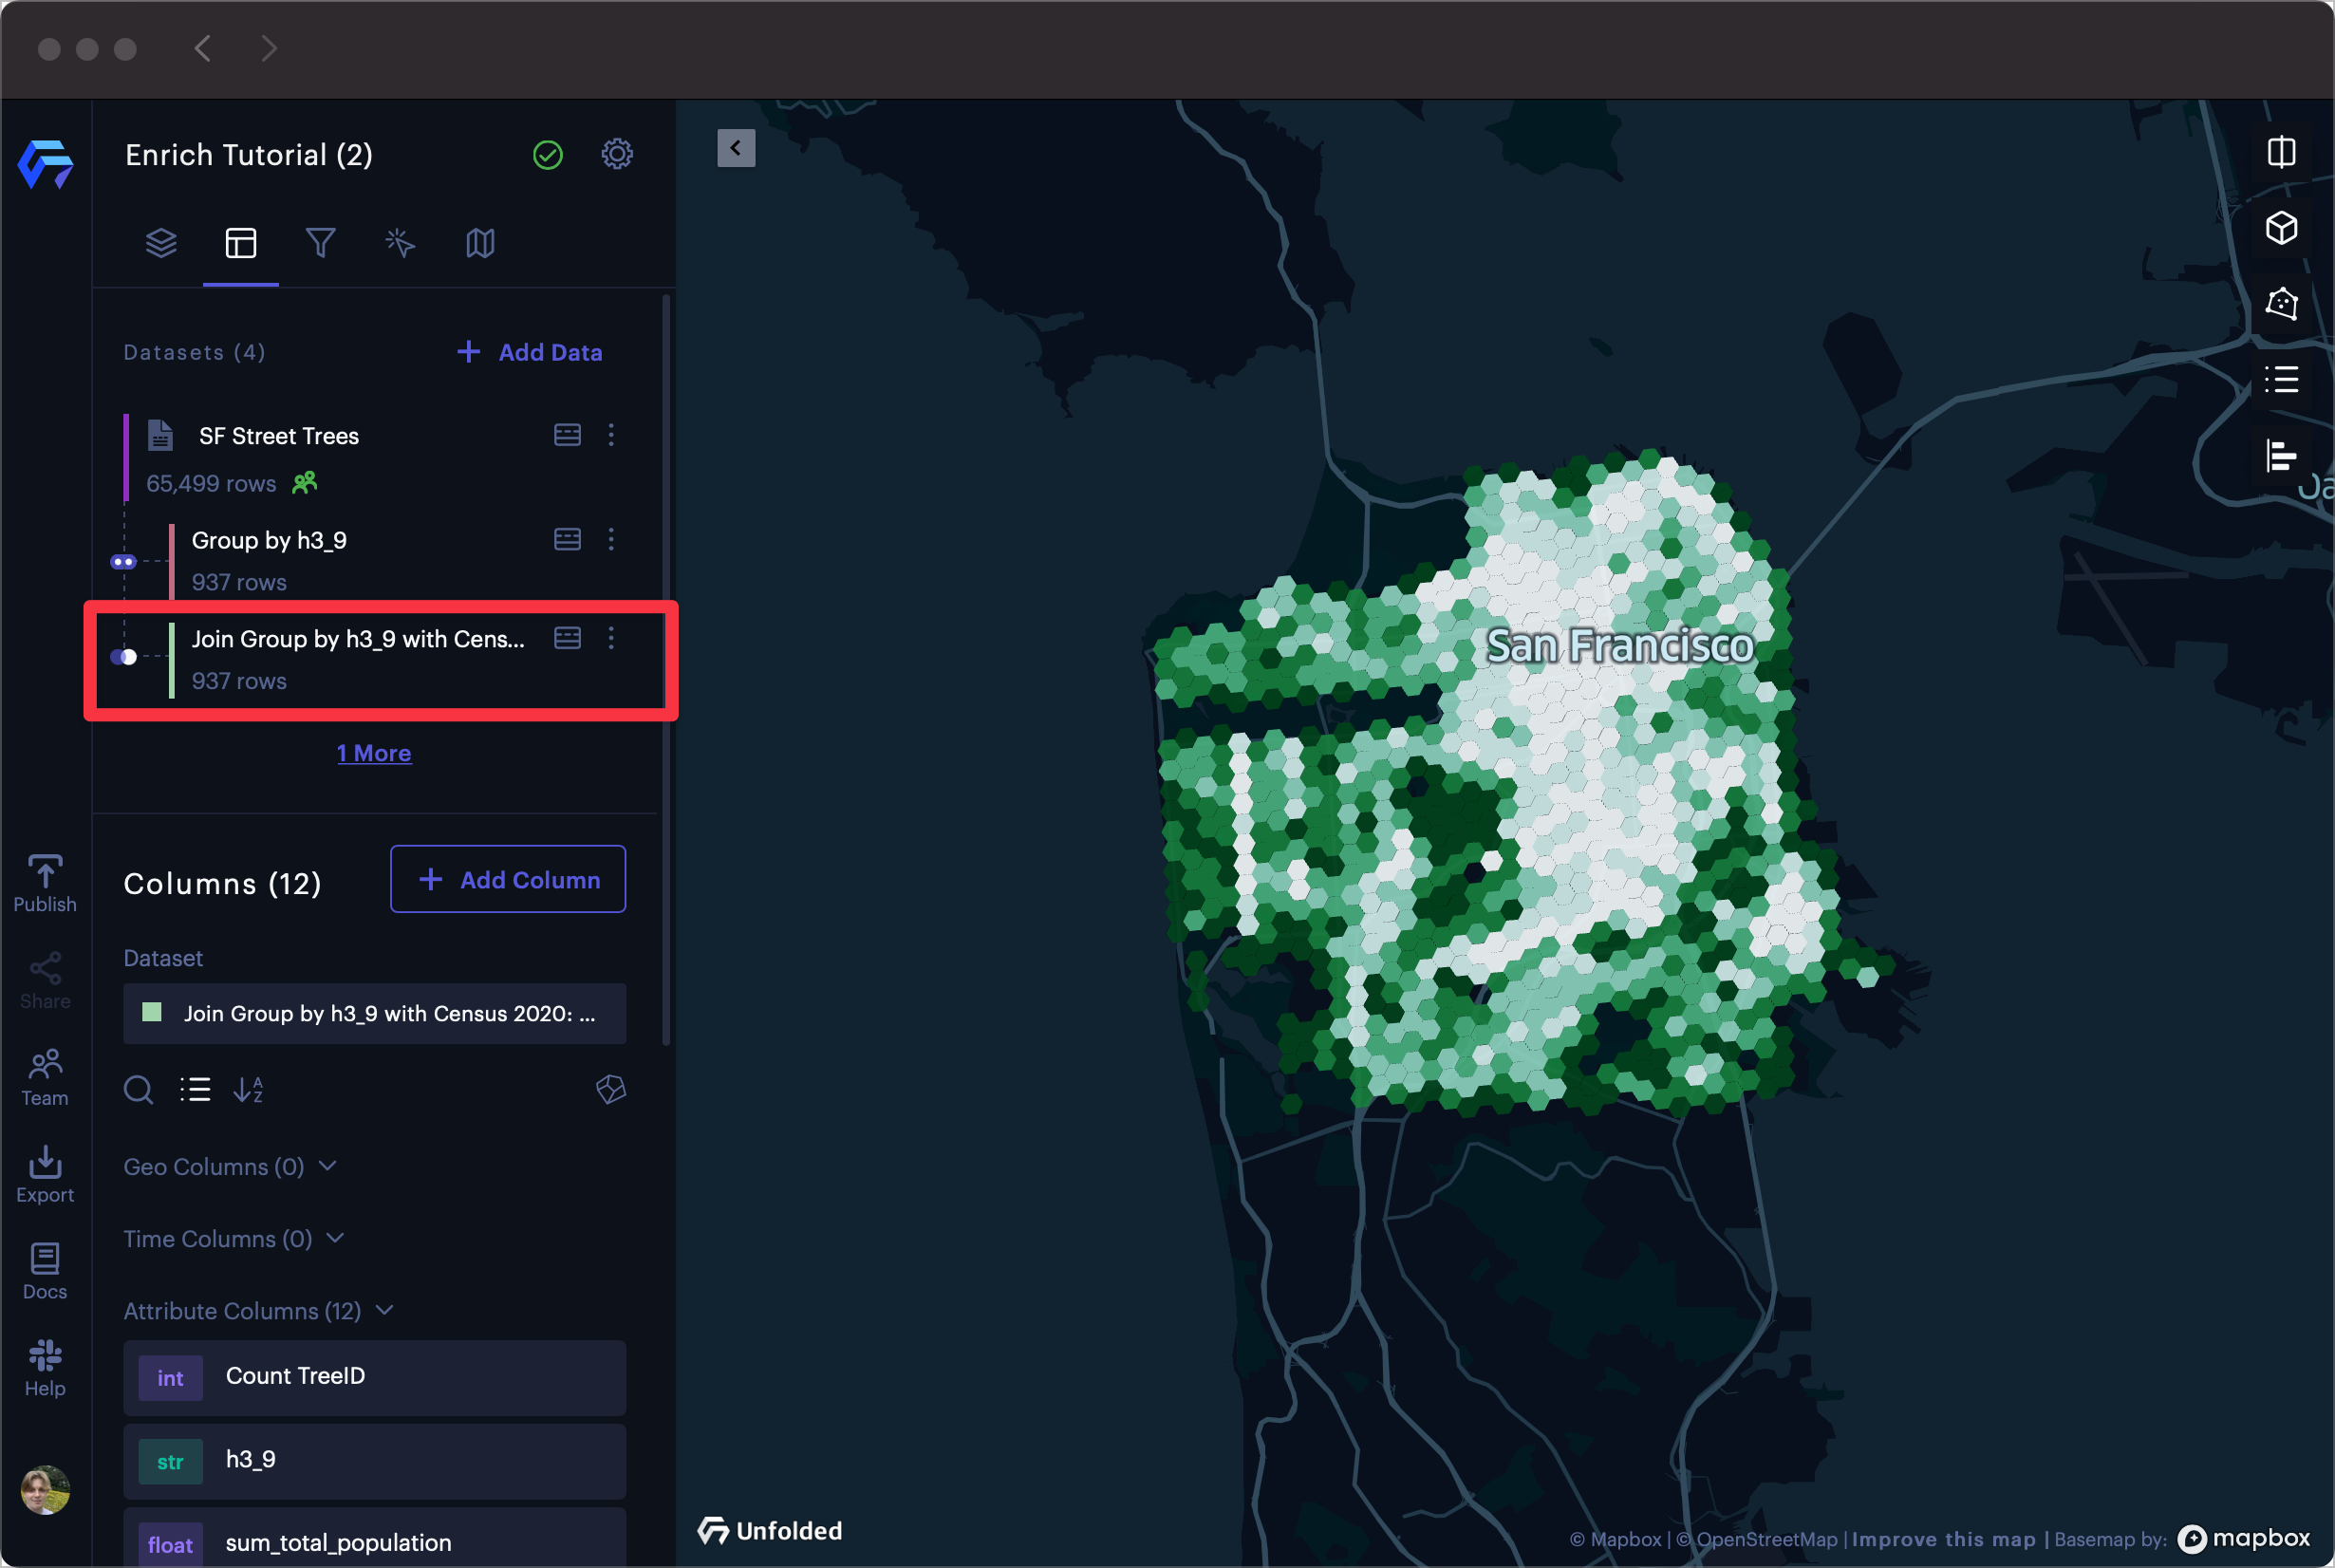
The joined dataset in the sidebar.
Using Enriched Hex Tile Data
Using the new enriched dataset, you can relate data previously separated between datasets.
The below example shows how to explore the enriched dataset, visualizing areas by the number of trees per individual.
1. Select the joined dataset, then create a new column.
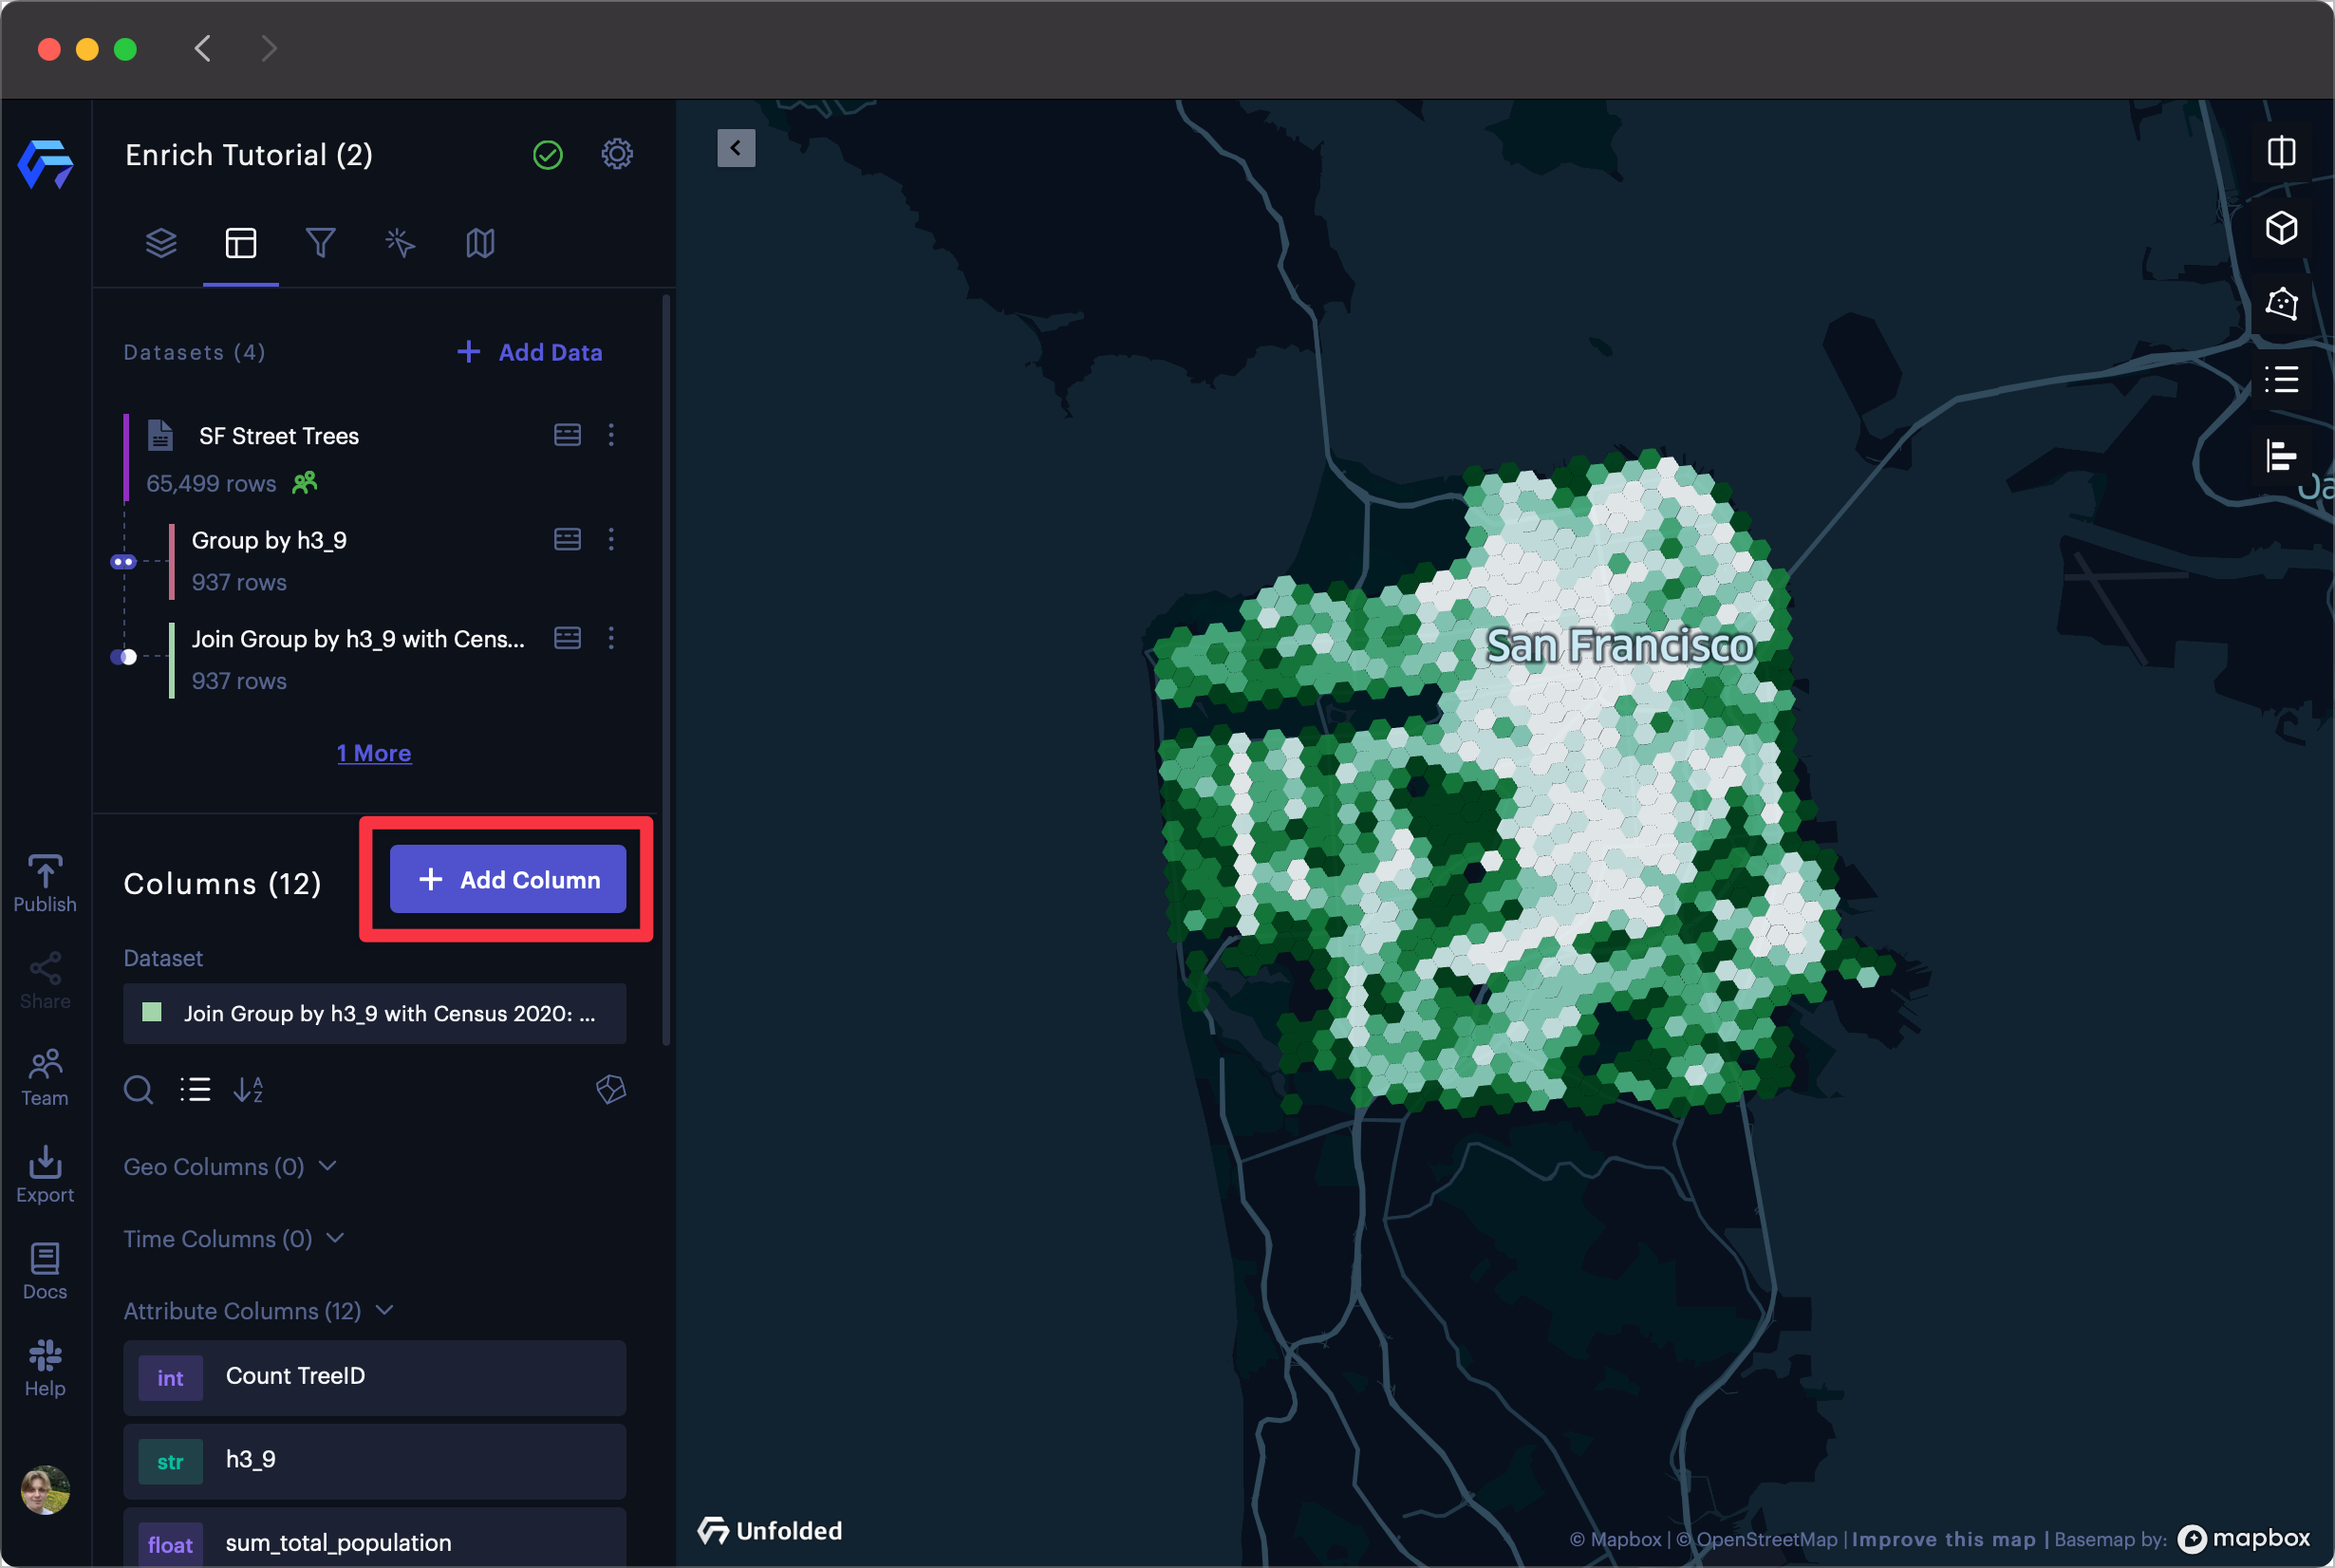
Creating a new column on the enriched dataset.
2. Create a formula for the new column, then click Create Column.
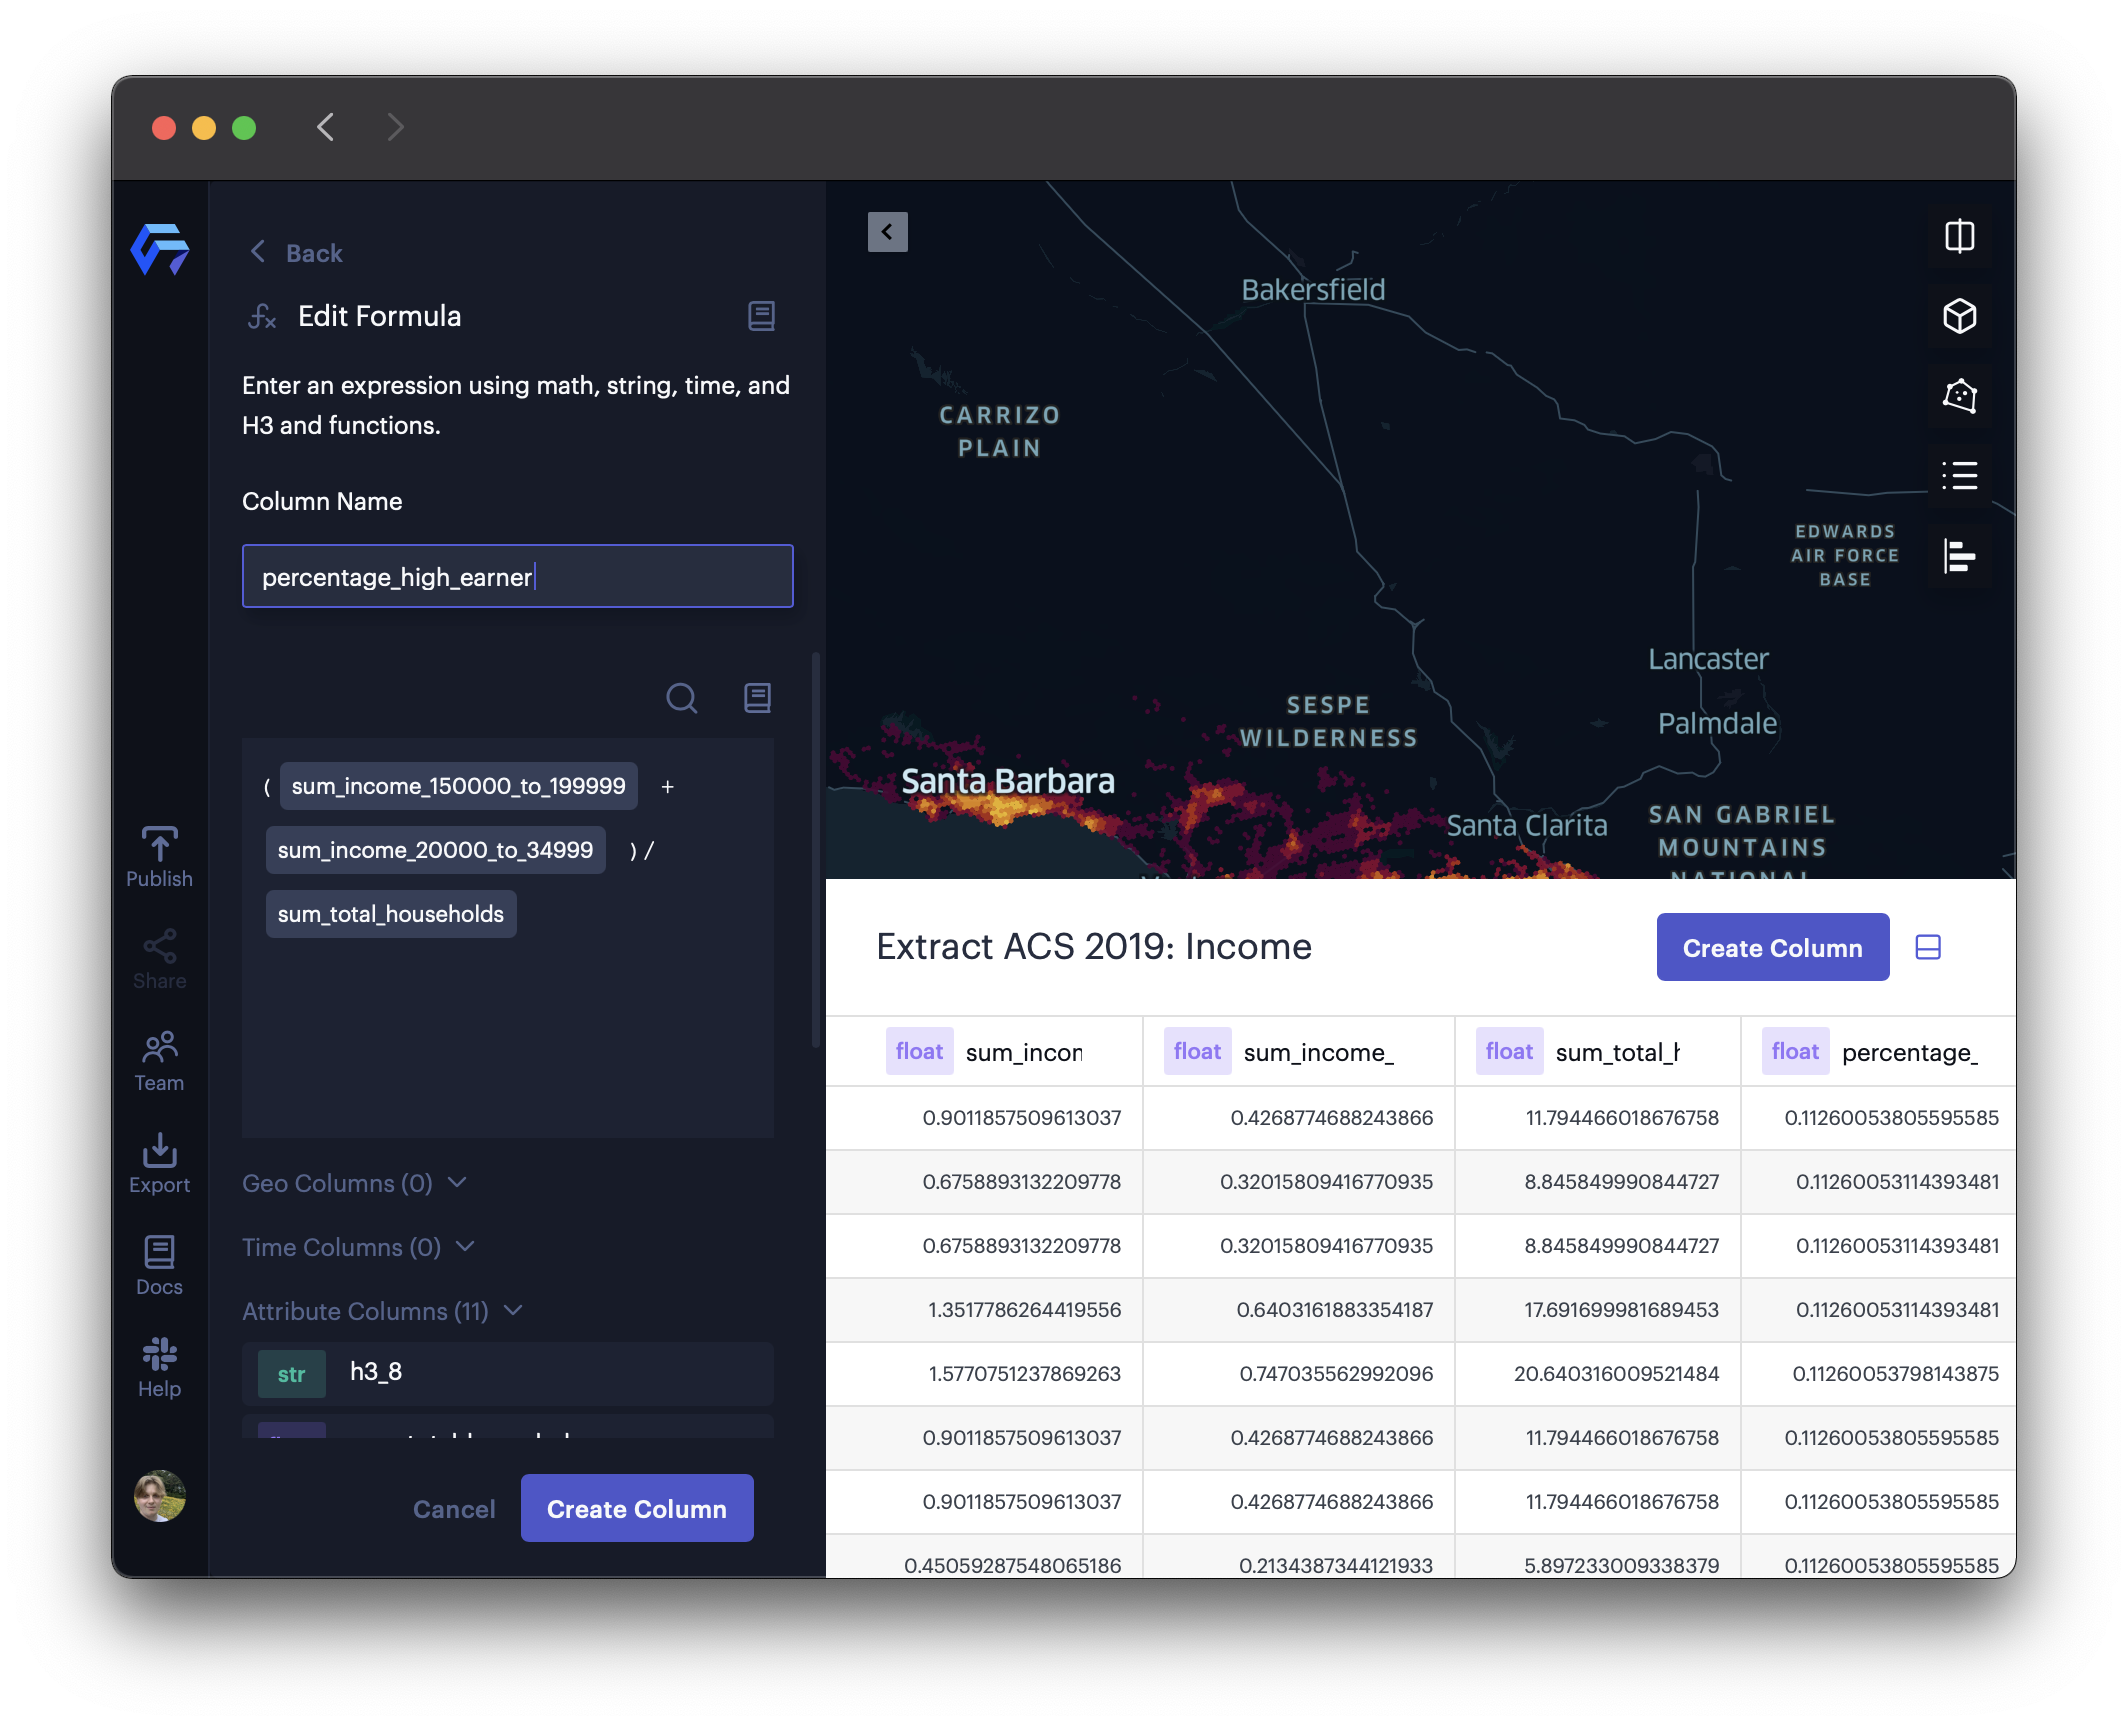
Creating a formula to calculate the number of trees per individual.
In this example, the new trees_per_individual column is generated with the expression:
Count TreeID /sum_total_population.
3. Configure your layer to visualize the new column.
Visualizing the new "trees_per_individual" column.
Video Tutorial
Watch the video below to learn how to enrich data with Hex Tiles.
Enrich With Hex Tiles in the Data SDK
Datasets can also be enriched with Hex Tiles using the Data SDK. Refer to the Data SDK reference to learn more about enriching through the SDK.
Updated 4 months ago