
Line Layer
Line layers are the 2D version of arc layers. Both draw a line between two points to represent distance, but, in a line layer, the line is drawn across the shortest distance between the two points.
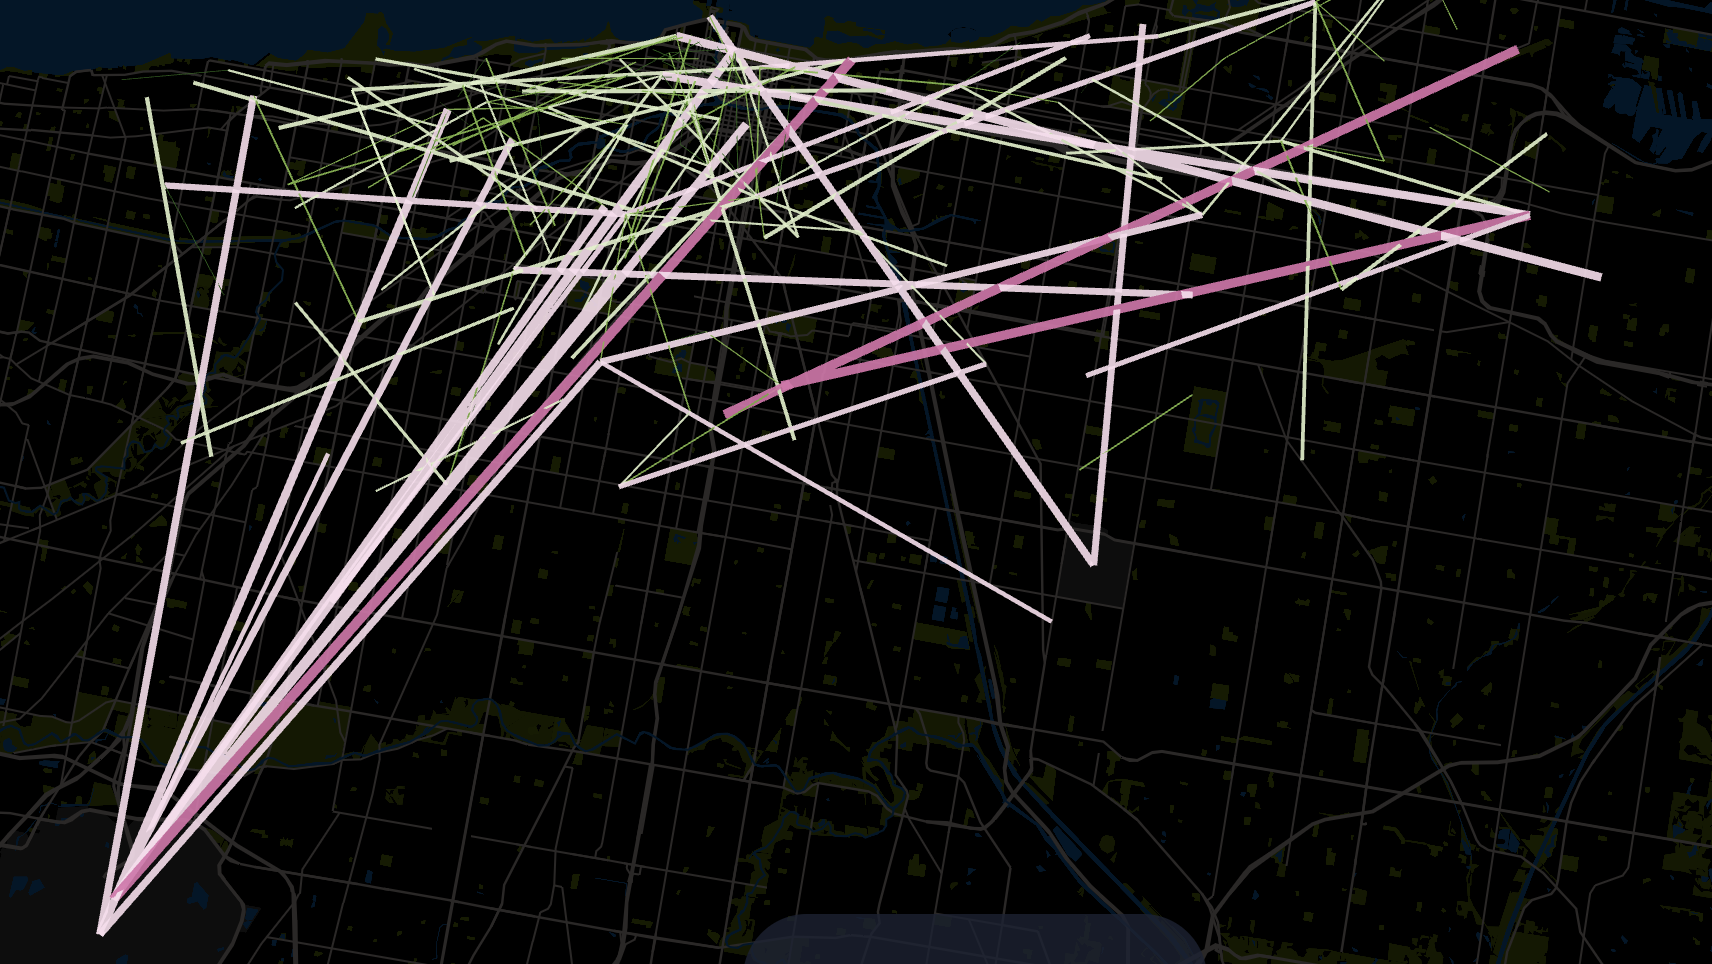
An example of the Line Layer.
Settings
The following section provides help for every setting in Line Layer.
Basic
Contains basic settings required for Line Layer configuration.
You can draw lines in two ways -- creating an line from a set of source and destination points, or from a set of points and their neighbors.
| Setting | Description |
|---|---|
| Layer Type | Must be Point to display the line layer. |
| Dataset | Required. The dataset to use for the line layer. |
| Columns | Required. The columns to use for the line layer. |
| Columns: Points | Provide a pair of source/target latitude and longitudes columns, or Hex/H3 ID columns. Optionally, include an altitude column. |
| Columns: Point and Neighbors | Provide a latitude and longitude column for a point, then a geo column containing one or more neighbors. Optionally, include an altitude column. |
Color
Color settings for the line.
| Setting | Description |
|---|---|
| Color Based On | The field to base the line color on. |
| Color Scale | The color scale and palette for the line color. |
| Opacity | The opacity of the line color. 100 = fully opaque, 0 = fully transparent. |
Stroke
Color settings for the stroke, or line width.
| Setting | Description |
|---|---|
| Stroke Slider | The stroke width (or range of stroke width when a field is selected for "Stroke Based On"). |
| Stroke Based On | The field to base the stroke width on. |
| Stroke Scale | The scaling of the stroke width. Choose from linear, sqrt, or log. |
Elevation Scale
Elevation settings for the Line Layer. Requires an elevation column.
| Setting | Description |
|---|---|
| Elevation Scale | When an altitude is defined, a multiplier applied to emphasize elevation. |
JSON Schema
For details on how to programmatically specify layer properties, refer to the Layer Configuration specification.
Updated over 1 year ago