
H3 Analytics
The Studio platform is designed from the ground up to leverage the power of the H3 system and offers extensive out-of-the box support for H3 equipped datasets together with unique features such as Hex Tiles that enable H3 to be used at unprecedented scales.
H3 is a hexagonal, hierarchical, discrete global grid system with highly desirable analytic properties (constant distance to neighbors, ability to form concentric rings etc).

Geospatial geometry quantized into the H3 grid.
Accessing H3 Data
To work with H3 in Studio, your dataset needs to have at least one column containing H3 indexes. This section describes a number of ways to import or create H3 columns in Studio.
Note that if you are just getting started, you can use the sample data sets in the Studio Data Catalog.
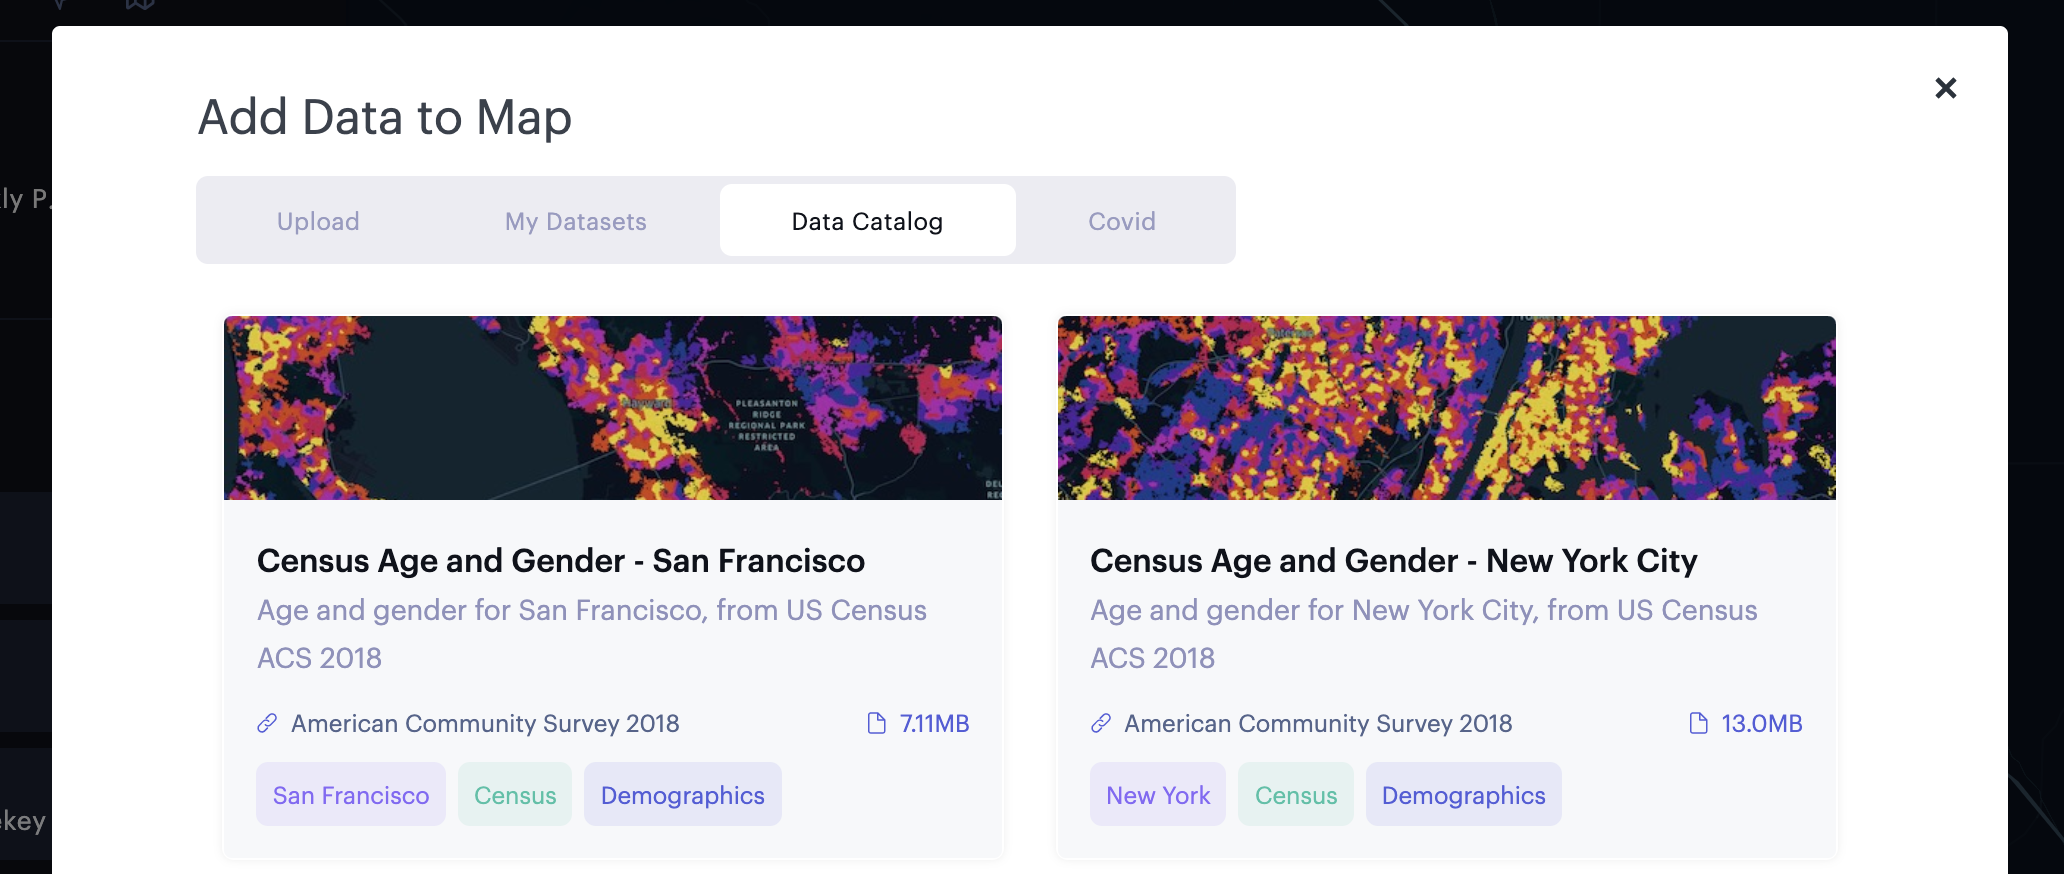
The Studio Data Catalog includes a number of H3-equipped datasets.
H3 Data Sources
There are several ways to get H3 data into Studio.
- Importing H3-encoded data - If you already have datasets with H3 encoded columns, you can import them directly into Studio.
- Converting geospatial positions to H3 indexes - H3 indexes can also be inferred from other more general geospatial columns (such as longitudes and latitudes) by adding custom column expressions.
- Add Hex Tiled Datasets - HexTiled datasets are pre-aggregated using the H3 grid.
Normalizing Data
Note that H3 indexes can represent different resolutions. If you want to perform analytics and your indexes are in different resolutions (either within the same column or in different datasets that you want to join) you may want to create custom columns with H3 indexes in a single resolution.
See below for more on how to use the built-in H3 function library to do this.
Visualizing H3 Data
Several visualization layers in Studio can already accept H3 encoded columns:
- H3 Layers - H3 Layers work on both H3 encoded columns.
- Arc Layers - can use an H3 encoded column as either start or end.
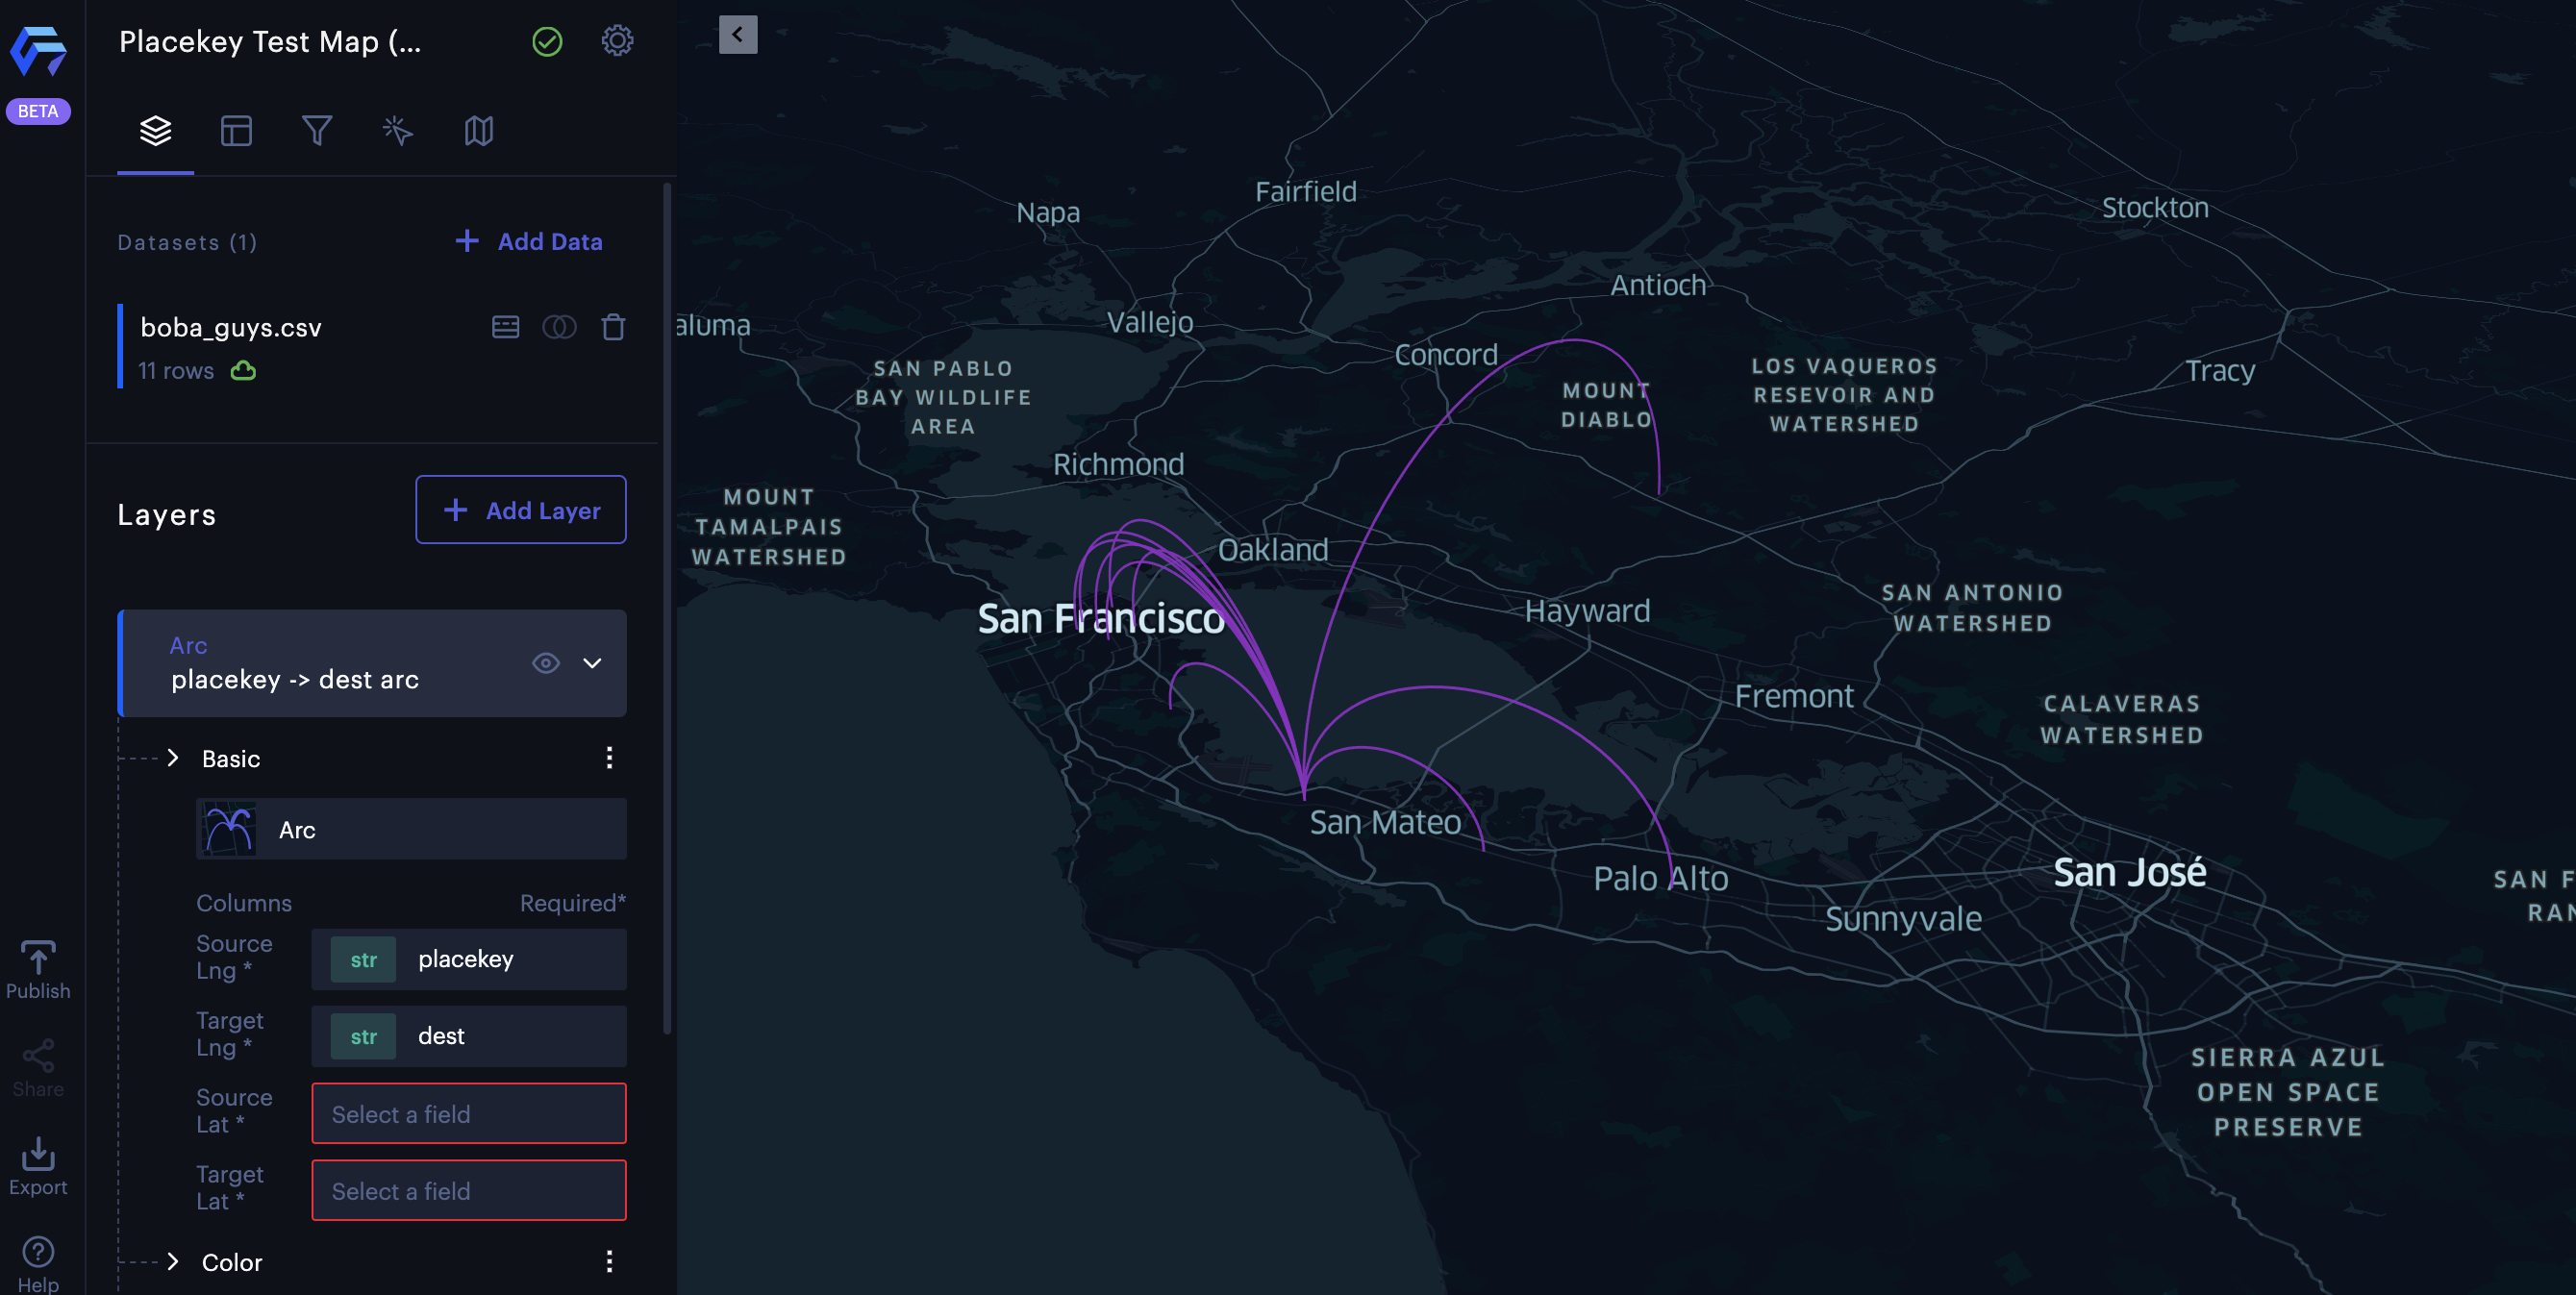
The Arc Layer can accept H3 columns as source and target position.
Handling Overlap
Datasets with H3 identifiers may have overlap (i.e. multiple rows referencing the same hexagon). Note that this may be desired (e.g. in the case of points of interest located in the same hexagon). Simple techniques to identify and work with overlapping cells include:
- Blending - An easy way to assess the extent to which your dataset has overlap is to lower the opacity setting of the generated H3 layer. If multiple rows reference the same hexagon, that hexagon will be shown as darker / more opaque.
- Group By - If your dataset has overlap, it is sometimes appropriate to perform a group-by operation on the H3 column. This creates a new table with one row per unique identifier, combining other columns as desired, and this table can then be visualized to explore the grouped characteristics.
Automatic Column Identification
When new data tables are added, Studio automatically looks for columns containing geospatial information, and identifies any columns containing H3 values.
Automatic Layer Generation
If an H3 column is detected in a dataset, Studio will automatically create one or more layers to visualize the data. This ensures that your data is immediately visible on the map.
Note that to reduce visual clutter, some of the autogenerated layers may initially be marked as hidden so it can be worth checking what layers Studio added (click on the "eye" icon in the layer side panel to show a hidden layer). Undesired auto-generated layers can be hidden or deleted with a single click.
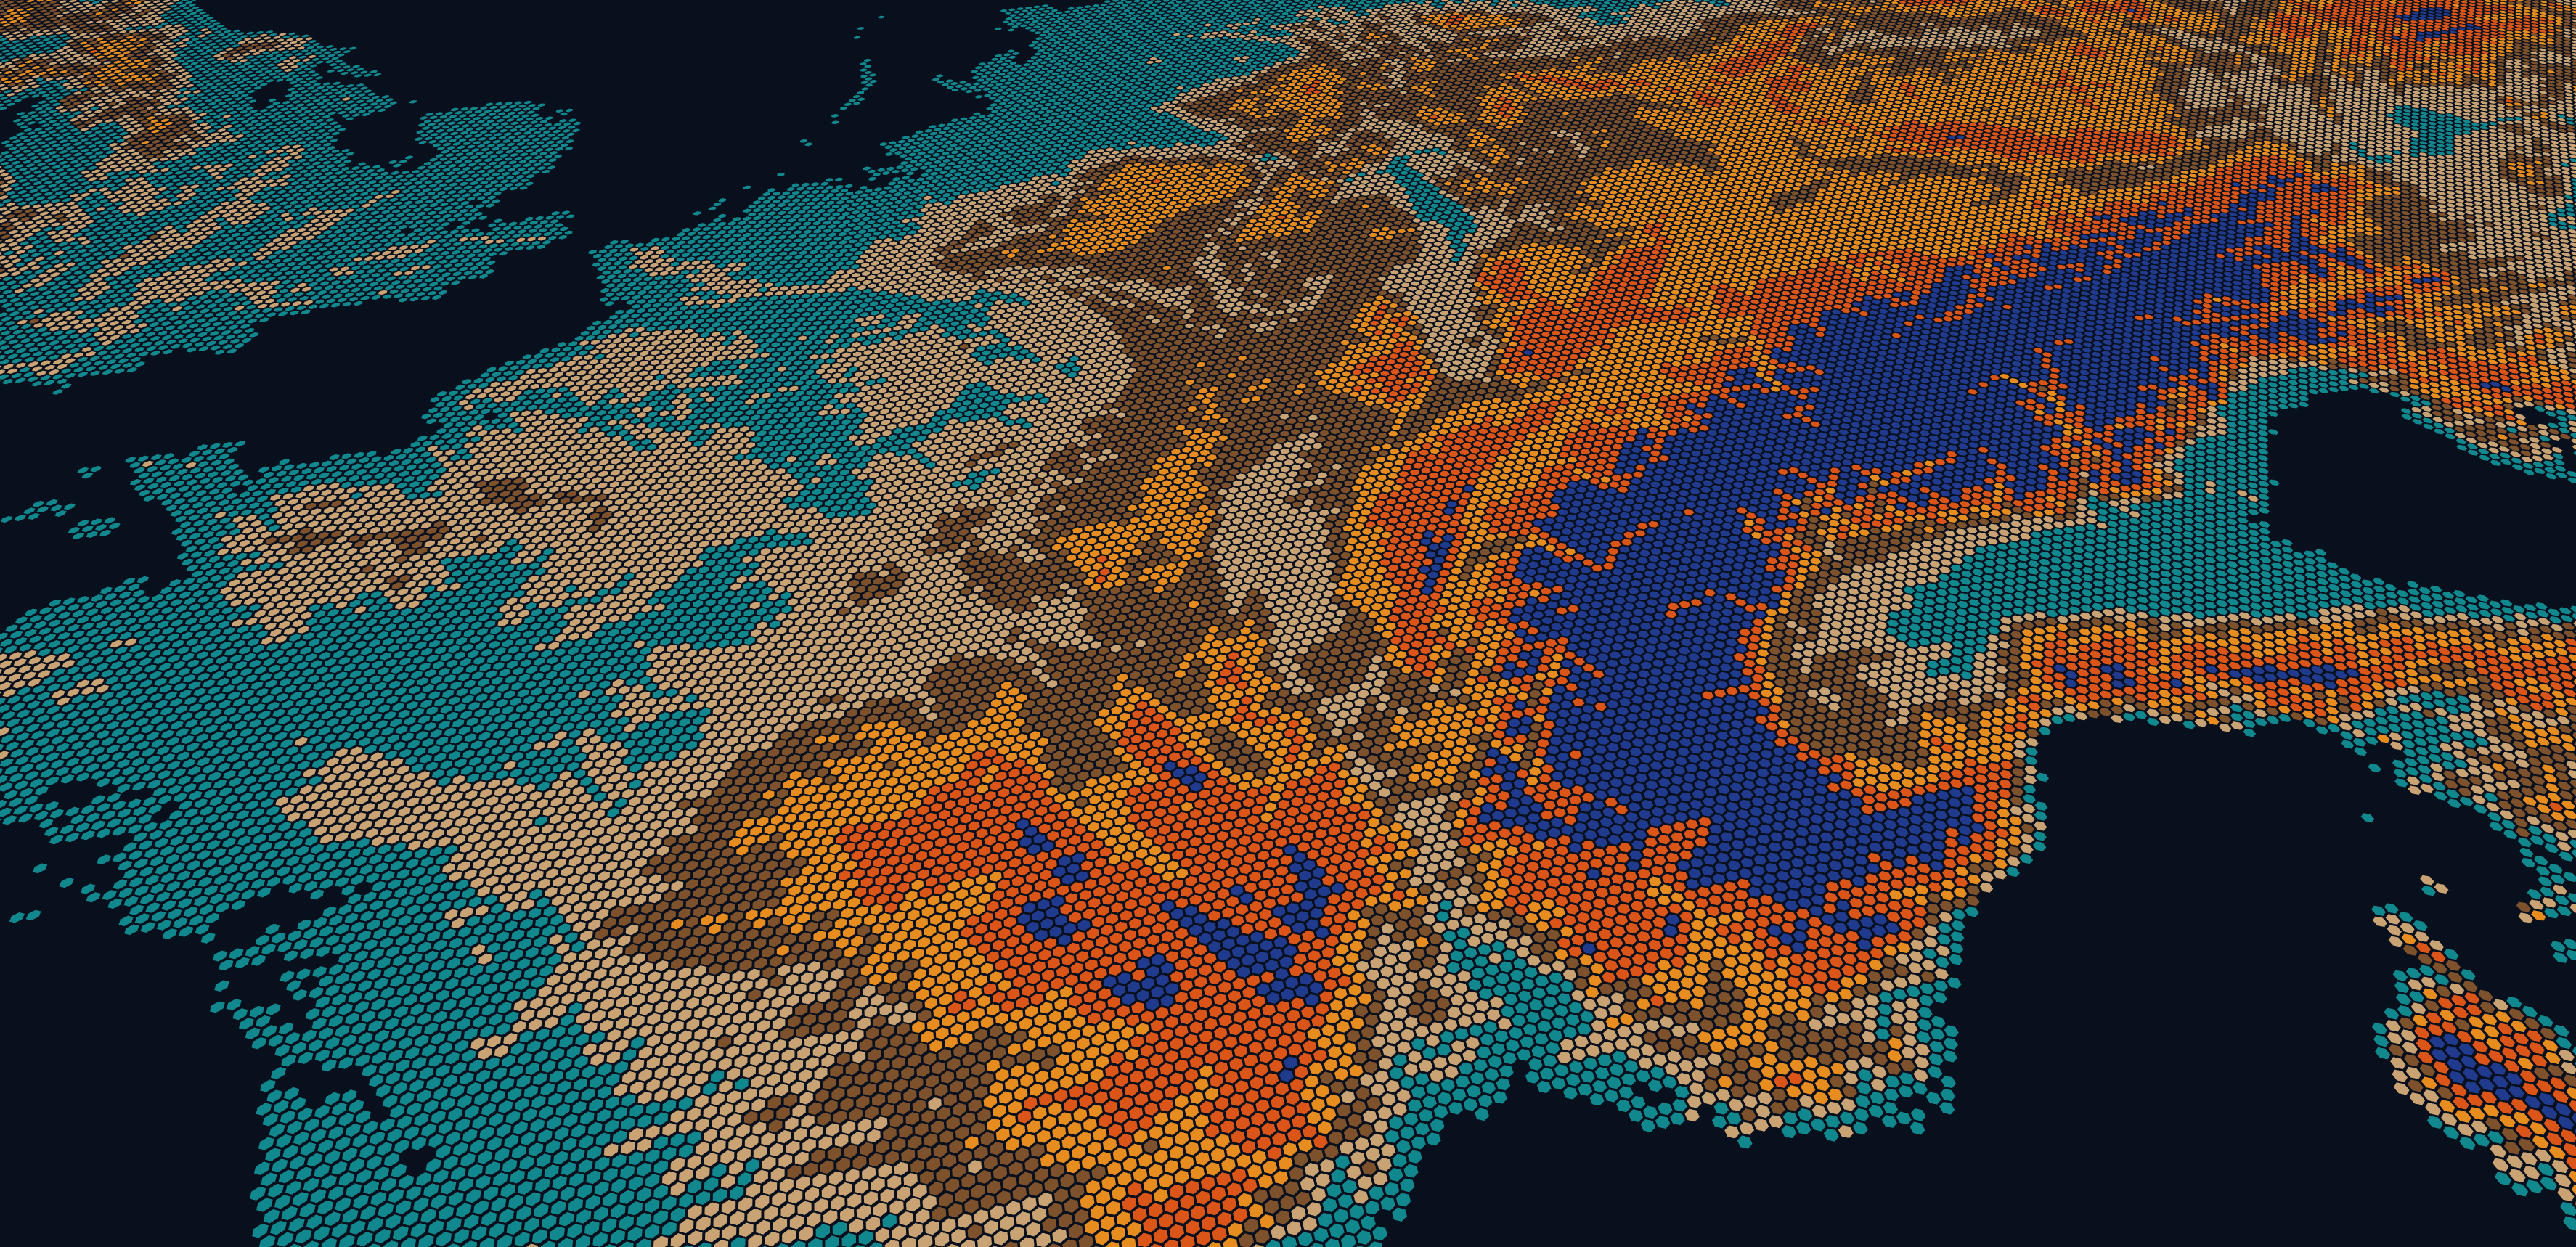
Elevations in Europe quantized into the H3 grid
Working with Custom Expressions
While data ingestion and visual exploration is useful for quick exploration and analytics, Studio supports advanced processing of H3 indexes.
Studio expressions provide direct access to the H3 analytics library.
H3 library functions are available in user-defined expressions when adding custom columns to existing datasets. Custom columns are defined using expressions, and H3 functions can be invoked when defining custom expressions.
Note that expressions are very flexible and composable with other geospatial operations in Studio. Some basic examples of calculations that can be performed include:
- Extract longitudes and latitudes from H3 identifiers (
h3ToLat,h3ToLon) - Calculate distance between cells (
h3Distance) - Truncate to a coarser grid (
h3ToParent)
Once a new column has been defined, it can of course be used in additional operations, including being the key column for join and group by operations. This enables iterative generation of new, refined datasets for further analysis and visualization.
Placekey Support
Placekey is a system for encoding points of interest that incorporates H3 as its spatial identifier. The Studio platform has built-in support for Placekeys.
Accessing H3 and Placekey Data
To work with H3 and Placekey in Studio, your dataset needs to have at least one column containing H3 indexes or Placekeys. This section describes a number of ways to import or create H3 and Placekey columns in Studio.
Note that if you are just getting started, you can use the sample data sets in the Studio.
- Converting Placekeys to H3 indexes - Placekey columns can easily be converted to H3 columns with simple expressions by adding custom columns, which means that importing Placekey-encoded data is also a way to get to H3 encoded data.
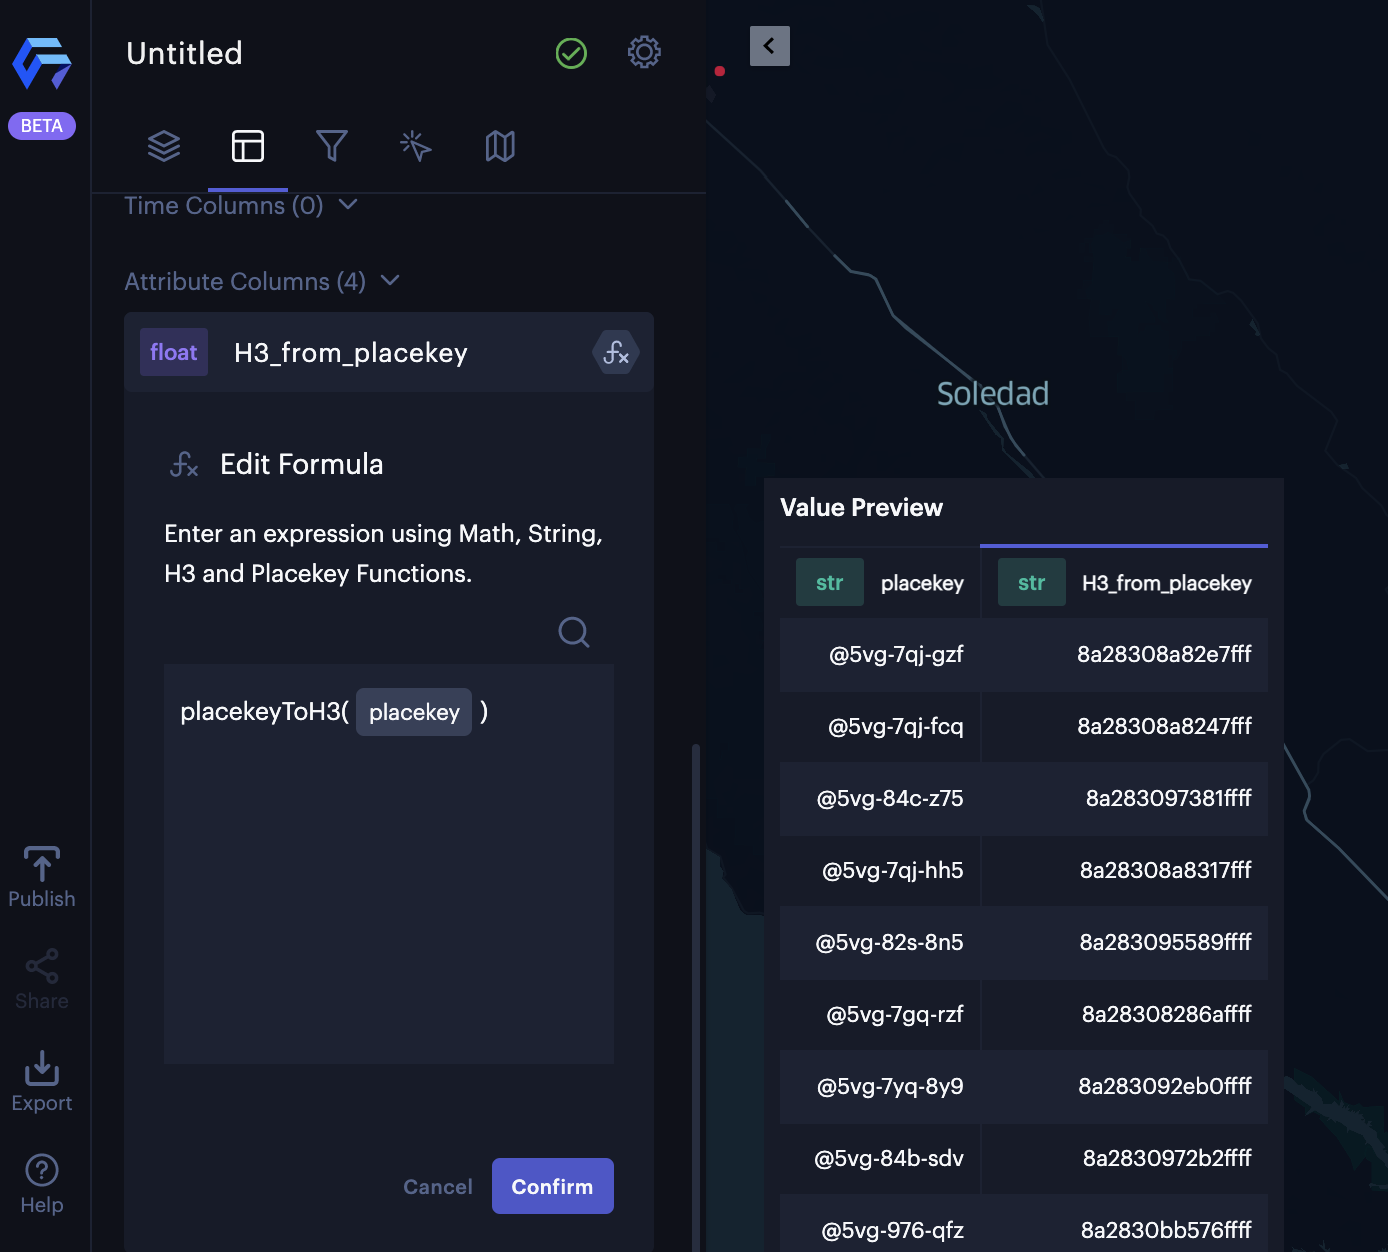
Adding a new H3 column viaplacekeyToH3()
Expressions - Use the Placekey analytics library.
Normalization - keep in mind that Placekeys can consist of just a "where part", representing an H3 hexagon id, or both a where part and a "what part", additionally representing a specific physical point of interest. Both forms are useful, and can be used together. However in some circumstances it can be helpful to be able to drop the what part from a Placekey to facilitate further analytics.
Placekey Data Sources
There are several ways to get Placekey data into Studio.
- Importing Placekey-encoded data - If you do not yet have Placekey encoded data, the Studio Data Catalog has a selection of datasets with Placekey (where-part) columns .
- Converting geospatial positions to Placekeys - Just like H3 indexes, the where parts of Placekeys can be inferred from other geospatial columns. See the section below on adding custom expression columns.
- Converting H3 indexes to Placekeys - Placekey where parts can be inferred from H3 indexes. This is supported by adding custom expression columns, see below.
- Converting Physical Addresses to Placekeys - Please note that Studio does not currently provide built-in support for converting between "address columns" and Placekey columns. If required, this step needs to be done separately using the Placekey REST APIs, before importing your data into Studio.
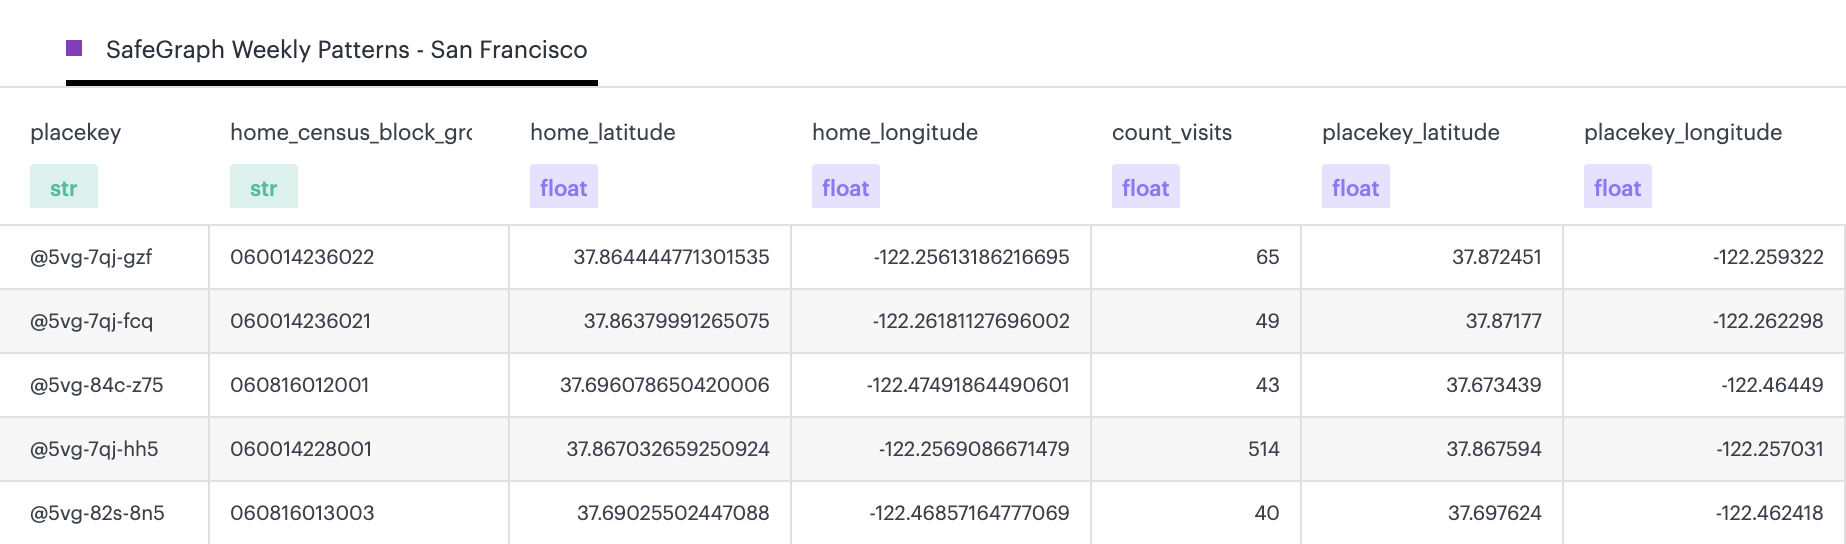
A Placekey where column in the Safegraph Weekly Patterns dataset.
Examples
True Geospatial Joins
Using a combination of the power of the H3 grid system and all the analytic tools available in Studio, it becomes possible to perform true "geospatial joins", meaning joins performed on two tables by relating geospatial keys that describe geospatial locations in different ways.
This simple example assumes the user has two "heterogeneous" datasets, one table with a Placekey column, and one table with longitude and latitude columns.
The Placekeys in the first dataset can easily be converted to H3 indexes by adding a custom column to that dataset. Note that this operation also drops any what part from the placekeys, simplifying the subsequent join.
Assuming the Placekey-valued column is called placekey:
placekeyToH3(placekey);
With the H3 and Placekey function libraries it is possible to generate an H3 or Placekey column from other geospatial datasets, e.g. from longitude and latitude columns. This ability to add H3 index compatible columns to non-H3 datasets enables a wide variety of geospatial unification operations.
Thus, the latitude and longitudes in the second dataset can be also converted to H3 indexes. Note that to match the Placekey-generated H3 indexes, the long/lat-derived H3 indexes should also be generated at resolution 10. A new custom column with the geoToH3() function. Assuming the columns are called lat and lng:
geoToH3(lat, lng, 10);
Both tables now have H3 columns, making it possible to join the two tables via the H3 key.
Note that after the conversions in the previous steps, both datasets could have multiple rows with the same H3 indexes. Running a group-by operation on both datasets will ensure that each dataset has only one unique row.
A geospatial join can now be performed using the generic tabular join operation provided by the columnar user interface in Studio.
Updated 3 months ago