
Create Map
All visualizations in Studio begin with a new map.
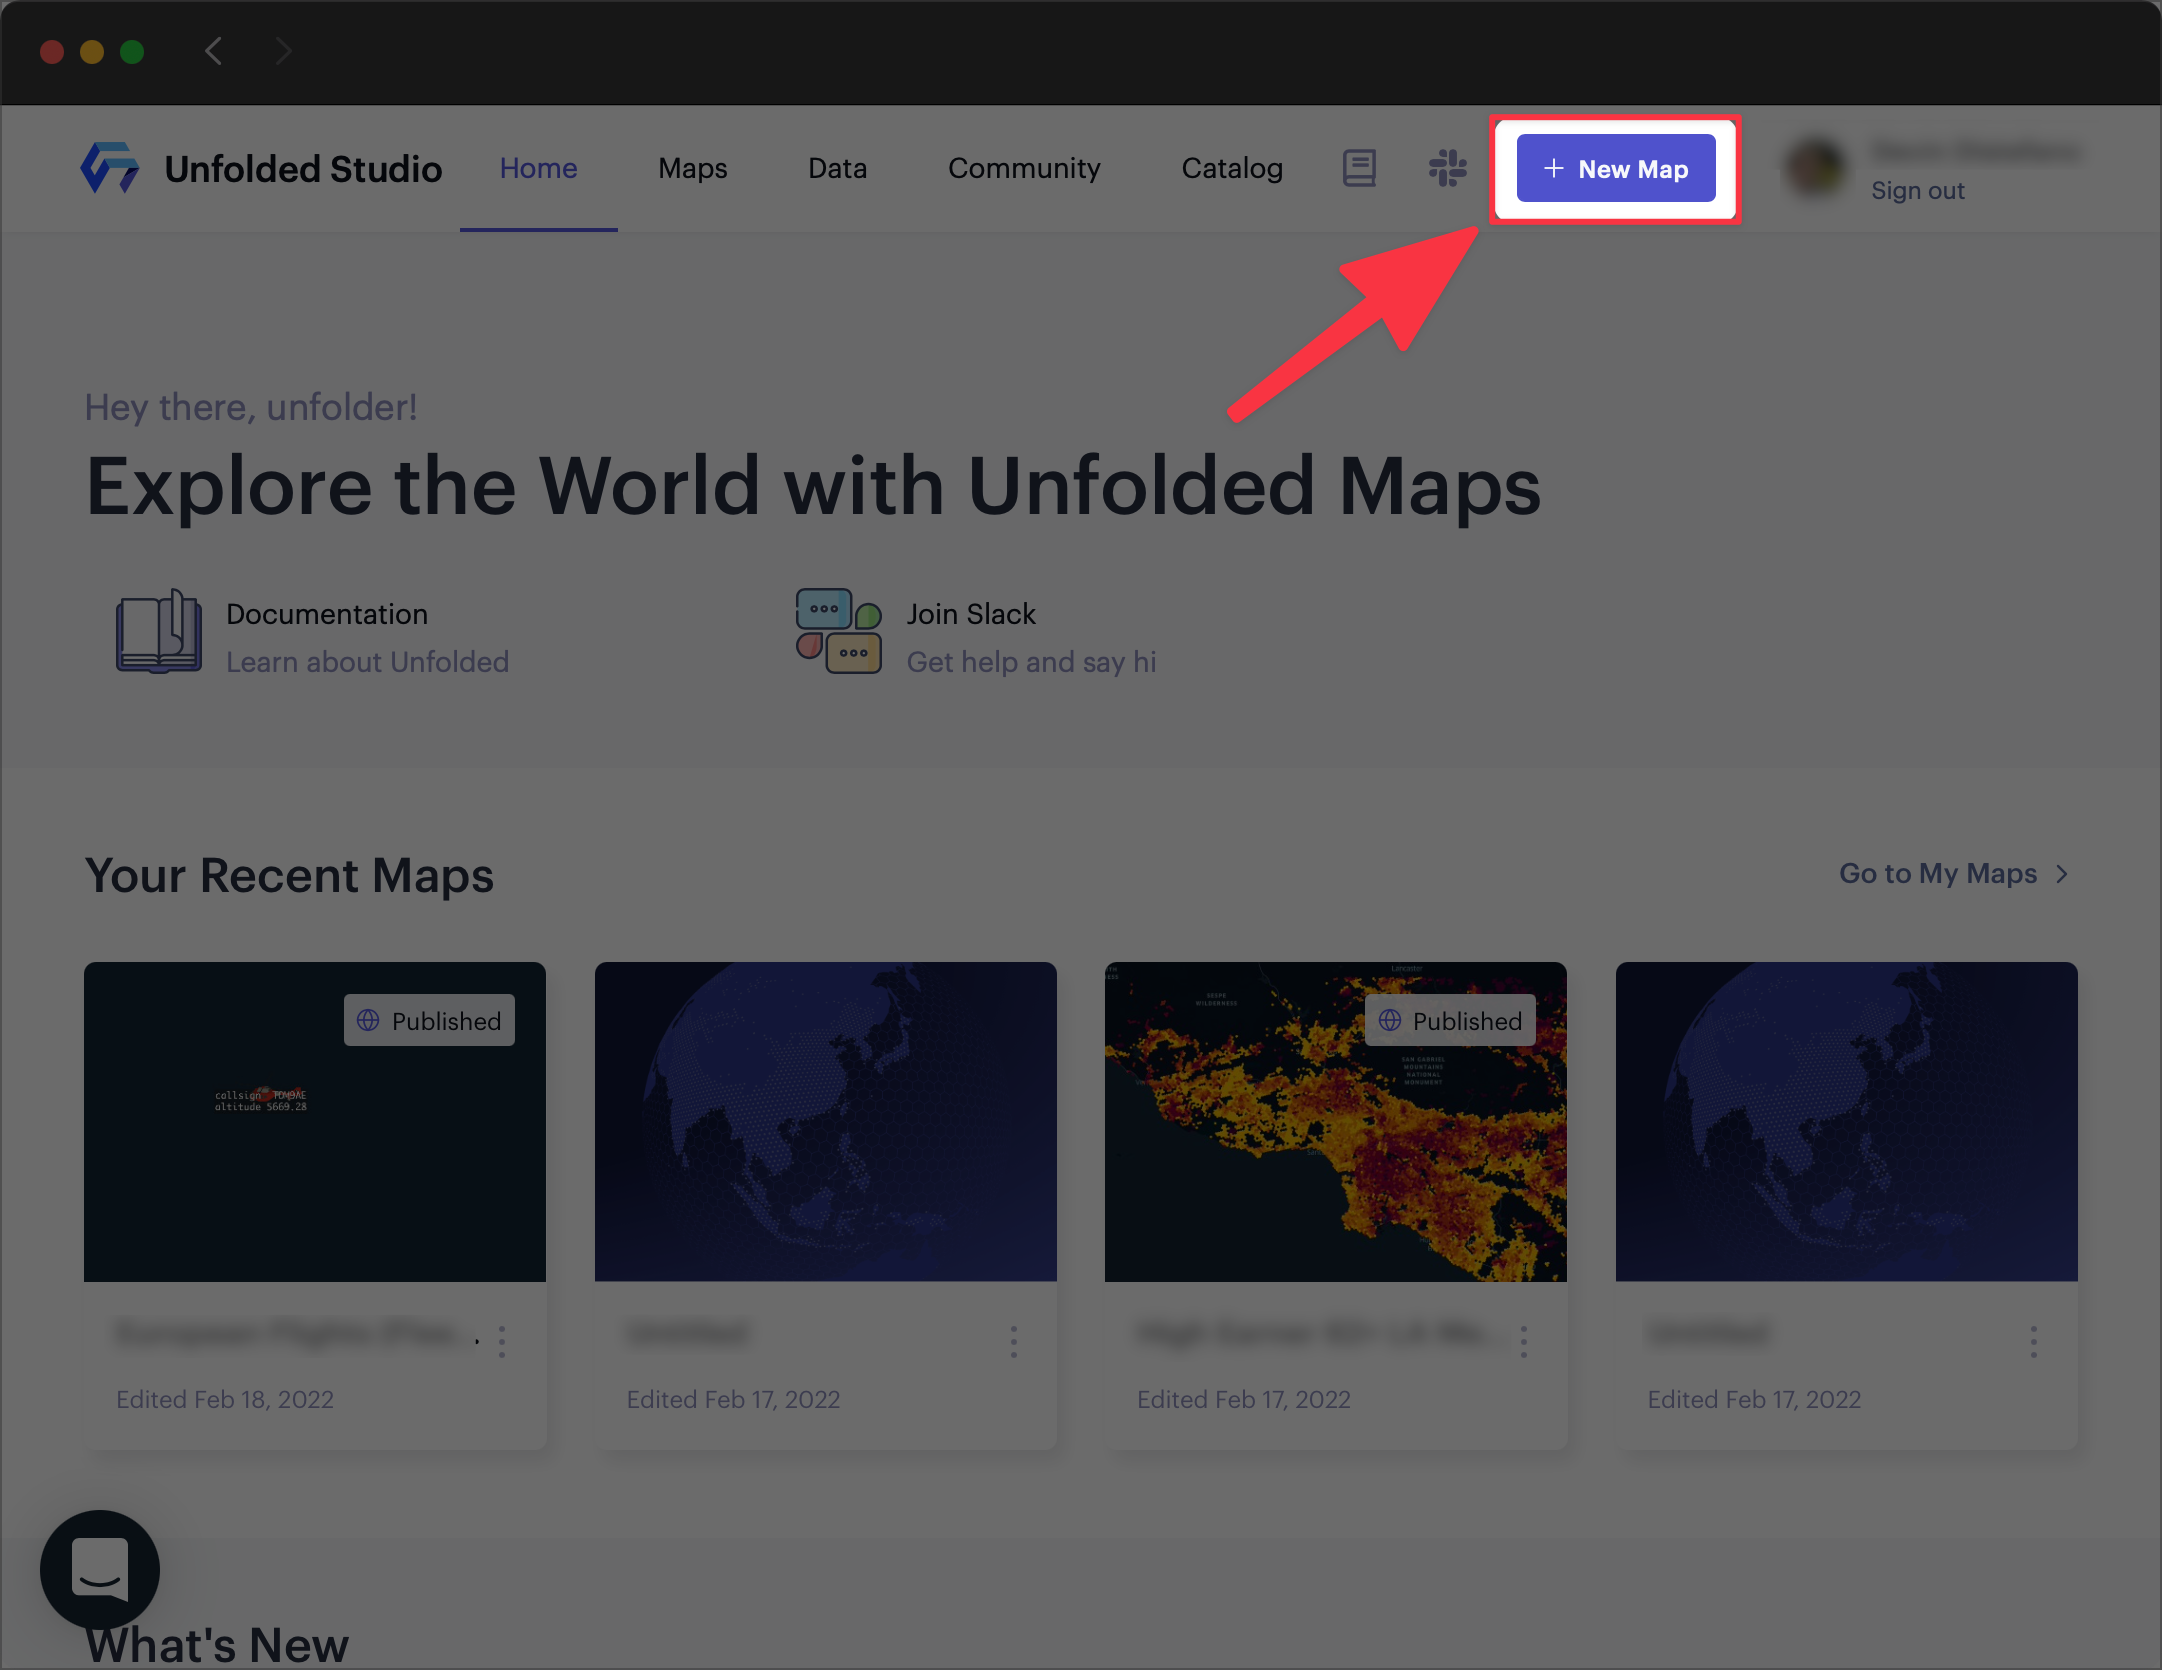
The New Map button on the Studio Dashboard.
Click the Add New Map button or go directly to https://studio.foursquare.com/new to create a new map.
Add Data
Upon creating a new map, the Add Data to Map window appears. To reopen this window, click the Add Data button on the sidebar in Studio.
This window contains several tabs, each containing a different way of importing data into your map:
1. Upload tab
In the Upload tab, you can import any dataset from your local computer, or enter a URL pointing to your dataset. Learn more about importing data into Studio.
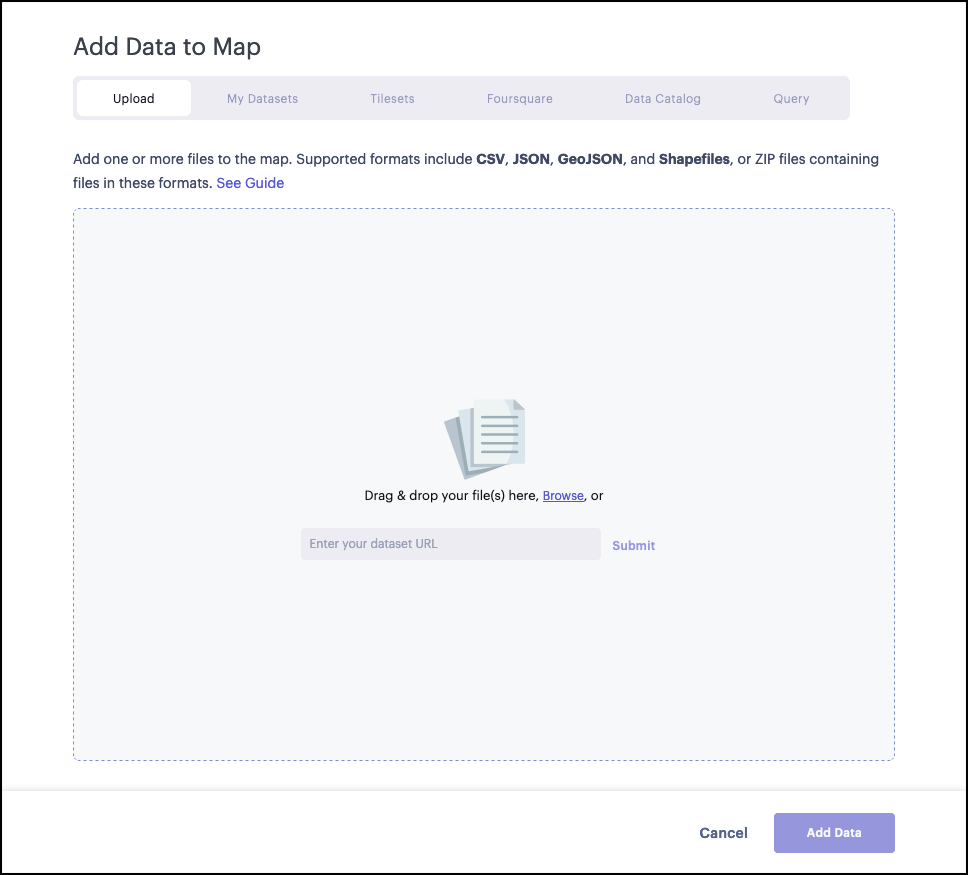
The Upload tab in the Add Data to Map window.
2. My Datasets tab
In the My Datasets tab, you can select any dataset saved to your Studio account. You can manage your datasets in the Data tab on the dashboard.
Whenever you upload a new dataset to Studio, it will appear in the My Datasets tab unless you delete it.
3. Tilesets tab
In the Tilesets tab, you can import tiled datasets. Tiled datasets (or tilesets) contain image files that represent real-world phenomena on your map. Studio can display:
- Raster tiles, which contain pixel-based imagery stored in a grid structure.
- Vector tiles, which contain vector-based imagery such as points, lines, and polygons.
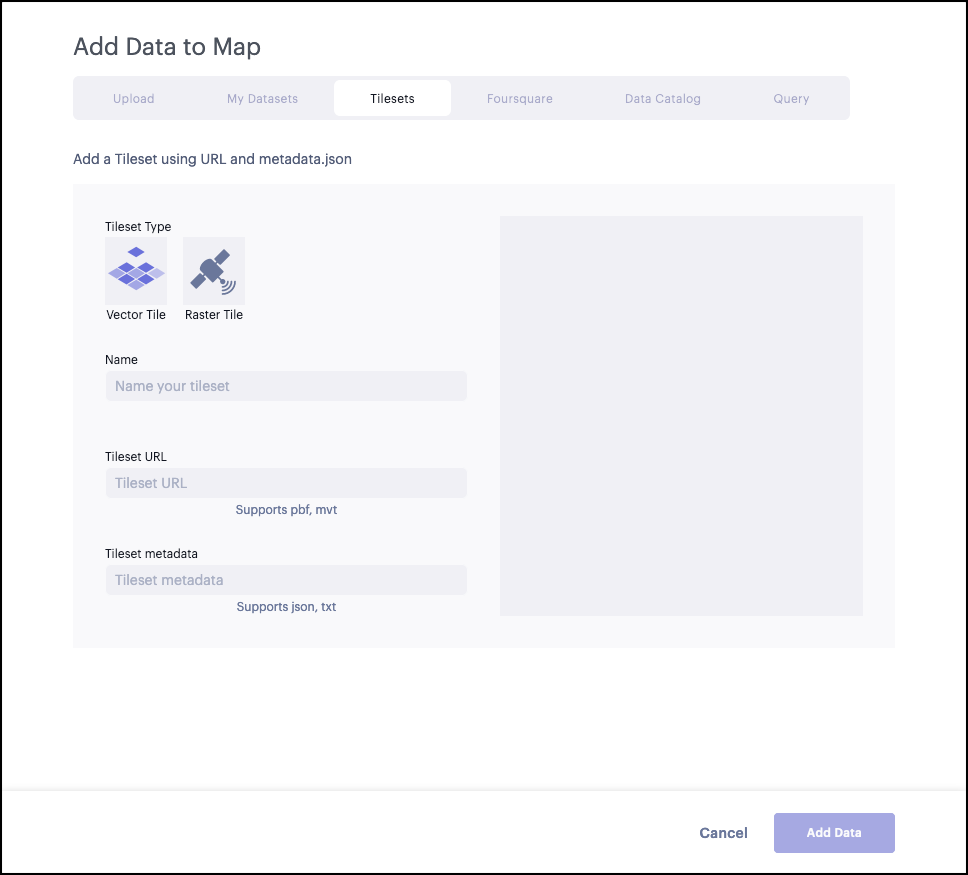
The Tilesets tab in the Add Data to Map window.
4. Organization tab
In the organization tab (available for Enterprise users), you may select any dataset shared by your team members.
5. Data Catalog tab
The Data Catalog tab contains a growing collection of curated datasets provided by Foursquare and our partners. These datasets are diverse, separated into categories such as demographics, elevation, and remote sensing.
6. Query tab
The Query tab allows you to access datasets via connectors such as BigQuery, Snowflake, Athena, and Planet NICFI.
Note:
Adding an excessive number of datasets may cause increased loading times in Studio.
Visualize a Dataset in your Map
Upon loading a dataset, Studio will attempt to automatically generate a layer visualizing your dataset. The below example shows how Studio parsed a CSV file containing California earthquake data.
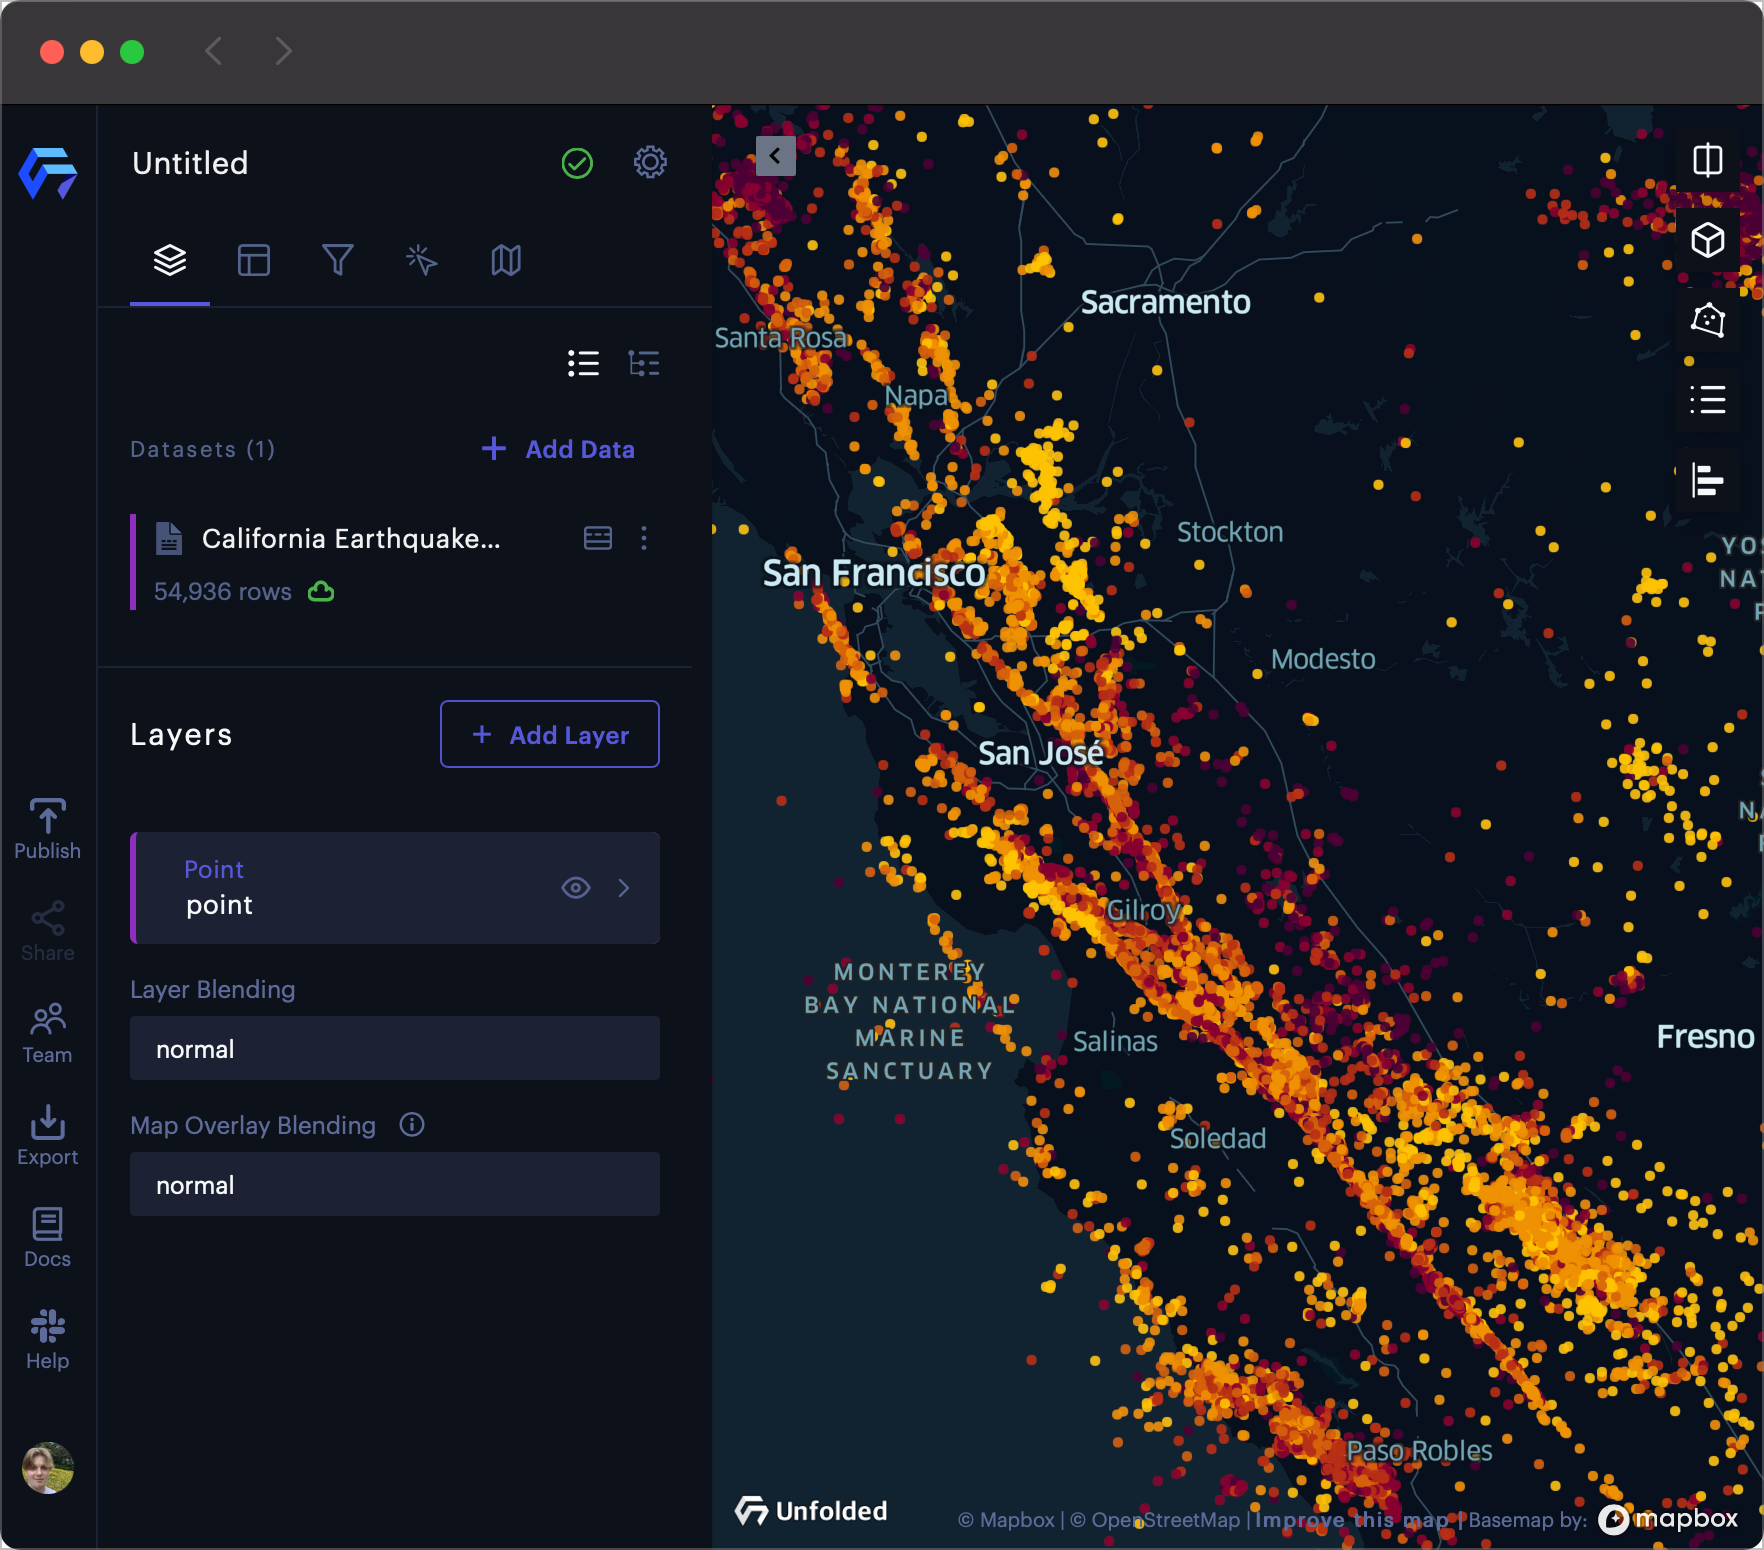
Earthquake data automatically visualized in Studio.
Create a Map via SDK
You may also create a map via the Map SDK. Visit the Map SDK reference to learn more.
Updated 3 months ago