
Extract from Hex Tiles
While Hex Tiles represent data at a global scale, you can easily select, extract, and analyze a specific area of interest at any level of granularity.
Select an Area to Extract
1. On a Hex Tile map, pan and zoom to an area of interest.
2. Click the Draw on Map button, then create a polygon or rectangle representing a region you want to extract.
Using the Draw on Map tool to outline a polygon for extract.
3. Change to the Select option, then right-click the region and select Extract Data.
4. The Extract Dataset sidebar will appear. Confirm the layer and attribute columns you wish to extract.
Click Confirm to proceed to the Extract Dataset window.
5. Confirm that the selected dataset is correct, then name your extracted dataset.
Click Confirm to complete the extract. The extracted dataset will now appear in Studio as a new local dataset.
Analyzing Extracted Data
After you extract your dataset from Hex Tiles, you can analyze it as you would a normal dataset. In the following steps, we will analyze our extracted dataset.
In this example, we want to discover which areas of this region have a large percentage of high-income individuals.
1. Navigate to the Columns tab, then select Add Column on the extracted dataset.
2. In the Edit Formula window, create a formula using columns from the extracted dataset, then select Create Column.
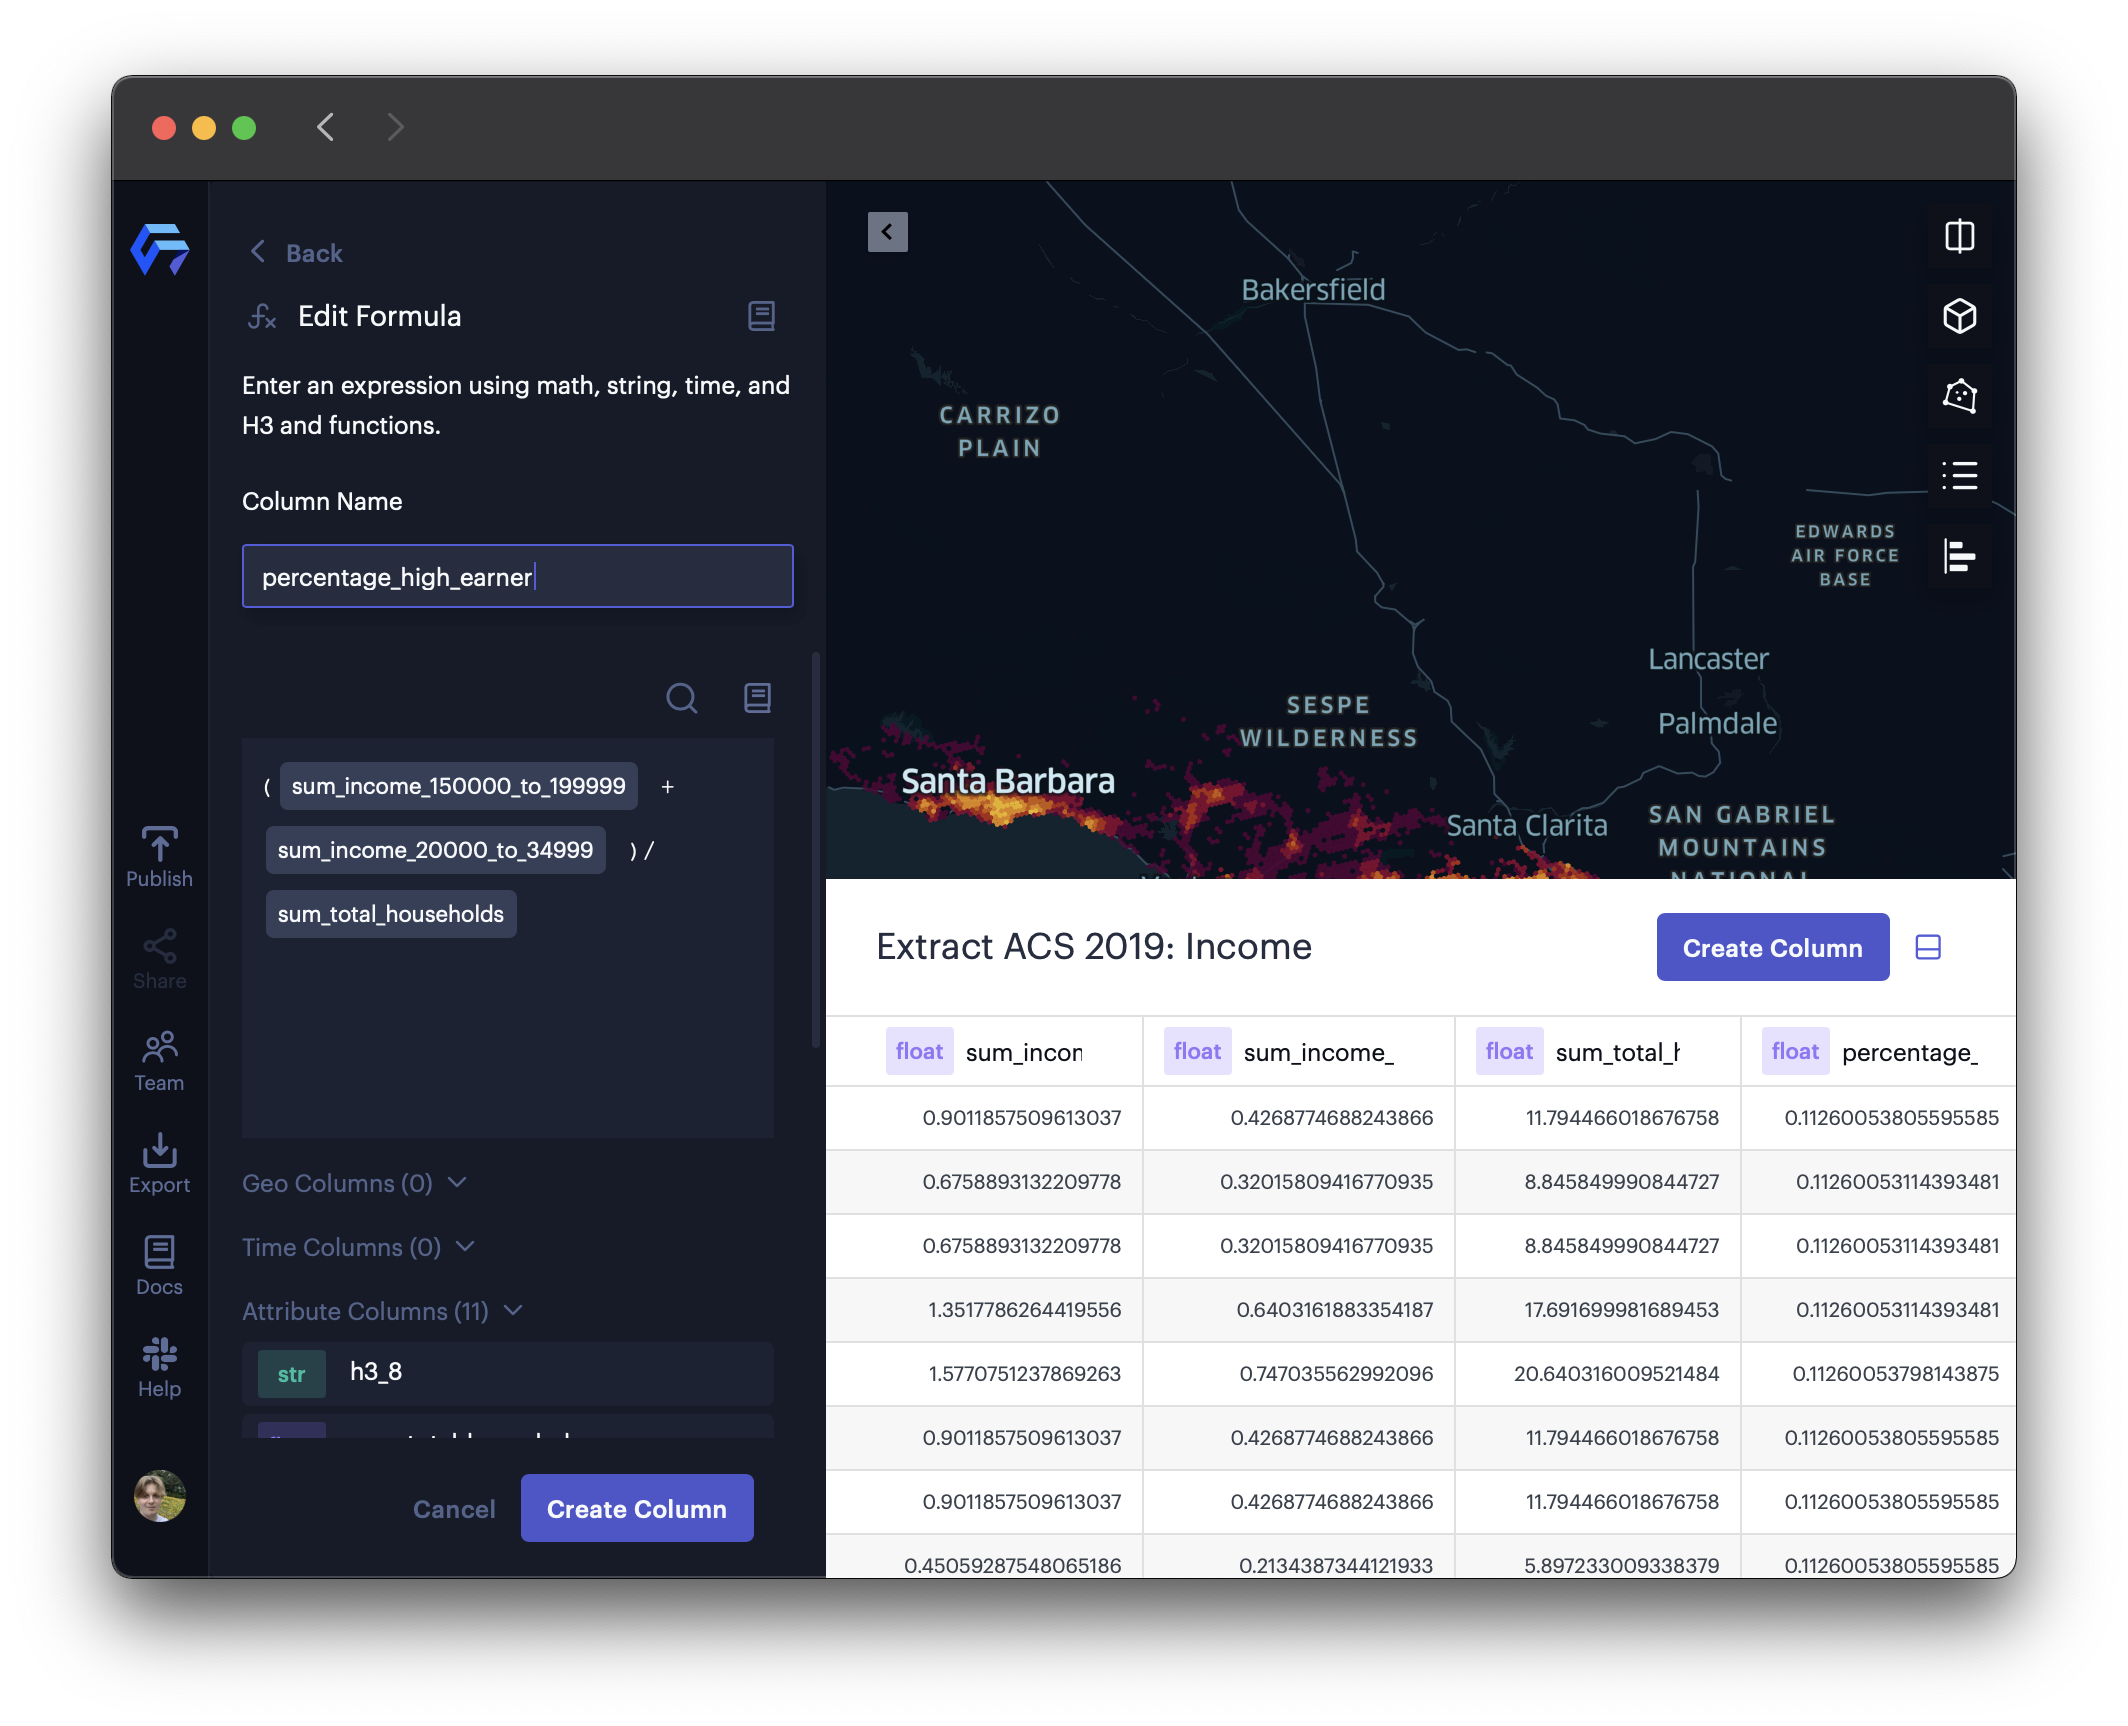
Creating a formula to represent the high-income percentage of the population.
When you extracted a region from your Hex Tile map, you extracted all its data columns as well. Use these columns to generate formulas that expose geospatial information.
In this example, the new percentage_high_earner column is generated with the expression:
(sum_income_150000_to_199999 + sum_income_200000_or_more)/sum_total_households.
3. Navigate to the Layers tab, then configure your layer to represent your new column.
Visualizing the new column to explore neighborhoods by high-income percentage.
4. (Optional) Click Export >> Export Data to export your extracted dataset.

Exporting the extracted dataset.
Video Tutorial
Watch the video below to learn how to extract data from Hex Tiles.
Updated 4 months ago