
Create Hex Tiles
You can transform geospatial datasets into Hex Tiles through Studio's dashboard.
Prerequisites
Hex Tiles are aggregated by bucketing data into H3 cells. To be transformed into Hex Tiles, your dataset must be uploaded to Studio and contain either:
- A column containing H3 indexes or
- Latitude and longitude columns.
Hex Tile Creation Guide
Follow the steps below to create Hex Tiles from your dataset:
1. Navigate to the Data tab in Studio.
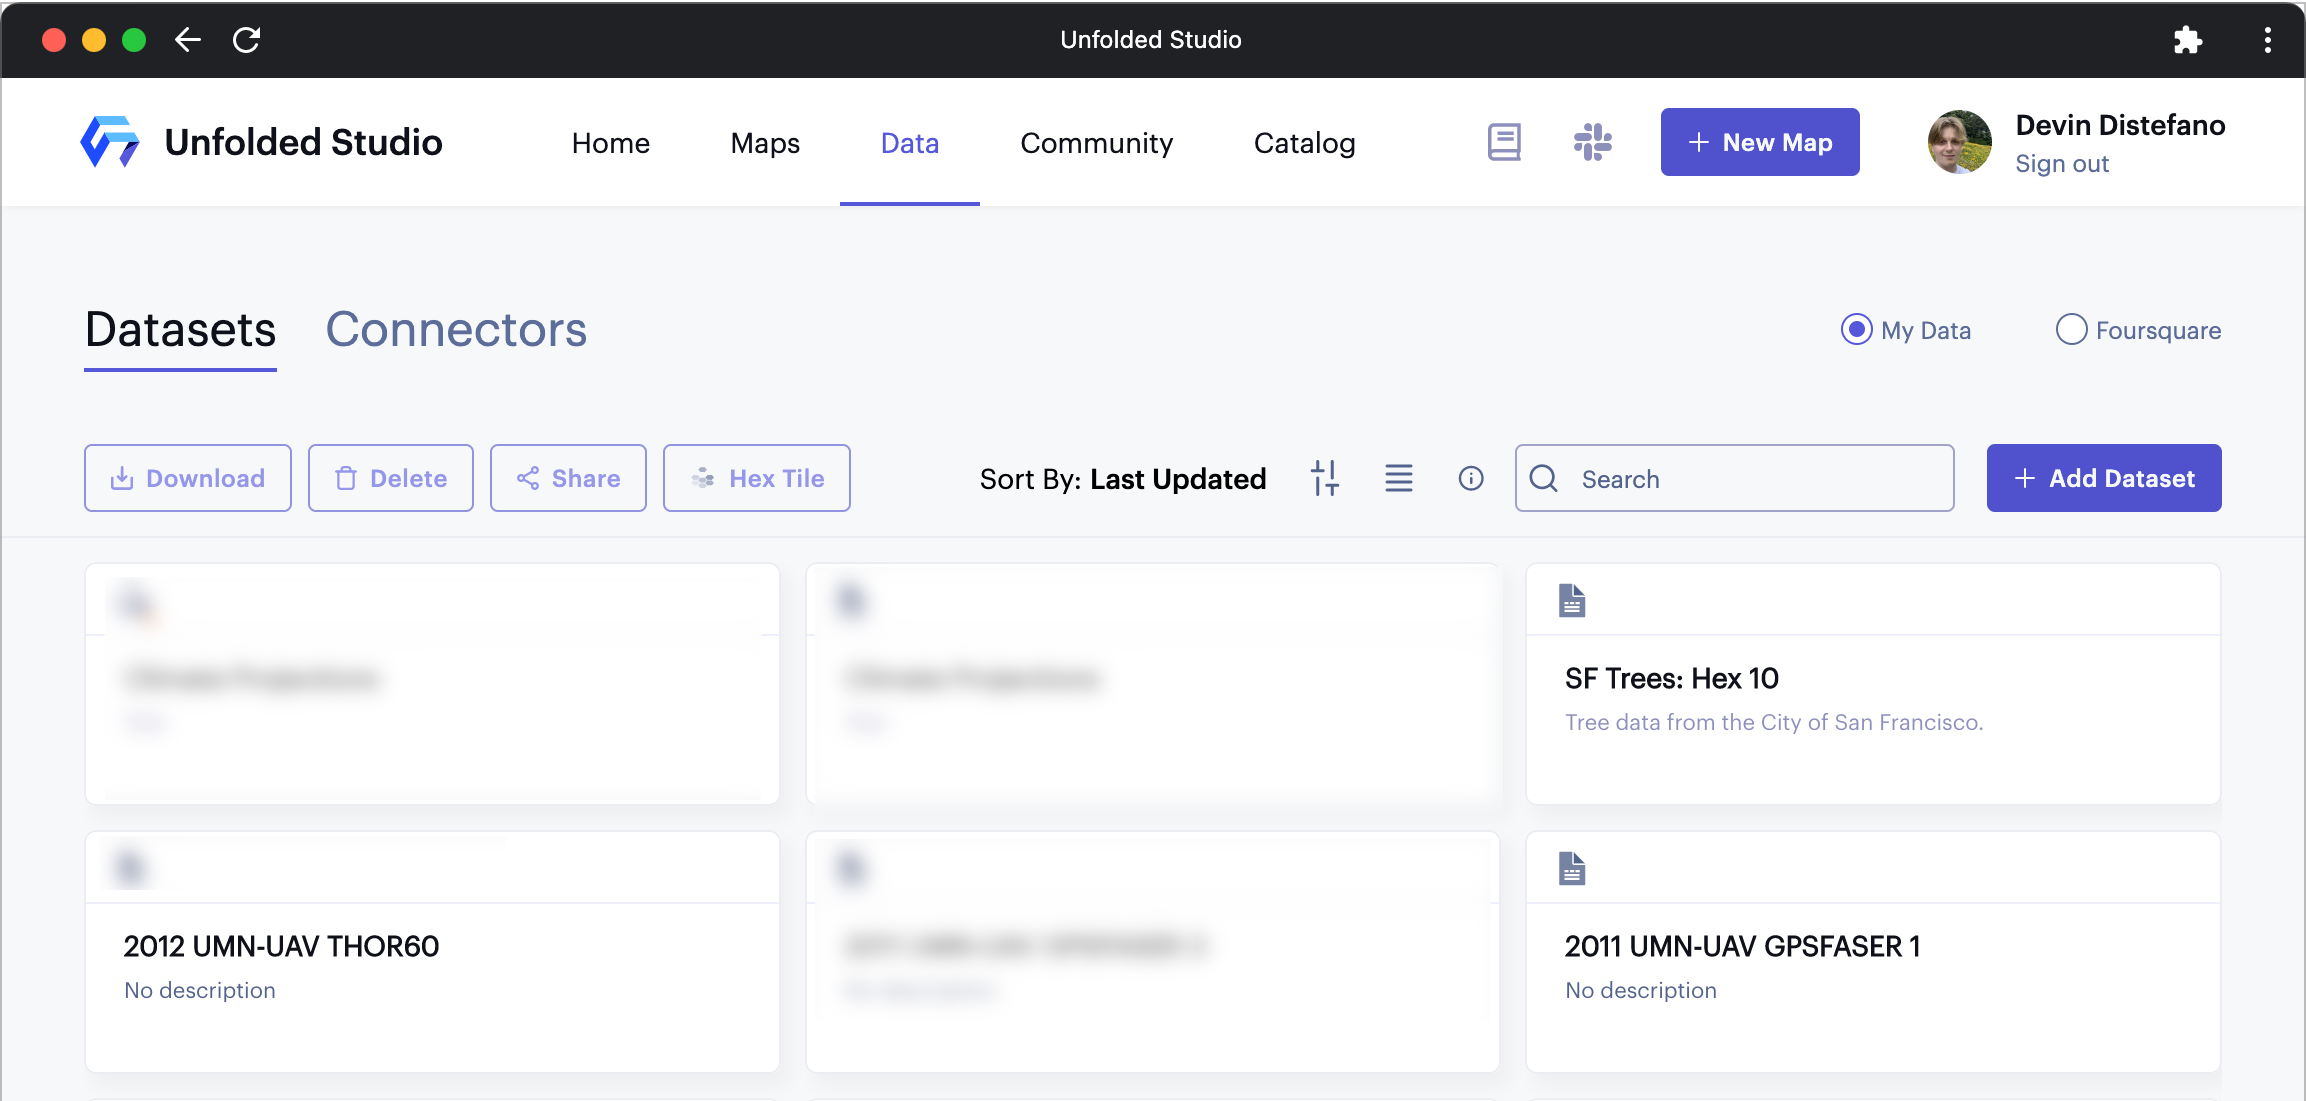
The Data tab in Studio.
2. Select your source dataset, then click Hex Tile.
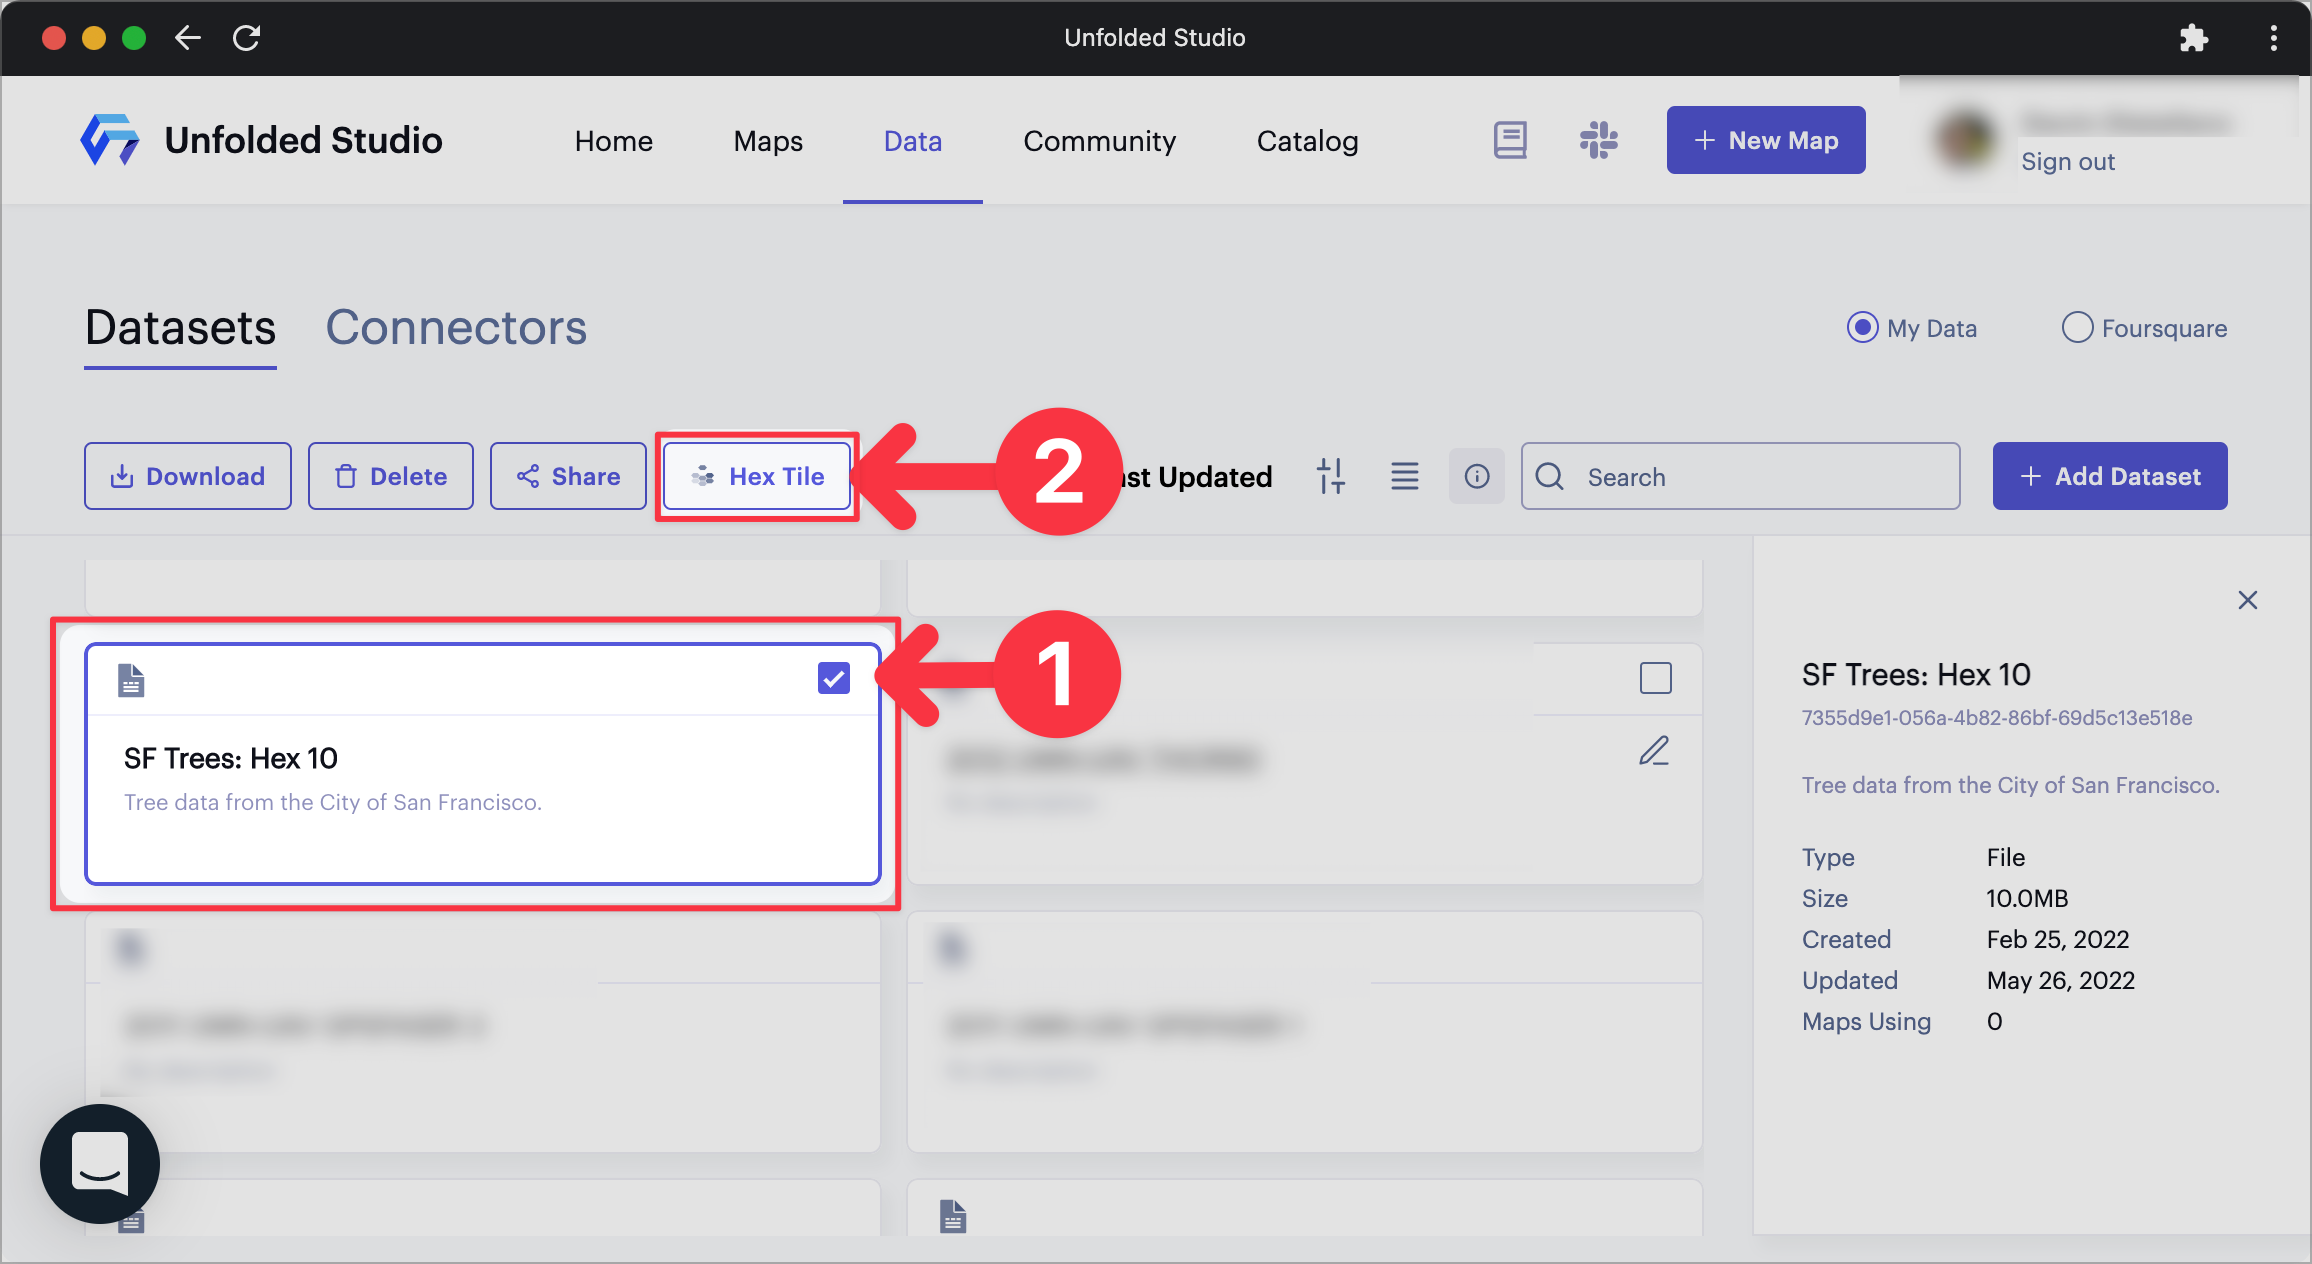
Selecting the "SF Trees: Hex 10" dataset to be transformed into Hex Tile.
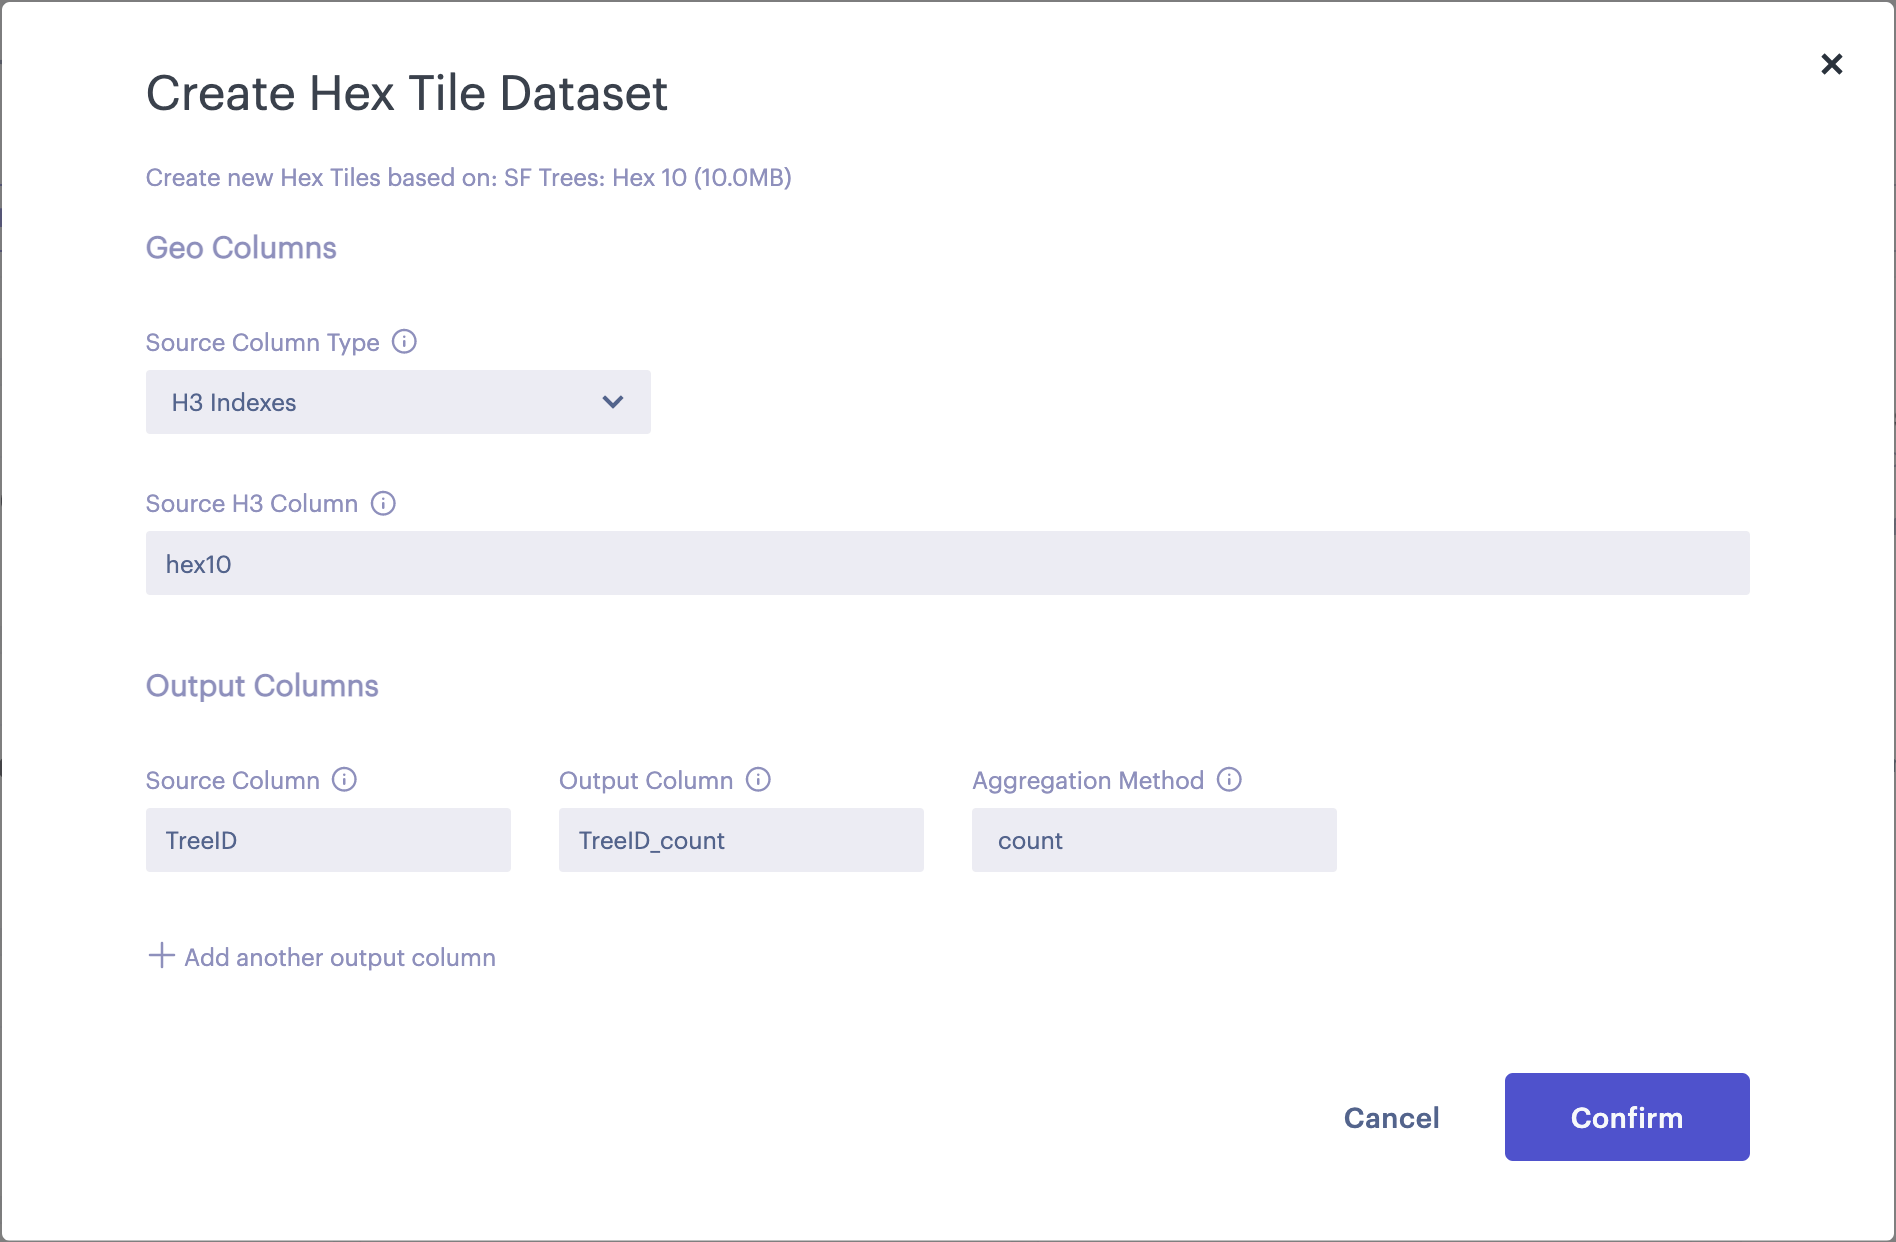
3. Fill all fields in the Create Hex Tile Dataset window.
The Create Hex Tile Dataset window appears.
In the Geo Columns section, specify a column containing H3 indexes or columns containing latitude/longitude data from your dataset. Studio needs this information to bucket aggregated data into new H3 cells.
| Field | Description |
|---|---|
| Source Column Type | Select either H3 Indexes or Latitude / Longitude. |
| (H3) Source H3 Column | Name of the column containing H3 indexes. |
| (Lat / Long) Source Latitude Column | Name of the source column containing latitude data. |
| (Lat / Long) Source Longitude Column | Name of the source column containing longitude data. |
| (Lat / Long) Finest Resolution | The finest H3 resolution to use when aggregating points. This determines the smallest hexagon size available in your tileset. |
In the output columns section, you must specify at least one source column and output column to be used during aggregation. You may add additional output columns.
| Field | Description |
|---|---|
| Source Column | Name of the source column to use aggregation. |
| Output Column | Name of the column to include for the aggregation's output. |
| Aggregation Method | Aggregation method to apply to the source column within each H3 cell. Options include sum, count, min, max, mean, median, and mode. |
The below example uses a .csv dataset containing San Francisco tree data.
Selecting the "SF Trees: Hex 10" dataset to be transformed into Hex Tile.
In the Geo Columns section, we use a source H3 column called hex10.
In the Output Columns section, we use a source column called TreeID, which contains unique IDs assigned to each tree. Then, we name the Output Column TreeID_count and select count for the aggregation method. The new output column will contain the number of trees in the H3 cell.
4. Click Confirm, then wait while your Hex Tiles process.
Wait until the tiling process is complete to use your Hex Tiles dataset. The tiling process will take at least a few minutes to complete, with larger datasets requiring additional time.
Check the status of your Hex Tiles by observing the indicator icon above your new dataset.
| Indicator Icon | Description |
|---|---|
 | The tiling process is still running. |
 | The tiling process is complete and the Hex Tiles can be used. |
 | The tiling process failed. Select the dataset to view the error message. |
Using Hex Tiles
On the Visualize guide, you can learn how to visually explore your new Hex Tile dataset in Studio.
Once you have finished exploring a Hex Tile dataset, try out some advanced Hex Tile features available on the Platform.
Enrich
Enrich a file-based dataset by joining it with a Hex Tile dataset.
Visit the Enrich documentation to learn how to enrich datasets within Studio, or check out the Data SDK reference to learn how to enrich datasets via the SDK.
Join
You can combine Hex Tile datasets with the join operation.
Visit the Hex Tiles Join documentation to learn how to merge Hex Tile datasets through a join operation.
Extract
While Hex Tiles represent data at a global scale, you can easily select, extract, and analyze a specific area of interest at any level of granularity.
Visit the Extract documentation to learn how to extract areas from Hex Tiles in Studio.
Data SDK Reference
Refer to the Data SDK reference to learn how to create Hex Tiles through the SDK.
Updated 4 months ago