How Can Data Visualization Help in Decision-Making?
Modern tools and technologies like machine learning models and artificial intelligence software have forever changed how business leaders make decisions. One of the most effective solutions implemented to enhance decision-making capabilities is a process known as “data visualization.”How Data Visualization Transforms Location Analytics
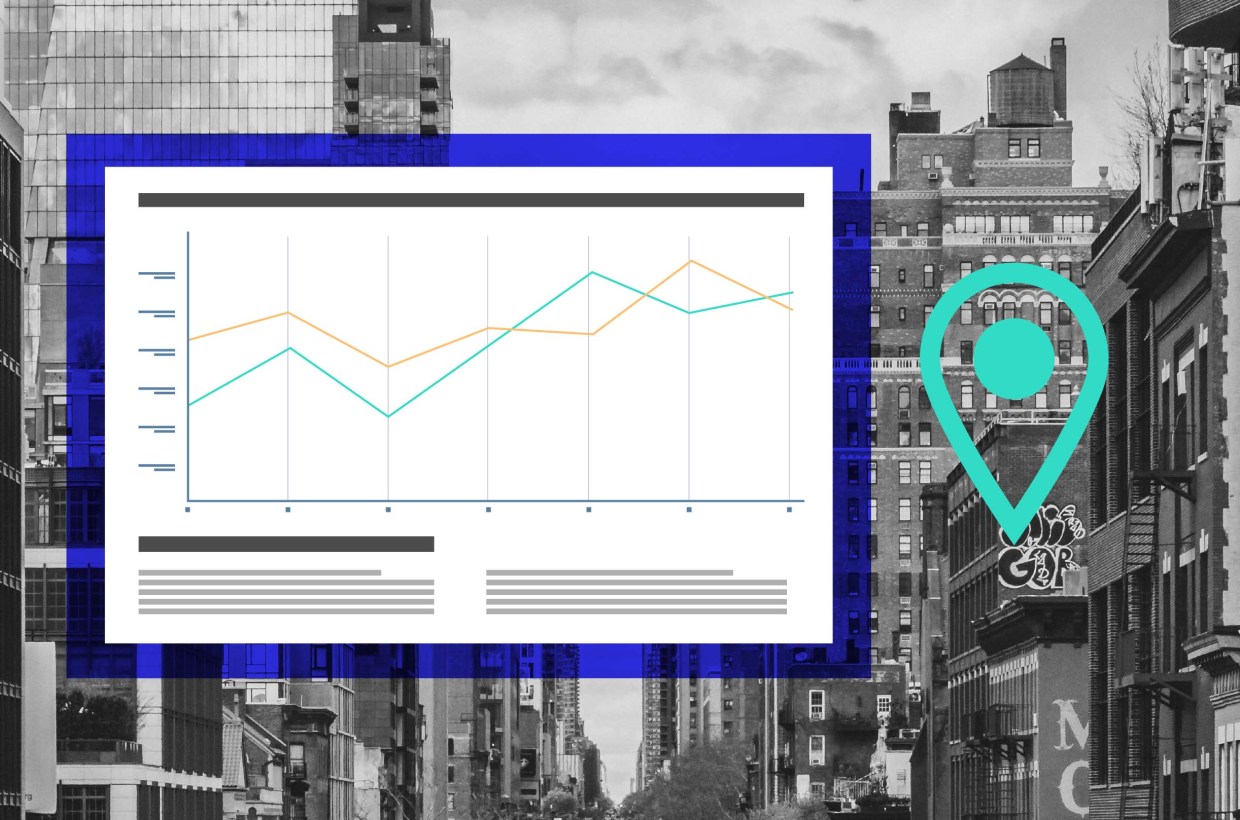
Broadly speaking, location data visualization involves transforming information into a graphical representation, such as charts, graphs, and diagrams.
How can location data visualization help in decision-making? This post will discuss how to improve data visualization by strategically investing in modern analytics and reporting solutions.
Benefits of Using Geospatial Data in Analytics
To effectively visualize data, you need to gather high-quality data.
What sort of data should you use in the visualization process? While many location data visualization efforts center around marketing information (i.e. site traffic) and sales figures (i.e. average ticket size), it’s also critical to leverage geospatial data in this type of analytics.
Geospatial data describes events, behavioral trends, or objects as they relate to specific locations. For instance, the amount of foot traffic a mall has seen over the last month is a type of geospatial data.
Geospatial data sets can be massive, making them difficult to interpret using traditional practices. However, advanced analytics tools and visualization software enable you to make better use of this data and unlock notable benefits.
Specifically, you can use geospatial data in analytics to:
Identify Trends and Patterns
Consumers can be unpredictable, to say the least. However, it’s possible to identify and adapt to consumer trends and patterns, provided you have accurate data.
While some insights can be derived using data like buying habits and where people go in the world, other connections won’t be revealed unless positional data is used. Knowing when or where something occurred, such as a purchase, can more effectively uncover the “why.”
Segment Audiences More Effectively
Geospatial data adds another layer to the segmentation process – it enables you to filter out consumers based on their physical location. This detailed analysis can be used to deliver tailored ad content for consumers in specific communities, cities, or regions.
Model Physical Locations
Many traditional analytics models omit geospatial data, meaning they only show part of the picture. These models can’t provide a holistic view of the customer journey because they don’t account for physical locations.
Adding geospatial data to the equation allows for performing real-world modeling of places. By modeling physical locations, more informed insights can be gained into market conditions, consumer trends, and other relevant factors influencing business performance.
Obtain More Accurate Predictions
Conducting market forecasting is a key component in business decision-making. However, forecasting processes are only as good as the data. If your data set omits geospatial information, you might overlook important trends or developments that could impact your bottom line.
By adding geospatial data to the mix, trends can be studied in the context of location information. In turn, you’ll be able to glean more accurate insights around what may happen and where it will occur.
What Data Visualization Is Used For
Before we shift our attention to how location data visualization helps expedite decision-making processes, it’s vital to understand the uses of this technique.
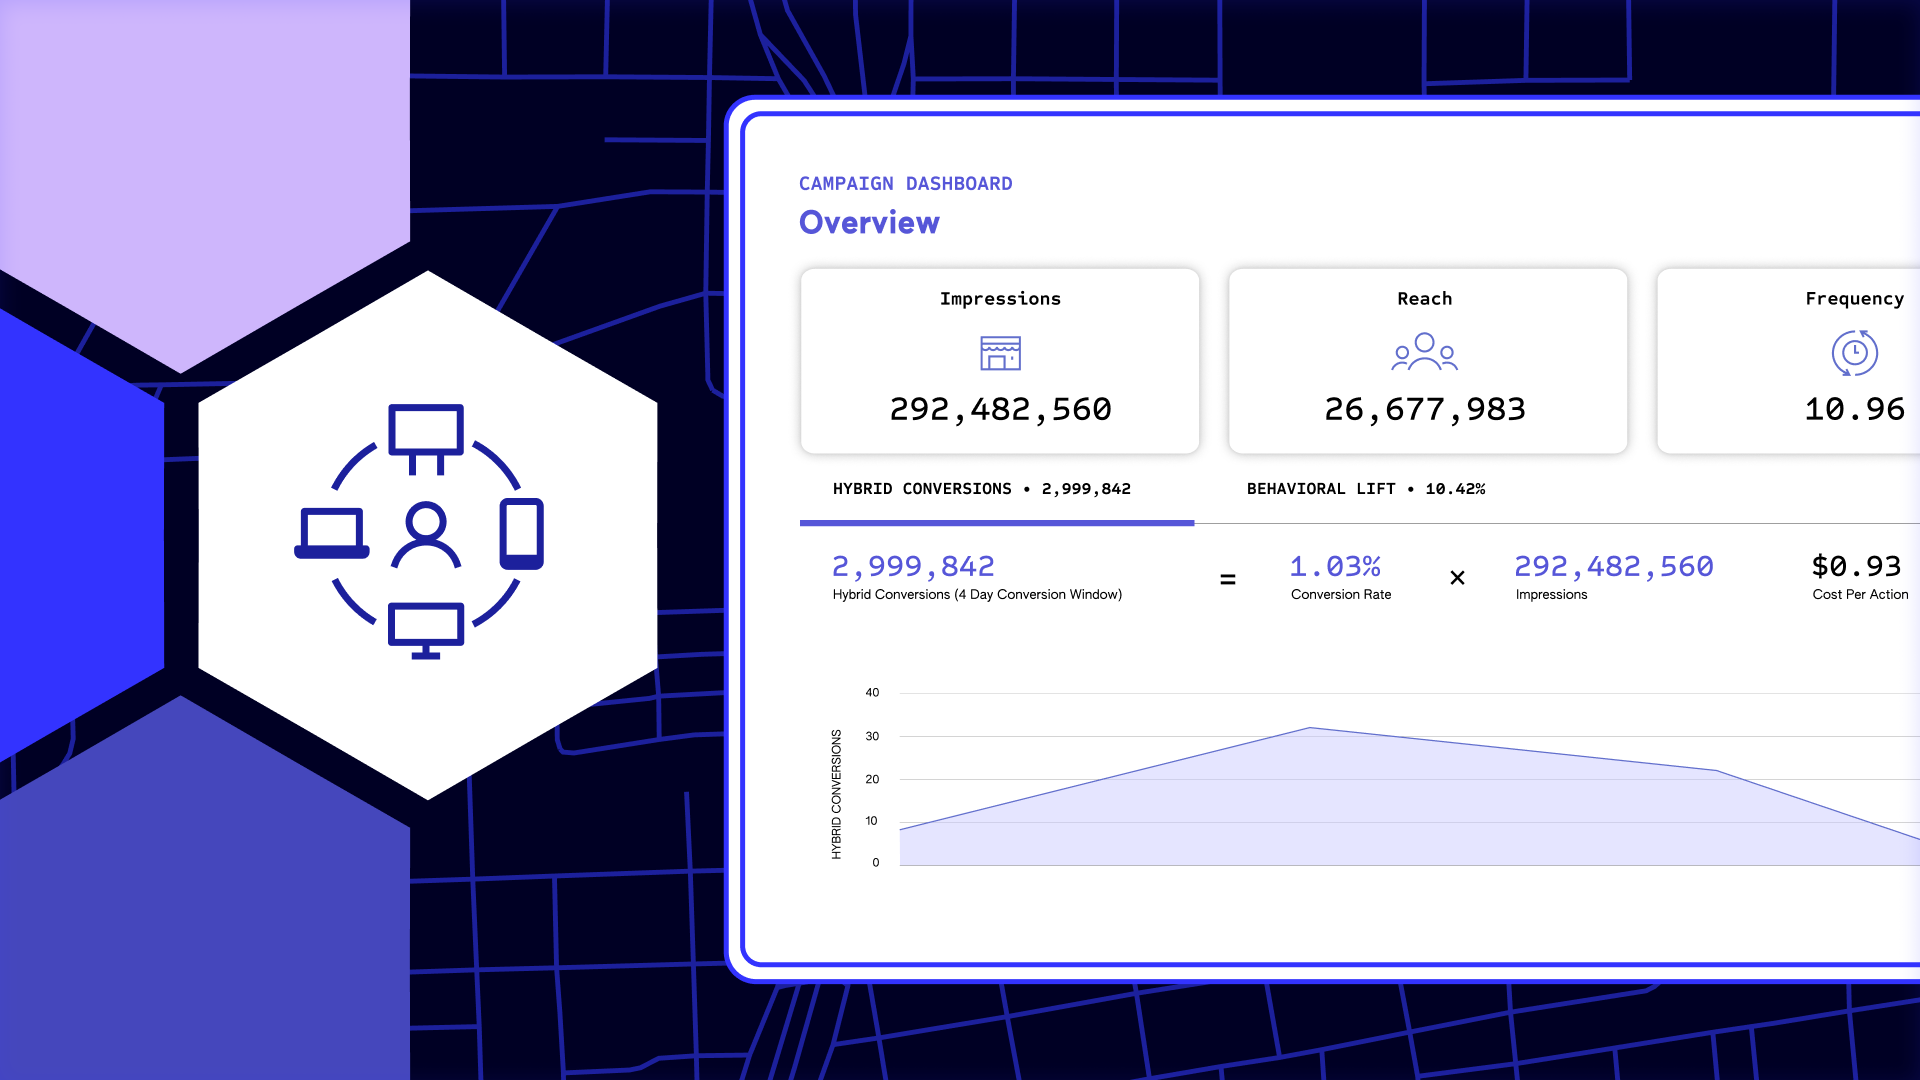
Data visualization expedites time to insights by transforming data into easy-to-digest charts or graphs. These charts can be quickly scanned to identify trends and patterns, pinpoint potential hurdles, and develop a winning strategy to move your business forward.
Location data visualization is a versatile concept that applies to various business challenges and pain points. Some of the most common uses of data visualization include:
Making Sense of Your Data
Interpreting data sets in the form of tables, rows, and columns can be burdensome, even when working with a relatively small pool of information. When dealing with a massive data set, it’s nearly impossible to make sense of such voluminous information without data visualization.
Location data visualization tools transform large data sets into information that’s easy to process and understand. These user-friendly charts and graphs can be deployed to help others understand the health of a given business and the state of its industry.
Speeding Up the Decision-Making Process
Thanks to modern technologies, businesses can gather significant amounts of consumer data at an unprecedented pace. However, as all that valuable data funnels into a business management system, there must be tools in place to make sense of the figures. In this situation, if no process is prepared, there’d be an abundance of data and no way to put it to use.
That’s where location data visualization comes into play. With visualization solutions, actionable intelligence can be quickly obtained from gigantic data sets. From there, the data can be used to make decisions in a timely, efficient manner, and to capitalize on fleeting business opportunities.
Identifying Anomalies
Were last month’s record-breaking sales figures a precursor to a business opportunity or an anomaly? With data visualization, the answer will be clear.
When a business experiences unexpected shifts in sales or business performance, it’s essential to identify the root cause of the incident.
For instance, if you enjoyed a historic sales month and the trend indicates it will continue throughout the year, you’ll need to invest in additional stock. On the other hand, if you buy extra inventory and the event proves to be an anomaly, you’ve just tied up working capital in unneeded goods.
Data visualization can help you avoid costly mistakes while empowering you to seize business growth opportunities.
Visualizing Complex Information
At the most basic level, location data visualization solutions allow businesses to turn complex information into approachable pictures, charts, and graphs. These resources are used to disseminate information across the C-Suite and to mobilize other business decision-makers into action.
Data visualization also promotes collaboration and communication within an organization.
Dynamic charts break down knowledge barriers between analysts, business leaders, and department managers. Data analysts with high-level technical expertise can share insights with other members of the organization in a simple format, thus enabling the latter to put the data to work.
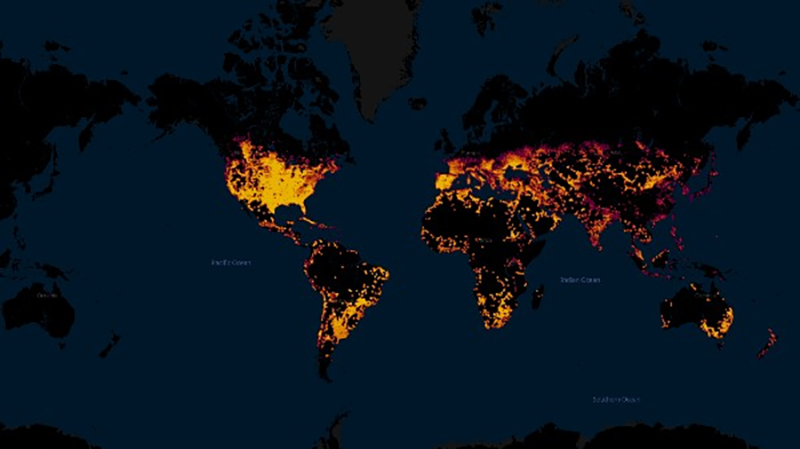
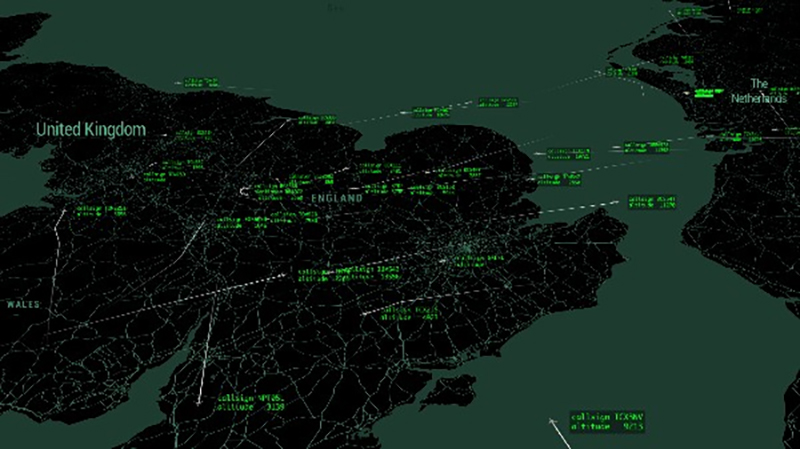
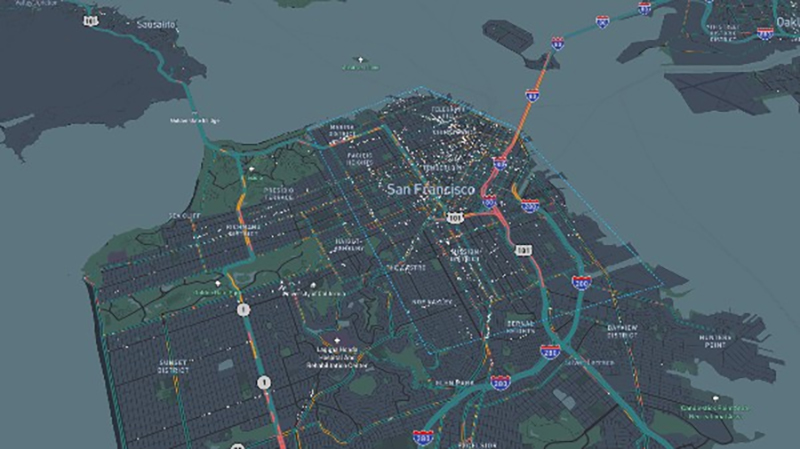
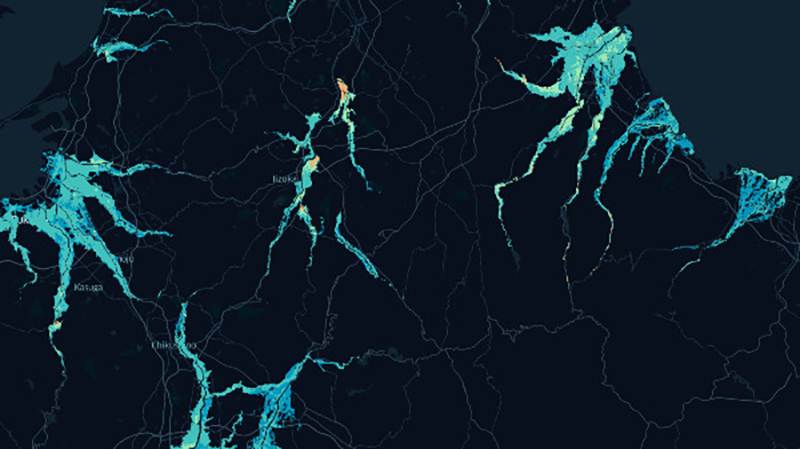
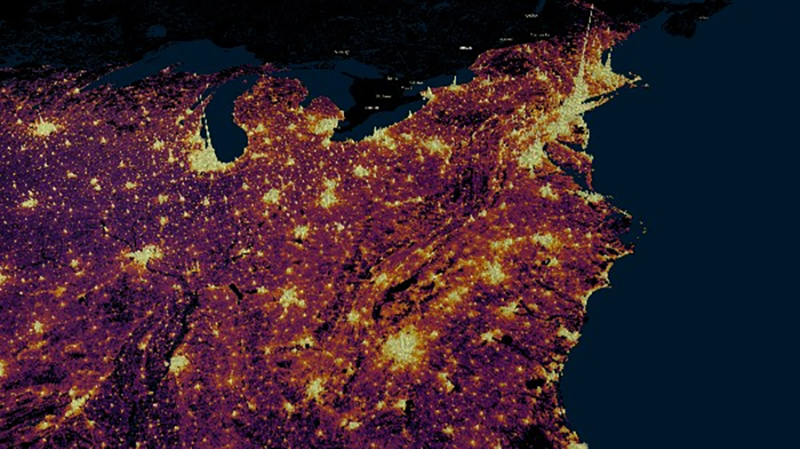
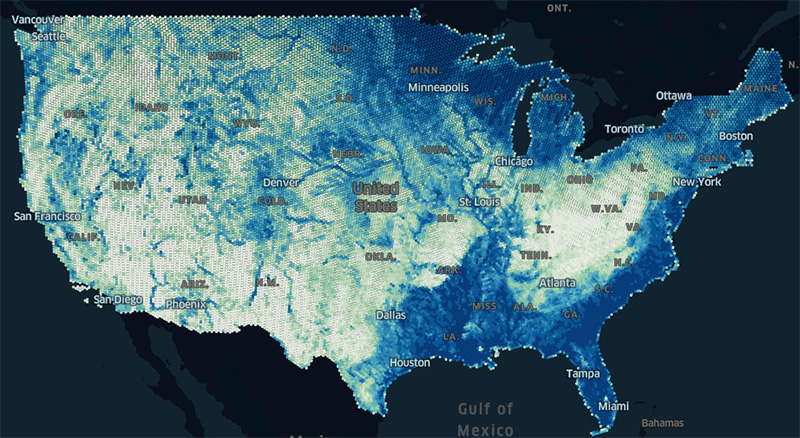
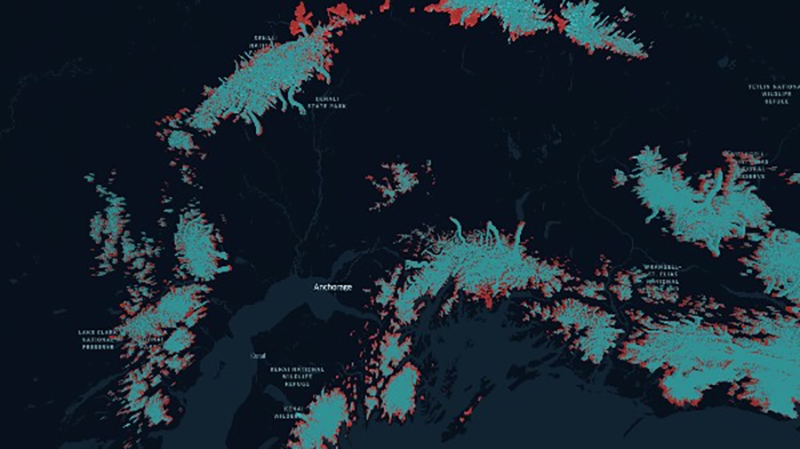
Examples of Data Visualizations from Foursquare
Foursquare Studio has developed several impactful visualization solutions that leverage geospatial data.
Our rapidly growing community of clients has used these tools to map and visualize a wide range of data sets. Some of the maps we love most visualize information like:
- Annual total sunshine duration
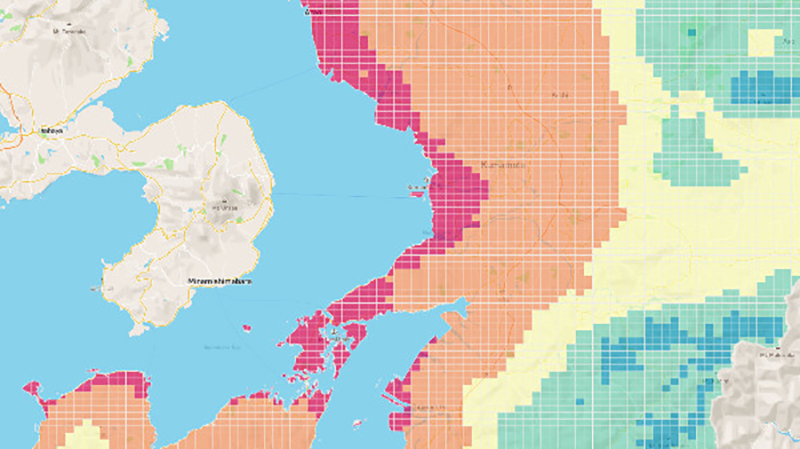
- Solar suitability areas
- The Woolsey fire

- Europe flights
- California restaurants
- Flood inundation forecasts
- 2020 housing census data
- Wetlands in the U.S.
- Alaska’s glacier loss
Many data visualization pros are also taking advantage of one of Foursquare’s newest features, Video Export, which enables users to export an animated map to a video file, making an engaging visual even more immersive.
Embrace Data Visualization with Foursquare
Location data visualization is an effective tool for speeding up business decision-making processes. The efficacy of this tactic can be maximized by incorporating geospatial data into any visualization process.
Interested in improving data visualization processes with geospatial information? Partner with Foursquare.Foursquare Studio helps business leaders embrace geospatial data visualization through its comprehensive tools and software. Contact Foursquare Studio and connect with one of our experts today to learn more.