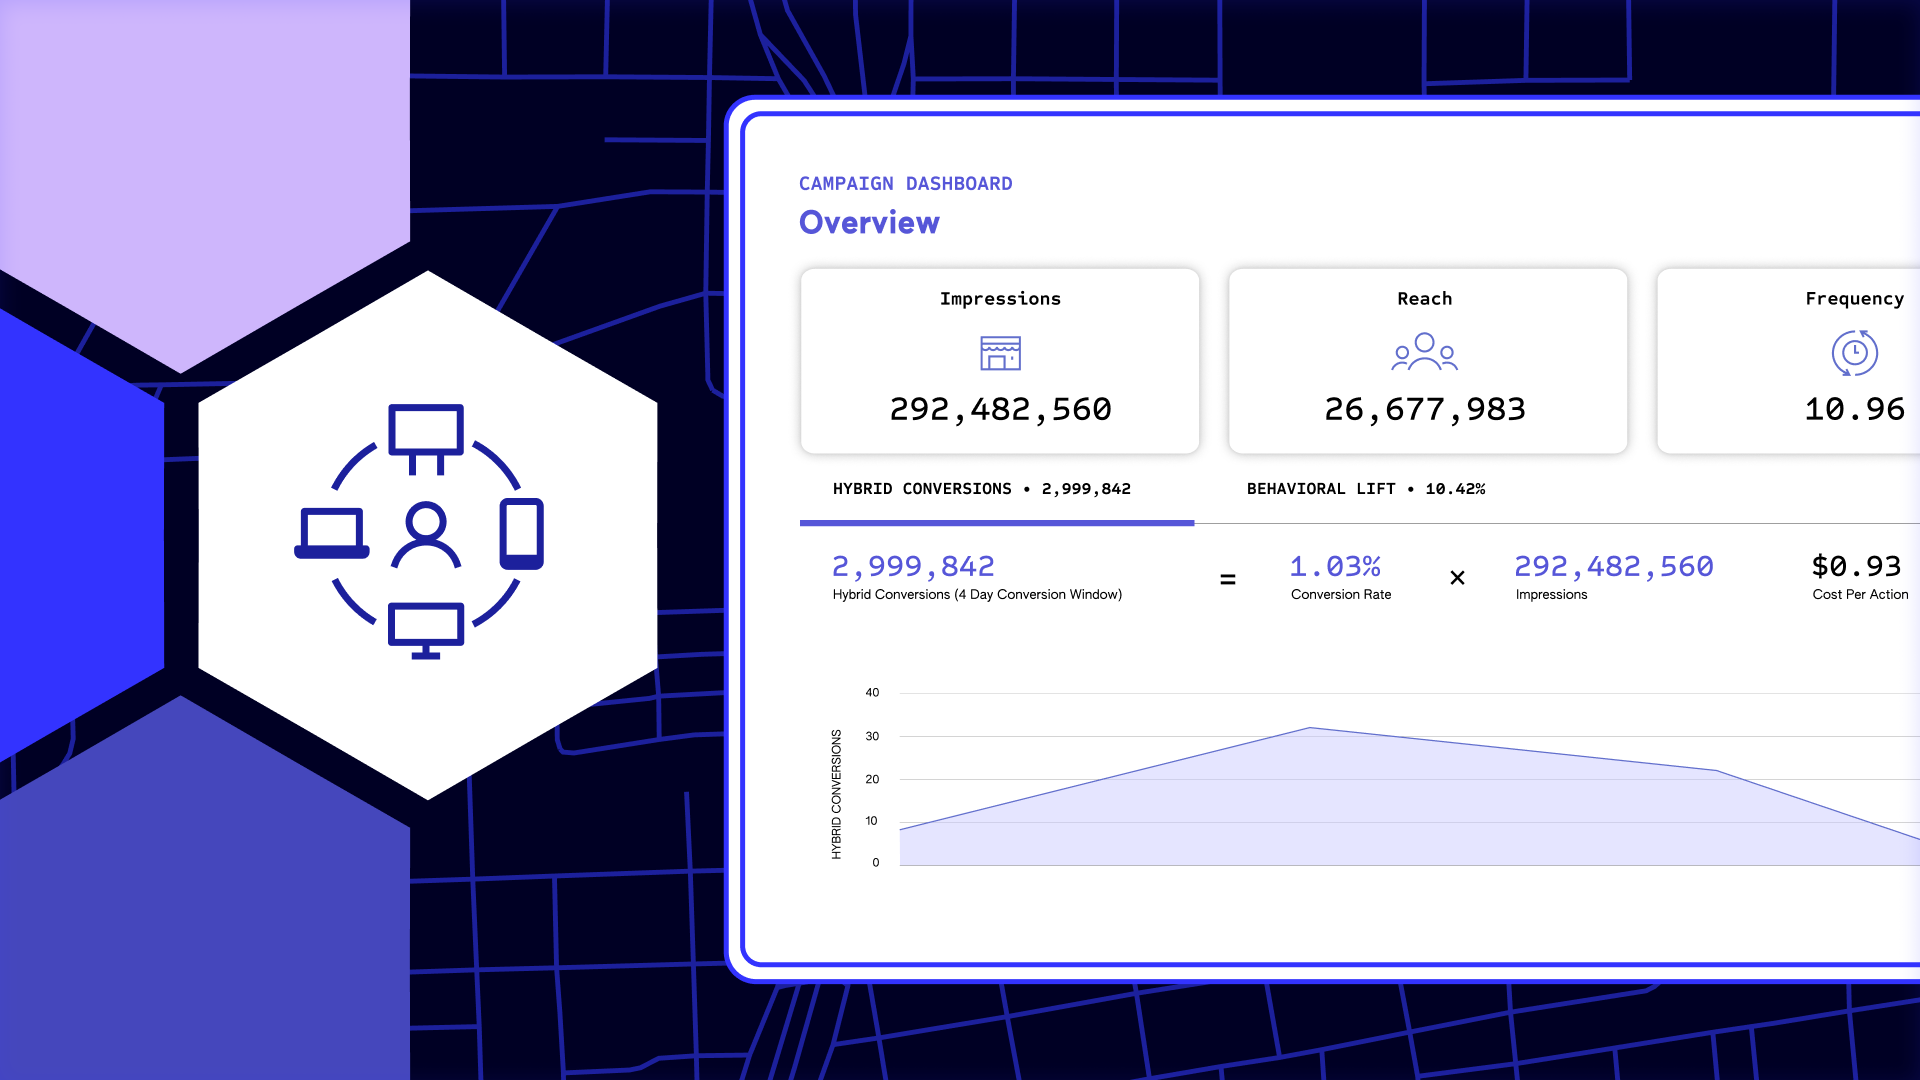
As you may have heard, Unfolded, a geospatial visualization and analytics platform, recently joined the Foursquare family. Built upon leading open source technologies H3, deck.gl and kepler.gl, Unfolded is designed to solve some of the toughest challenges in geospatial data science and analytics. Whether you are a data scientist, business analyst, geospatial expert, developer or academic, you can use Unfolded to bring together large-scale datasets of diverse formats, do things like complex spatio-temporal analysis and make stunning visualizations – all from your browser or via SDK.
What is geospatial data?
Geospatial data is a catch-all term that includes a wide variety of data types. This, of course, includes location data like Foursquare’s Places point of interest (POI) dataset. But there is also census data, for example – that can tell us the administrative boundaries of a town, zip code or county.
Beyond man-made businesses or boundaries, there are also the natural world and datasets made of satellite imagery that can tell us about weather, elevation, vegetation, and more. Bringing such datasets together – a process called “data enrichment” – allows you to deepen your analysis and understand even more.
But this is easier said than done…
The challenges of geospatial analytics
The age of big data brings big opportunities…and big challenges.
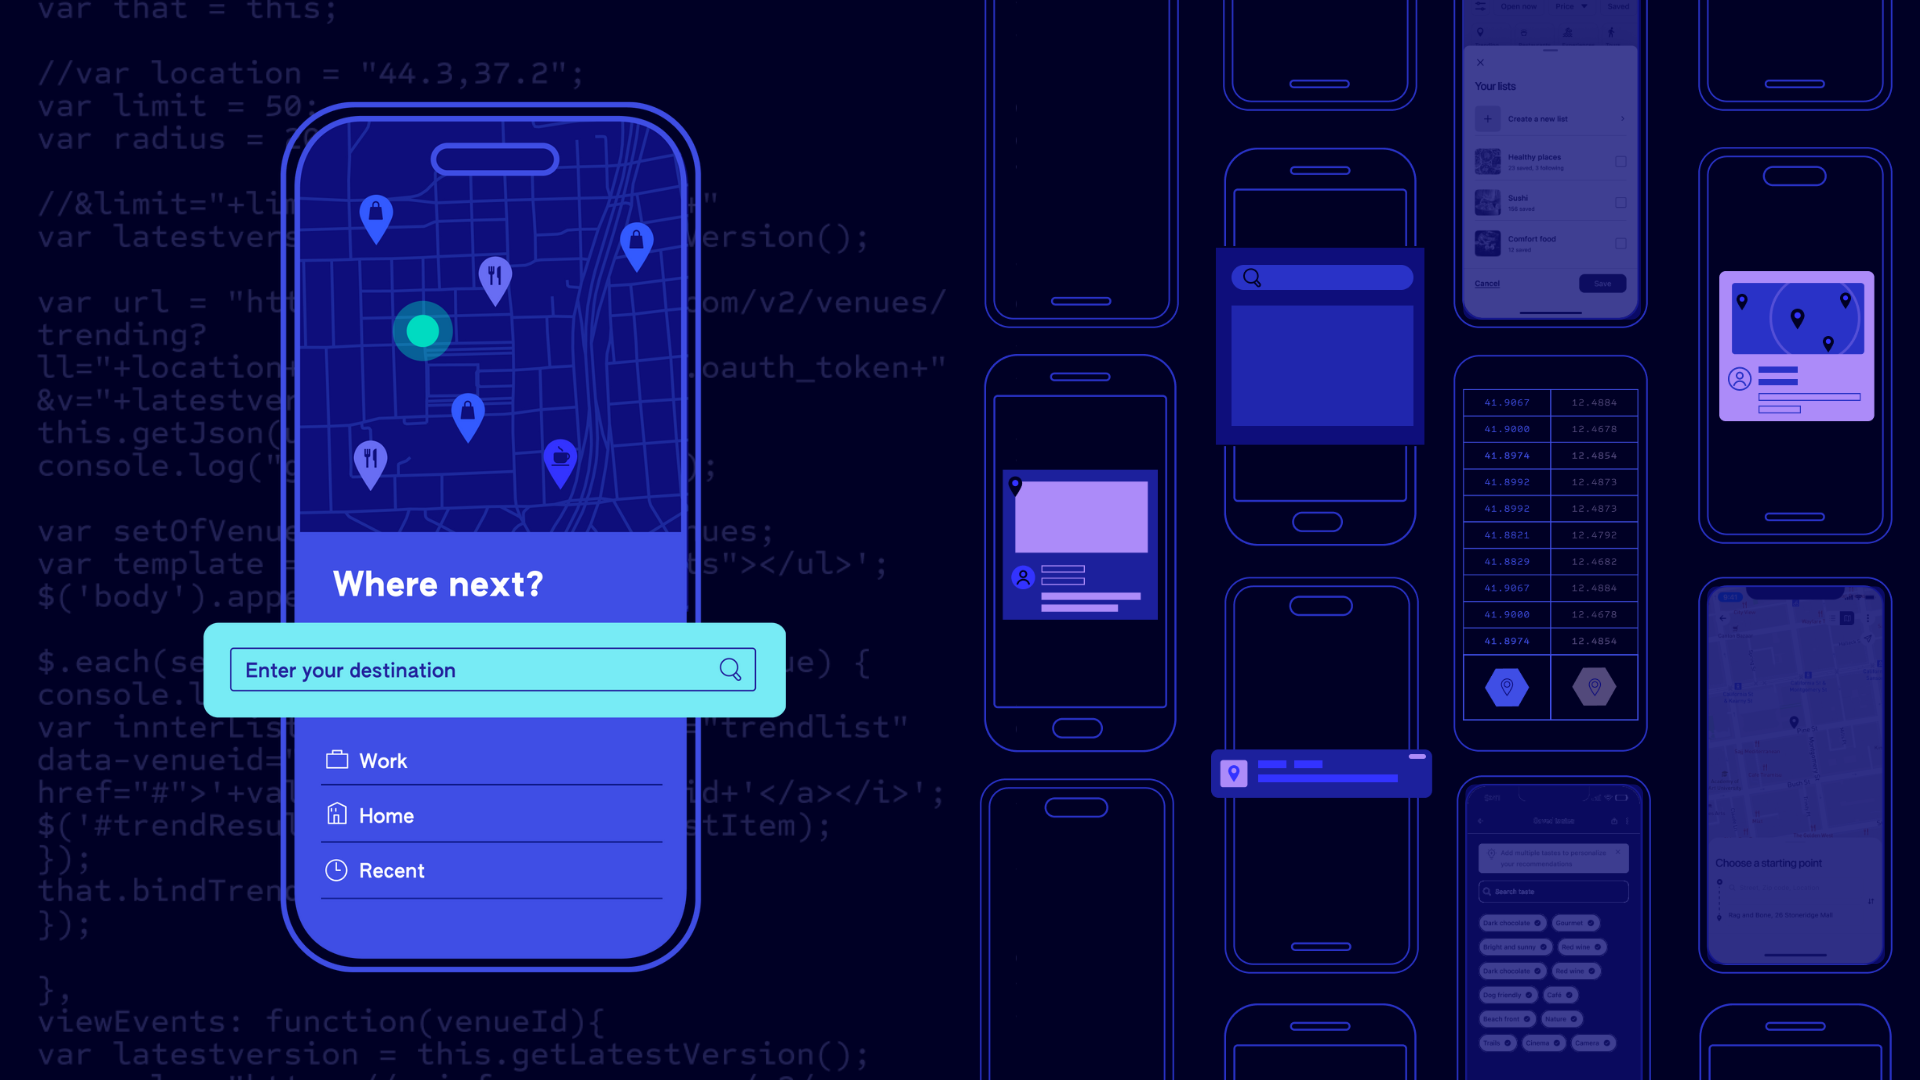
As some say, we are living in the age of “big data,” where information now pours off our devices – large and small. From cell phones to sensors to satellites, there are many sources of geospatial data now available that can help us understand the world like never before.
Many companies use such data to drive decision making (ex. smarter market analysis) and outpace their competition (ex. improving user experience), but why aren’t more businesses and brands taking advantage?
Here are just a few common challenges they face:
- Diverse data formats are hard to unify. From tabular census data to satellite imagery, it can be difficult to bring together disparate data for analysis.
- Dealing with movement and changes over time can be complex. It’s hard to understand how people, cars, planes, etc move or to analyze changes over time, say traffic congestion or crop disease.
- Large-scale data is hard to work with. Working with so-called “big data” typically requires certain skills and tech infrastructure. For example, you would need to know how to code in order to prep the data for analysis and also have the right tech set up to be able to use it without slowing down your systems. It can also be hard to find good quality data with the coverage and granularity you need for a given analysis.
Enter Unfolded. The best in geospatial technology.
Depending on your needs and set up, you can access the Unfolded platform from your browser or via SDK. Unfolded Studio is browser-based with an intuitive interface that lets you easily drag and drop in data or pull in data from our Data Catalog to quickly visualize it. For data scientists, developers and data operations teams, the SDKs may be a better fit as they allow you to leverage Unfolded’s technology from the comfort of your existing tools like Jupyter Notebooks or to customize your maps based on your company’s needs and branding.
Unfolded Studio
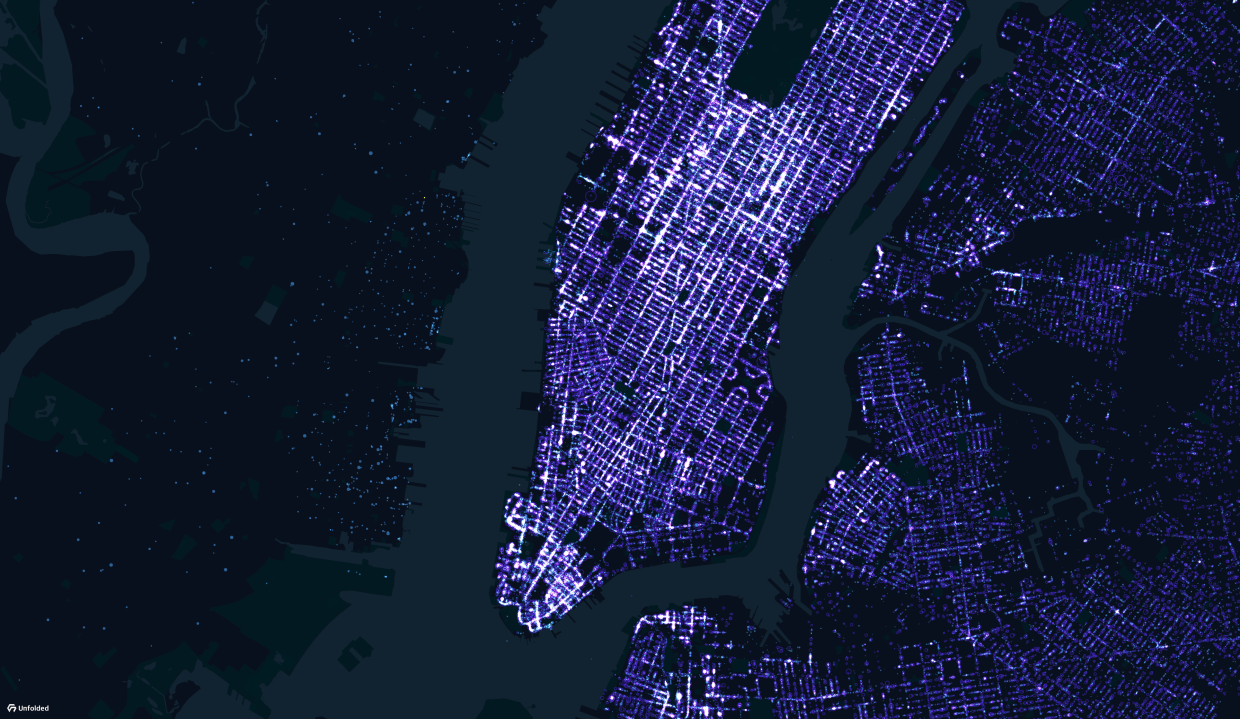
Stunning visualization, powerful analytics. All you need is your browser. The Unfolded Studio is a web app for geospatial analytics and visualization that helps you create and share maps from the browser. Free community and paid enterprise accounts available.
Unfolded Studio uses your computer’s processing power to fluidly render large-scale data in your browser.
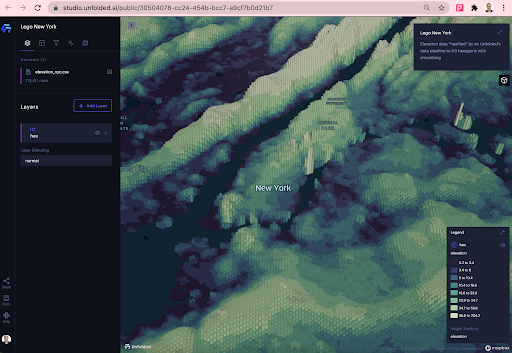
Unfolded SDKs
Access Unfolded technology without ever leaving your infrastructure. Customize and embed your maps on a website or Jupyter Notebooks.
The Unfolded SDKs offer nearly all the same functions as Unfolded Studio and enable data scientists to do dynamic analysis from Jupyter Notebooks as shown above.
- Map SDK: A Javascript library that allows developers to build custom geospatial applications. Control, embed and customize maps on your own webpage or Jupyter Notebooks.
- Data SDK: REST API and Python library to access the Unfolded platform. Manage geospatial data in the cloud for seamless integration with your work flows.
Get Started with Unfolded
Set up your free account or fill out the form below to speak with an expert about your needs. Check out our recent webinar to get a deep dive on H3 and how hexagons are at the heart of how Unfolded enables joining of diverse datasets and complex analysis.